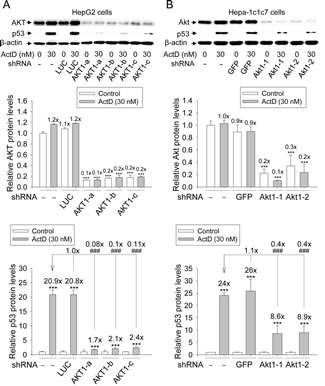
Figure 6. Effects of AKT RNAi on actinomycin D (ActD)-induced p53 expression.

(A) HepG2 cells, with and without shRNA-LUC and shRNA-AKT1 were treated with ActD (30 nM) for 6 h. (B) Hepa-1c1c7 cells with and without shRNA-GFP and shRNA-Akt1 were treated with ActD (30 nM) for 6 h. The AKT and p53 protein levels revealed by Western blotting were quantified and standardized against the amount of β-actin protein. The results are expressed as the mean ± SD (n=3). ***p<0.001 and ###p<0.001. * A comparison with DMSO-treated cells without shRNA. # A comparison with ActD-treated cells without shRNA.
