

Abstract
During the last decade, saliva has emerged as a potentially ideal diagnostic biofluid for noninvasive testing. In this paper, we present an automated, integrated platform useable by minimally trained personnel in the field for the diagnosis of respiratory diseases using human saliva as a sample specimen. In this platform, a saliva sample is loaded onto a disposable microfluidic chip containing all the necessary reagents and components required for saliva analysis. The chip is then inserted into the automated analyzer, the SDReader, where multiple potential protein biomarkers for respiratory diseases are measured simultaneously using a microsphere-based array via fluorescence sandwich immunoassays. The results are read optically, and the images are analyzed by a custom-designed algorithm. The fully automated assay requires as little as 10 μL of saliva sample, and the results are reported in 70 min. The performance of the platform was characterized by testing protein standard solutions, and the results were comparable to those from the 3.5-h lab bench assay that we have previously reported. The device was also deployed in two clinical environments where 273 human saliva samples collected from different subjects were successfully tested, demonstrating the device’s potential to assist clinicians with the diagnosis of respiratory diseases by providing timely protein biomarker profiling information. This platform, which combines non-invasive sample collection and fully automated analysis, can also be utilized in point-of-care diagnostics.
Introduction
Saliva has shown great potential as a diagnostic substitute for traditional biological samples (e.g. serum) based on several attractive properties.1–5 The collection of a saliva sample is noninvasive and can be performed by unskilled personnel, allowing saliva samples to be used in point-of-care (POC) diagnostics. Saliva samples can be easily collected from patients with special needs including infants, disabled patients, and anxious patients, for whom the collection of other samples is challenging, if not impossible.6 In addition, the high daily secretion volume of human saliva (0.5 L to 1.5 L) makes it an ideal candidate for disease monitoring and treatment evaluation, which require repeated sampling at short intervals.7
The global prevalence of respiratory diseases has been on the rise for more than 40 years.8–14 Today, there are hundreds of millions of people of all ages suffering from respiratory diseases, and most of these patients live in low- and middle- income countries.15 Two of the most widespread inflammatory respiratory diseases, asthma and cystic fibrosis (CF), were chosen for our study based on the high prevalence of asthma and significant morbidity of CF.15, 16 Saliva has been studied as a noninvasive alternative sample for respiratory disease research and diagnosis for more than 50 years because of the direct anatomic relationship between the oral cavity and the respiratory system.17–19
The desire for faster and cheaper diagnostic testing has pushed the development of POC devices in recent years.20, 21 POC diagnostic testing eliminates the transfer of samples to central laboratories, providing results in hours or even minutes instead of days or weeks.22, 23 Early detection of medical conditions and changes in disease status facilitates rapid treatment decisions, improves patient management and potentially saves lives.23 An ideal diagnostic system should fulfill several requirements including complete integration, automation, small sample volume, multiplexed detection ability, fast analysis, a self-contained package, and minimal training requirements.
Miniaturized immunoassays for POC measurements have been developed, and several reviews have been published describing the technology.24–27 A number of these applications rely on either physically adsorbing or spotting (printing) antibodies onto the surface of a glass substrate in a strip or array format. A cover plate containing microchannels is then bonded over the antibody strips or spots to direct fluid flow. While these devices have successfully been fabricated and demonstrated, spotting of antibodies is a meticulous and time-consuming process prone to manufacturing variations that can cause large degrees of measurement error.28 An alternative approach is to chemically immobilize antibodies onto microspheres. Microsphere-based immunoassays have a number of advantages over planar assays including better reproducibility in the attachment of antibodies to the surface, more flexibility in surface chemistry, and shorter analysis times.29–31 In addition, microspheres have a high surface-to-volume ratio leading to a greater number of capture antibodies available and therefore higher sensitivity compared to planar immunoassays.28, 32, 33
Here we report a novel integrated platform, consisting of the SDReader device and disposable microfluidic chips, for automated multiplexed protein profiling using saliva specimens. A saliva specimen is collected by having the subject spit into a tube kept on ice (Fig. 1a). The sample (Fig. 1b) is centrifuged, and the resulting supernatant (Fig. 1c) is loaded onto the microfluidic chip (Fig. 1d). The microfluidic chip, which includes an array of 888 microwells containing encoded polymer microspheres decorated with capture antibodies for different proteins, is inserted into the automated analyzer (i.e. the SDReader, Fig. 1e). Following sequential automated incubations with a saliva sample, biotinylated detection antibodies, and a streptavidin-conjugated fluorescent probe, the concentrations of multiple protein biomarkers in the saliva sample are quantified via sandwich immunoassays (Fig. 1f). The analysis requires as little as 10 μL of human saliva, and the results (i.e. concentrations of six inflammatory protein biomarkers) are reported in 70 min. The performance of the platform has been characterized using standard solutions of recombinant human proteins in blocking buffer. The results demonstrate the rapidity, specificity, and sensitivity of the platform. The device was also deployed in different clinics where saliva samples were tested. A total of 273 saliva samples were tested by the platform, including 117 samples from patients with CF, 106 samples from asthmatic patients, and 50 from healthy control individuals. To the best of our knowledge, this is the first integrated platform that enables automated multiplexed protein analysis using human saliva samples. Based on the non-invasive collection of the saliva samples and the automated analysis process, this platform shows great potential to be utilized in POC diagnosis of respiratory diseases.
Fig. 1.

Schematic of the multiplexed protein profiling of human saliva samples using an automated platform. (a) A saliva sample is collected by having the subject spit into a 50 mL tube kept on ice. Photographs of a saliva sample (b) before and (c) after centrifuging. (d) A photograph of a disposable microfluidic chip. Each chip contains an array of 888 microwells where encoded polymer microspheres decorated with capture antibodies for different proteins are deposited. (e) A photograph of the automated integrated device (i.e. SDReader). The device is powered by a conventional AC adapter providing 12 VDC at 8.5 A (not shown), and the case is 15 cm (wide) × 15 cm (tall) × 25 cm (deep). The weight of the device is 2.7 kg. Following sequential incubations with a saliva sample, biotinylated detection antibodies, and a streptavidin-conjugated fluorescent probe, the concentrations of multiple protein biomarkers in the saliva sample are quantified via sandwich immunoassays. (f) The bright-field image and three fluorescence images of the microsphere array on the microfluidic chip after saliva analysis. Top left: the bright-field image for microsphere registration. Top right: the encoding image from the red channel. Bottom left: the encoding image from the blue channel. Bottom right: the signal image.
Experimental
Materials
Carboxyl-functionalized microspheres (4.5-μm diameter) were purchased from Bangs Laboratories, Inc. (Fishers, IN). PBS StartingBlock T20 blocking buffer (PBSS buffer) was supplied by Thermo Scientific (Rockford, IL). Phosphate-buffered saline (PBS, 10×) and molecular biology purity grade water were ordered from Sigma-Aldrich (St. Louis, MO). Polyethylene glycol 10,000 (PEG 10k) was ordered from Alfa Aesar (Ward Hill, MA). Streptavidin R-phycoerythrin conjugate (SARPE), premium grade was purchased from Invitrogen (Grand Island, NY). All antibodies and recombinant human proteins were ordered from R&D Systems (Minneapolis, MN). Monoclonal mouse antibodies were used as capture antibodies for human VEGF (clone no. 26503), IP-10 (clone no. 33036), IL-8 (clone no. 6217), EGF (clone no. 10827), MMP-9 (clone no. 36020), and IL-1β (clone no. 2805). Mouse IgG isotype control antibody (clone no. 11711) was used as a negative control, as recommended by the manufacturer. Purified recombinant human proteins and biotinylated polyclonal goat antibodies were chosen as standards for microarray characterizations and detection antibodies, respectively.
Sylgard 184 polydimethyl siloxane (PDMS) was purchased from Ellsworth Adhesives (Germantown, WI). Silicon wafers (150 mm) were ordered from University Wafer (Boston, MA). Trichloro(octyl)silane, 97% was purchased from Sigma-Aldrich (St. Louis, MO). KMPR 1010 photoresist and SU8-2000 thinner were obtained from MicroChem Corp. (Newton, MA). Shipley Microposit MF CD-26 Developer was ordered from Shipley Company (Marlborough, MA). D263 glass was supplied by S.I. Howard Glass Co., Inc. (Worcester, MA). Norland 63 UV epoxy was supplied by Norland Products (Cranbury, NJ).
Microsphere modifications
The detailed protocols for microsphere encoding and coupling have been reported previously.34 Briefly, microspheres with diameters of 4.5 μm were internally encoded with different combinations of two fluorescent dyes (three concentration levels of each dye) to generate eight possible encodings. Seven encodings were used in this study, one each for the six capture antibodies and one negative control.35 Antibodies were coupled to the microspheres’ surfaces via carboxyl groups using the EDC/sulfo-NHS coupling method.
Channel geometry and array integration on the microfluidic chip
A simple PDMS/glass microfluidic chip that seamlessly integrates microfluidic channels for delivery of sample and reagents to an array of 888 microwells was developed in conjunction with the SDReader for this study. Each microwell was designed to hold a single encoded antibody-functionalized microsphere for performing a sandwich immunoassay. The length of the waste channel was shortened relative to that of the previously reported design36 to improve flow when used with the integrated vacuum pump on the SDReader. Fig. 2a shows an image of the PDMS layer on the chip with channels filled with ink for visualization. The chip consists of a network of microfluidic channels including one sample well and three reagent wells (A–D) that join to a main channel incorporating an array of 888 microwells (M). Vacuum is applied at the waste well (W) to generate fluid flow. All reagent wells and the waste well are 3 mm in diameter. The microfluidic channels are 60-μm wide and 30-μm deep. The hexagonal close-packed microwells have a depth of 4 μm, diameter of 3.4 μm, and center-to-center spacing of 7.8 μm to accommodate microspheres with average diameters of 4.5 μm. The microsphere array area (~280 × 220 μm2) was designed to fill the field of view of the CCD camera on the SDReader with sufficient optical resolution for imaging the microspheres. Integrated actuator valves on the SDReader (shown in Fig. 2b) are used to mechanically pinch the channels leading from the reagent wells to control reagent delivery from the respective wells (shown in Fig. 2c). By controlling the opening and closing of these valves, saliva sample, biotinylated detection antibodies, fluorescent probe, and washing buffer can be delivered to the microsphere array (shown in Fig. 2d) automatically.
Fig. 2.

(a) A photograph of the PDMS layer on the microfluidic chip (for better demonstration, all wells and channels are filled with ink). Inputs A–D are reagent wells for saliva sample, biotinylated detection antibodies, streptavidin-fluorescent probe, and washing buffer introduction, respectively. The array of 888 microwells is located in the region M of the channel, and vacuum is applied at output W where waste is also collected. The four red rectangles show the positions where the actuator valves on the SDReader pinch to control fluid flow. (b) Photograph of the actuator valve on the SDReader. (c) Cross sectional diagram of the microfluidic channels at the red rectangles in Fig. 2a showing the open (left) and closed (right) channels. (d) Cross section diagram of the microsphere array chamber showing the microspheres loaded into the PDMS microwells. Figs. 2c and 2d are not to scale.
Microfluidic chip fabrication
To mold the PDMS microfluidic chips, a negative master was fabricated in silicon. A chrome-on-glass photomask for the microsphere array pattern and a film photoplot mask with the microchannel pattern (Infinite Graphics, Inc., Minneapolis, MN) were used. Silicon wafers (150 mm) were first patterned with the microwell array features in KMPR photoresist (diluted to 35% solids with SU8-2000 thinner) using a Karl Suss MA6/BA6 mask aligner. Each wafer was patterned for 10 devices. After post-exposure baking and development with Microposit MF CD-26 Developer, the wafers were heated to 100 °C for 5 min and allowed to cool to room temperature (RT) to anneal the small circular features and improve adhesion. The wafers were loaded into an Alcatel AMS 100 Deep Reactive Ion Etcher (DRIE) and plasma cleaned at in oxygen plasma (500 W) for 30 s. The patterned features were then etched to a depth of ≈ 4 μm (the microwell array) using SF6 and C4F8 with a low roughness Bosch process. The photoresist was then burned off the wafers with a 2 kW oxygen plasma treatment.
After the microwell array was formed, the wafer was then patterned with the channel features in KMPR 1010 (undiluted) using the mask aligner. After post-exposure bake and development, the wafer was heated to 100 °C for 5 min and allowed to cool to RT. The wafer was then etched in the DRIE using the same process to a depth of 30 μm, and the photoresist was removed with oxygen plasma. Wafers were then loaded into a vacuum oven with 500 μL of trichloro(octyl)silane. After a vacuum of ≈ 1 kPa (abs) was achieved, the oven was heated to 125 °C at which point the oven was sealed and the vacuum pump was turned off. After 2 h the oven was vented, and the wafers were allowed to cool before washing with ethanol and drying.
In order to make PDMS castings of the silicon master, PDMS prepolymer was spin casted onto the master at 300 rpm for 30 s, allowed to sit on a level surface for 5 min, and cured at 150 °C. Three layers were cast in this manner with a resulting total thickness of ~1 mm. The PDMS casting was demolded and cut to form 10 separate chips. Five wells (the sample well, three reagent wells, and the waste well) were then punched at the ends of each channel using 3 mm biopsy punches (Sklar Instruments, West Chester, PA). Each PDMS chip was then irreversibly bonded to a 0.4 mm thick piece of D263 base glass using a 12 s air plasma (model 32G, Harrick Plasma, Ithaca, NY) treatment at 18 W. The bonded chip was then heated to 95 °C for at least 1 h. The bonded PDMS chip was then UV epoxied to a 50.8 mm × 50.8 mm × 0.56 mm D263 carrier substrate using an alignment jig so that the microsphere array was aligned with the CCD camera of the SDReader when inserted into the device.
Microfluidic chip loading
The microfluidic chip was loaded with the microspheres and imaged at Tufts before being sent to the clinics. A unique barcode was generated and assigned to each chip for registration purpose (shown in Fig. 1d). Microsphere slurry (0.5 μL, containing ~1.0 × 10⁶ solid microspheres) was added to reagent well A, a pipet tip was gently pressed against the PDMS layer and drawn along the channel between reagent well A and the array (M) in order to fill the array chamber with microsphere slurry. Once the array chamber was filled with slurry, the chip was inserted into a custom-designed loading device (see Fig. S3 in ESI†), and the PDMS was automatically pressed against the glass for 60–80 times within a 3 min timeframe, trapping microspheres and forcing them into the wells. After the loading process, the microfluidic channels were rinsed with PBS buffer containing 0.1% PEG 10k (PBSP buffer) for 1 min; all loose microspheres were washed away. The microsphere array was then consecutively imaged under white, red, and blue illumination using exposure times of 100 ms, 1.5 s, and 600 ms, respectively. All resulting images were saved with the microfluidic chip barcode contained in the file names. The loaded chip was then sealed with PCR sealing tape and stored at 4 °C until used. In our experience, the loaded microspheres could be stored for more than four months without detectable loss of response signals.
Configuration of the SDReader
The SDReader, which is powered by a conventional AC adapter (supplying 12 VDC at 8.5 A, EDACPOWER, Taipei, Taiwan), consists of three parts: the microcomputer for device control and automation (shown in Fig. 3a), the mechanism for solution flow control (shown in Fig. 3a and 3b), and the imaging system. The computer system is a VIA Pico-ITX microcomputer (Via Technologies, Taipei, Taiwan) containing a 1 GHz CPU, 1 GB RAM, and a 250 GB HDD drive, and runs Windows XP. The device automation and control are carried out by an executable program written in LabVIEW (National Instruments Corporation, Austin, TX). A 5.0 inch touch screen (AZ Displays, Inc., Aliso Viejo, CA) was used for display and control. The back panel of the SDReader is equipped with one Ethernet port, two PS/2 ports (designed for external keyboard and mouse), one USB port, and a cooling fan (shown in Fig. 3c).
Fig. 3.
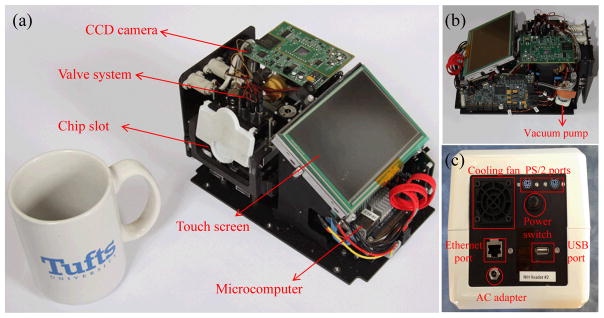
Photographs of the SDReader with the outer case was removed. (a) A photograph of the SDReader and a coffee mug. (b) Photograph of the SDReader from the right side. (c) Photograph of the back panel of the SDReader.
The flow control mechanism consists of four integrated actuator valves and a vacuum pump. The valves line up with microfluidic channels linking each of four reagent wells to the main channel on the microfluidic chip (red rectangles in Fig. 2a), and a miniature diaphragm pump (ACI Medical, San Marcos, CA) is applied to the waste well on the chip to generate fluid flow. When one of the valves is opened, solution from the corresponding reagent well is drawn into the microsphere array by the pressure differential generated by the vacuum pump. The custom actuator valve system is discussed in detail below.
The imaging system contains two LEDs (white and green), a custom objective lens assembly, a moving platform for image focusing, an optical channel for light transmission, a phycoerythrin (PE) fluorescence filter cube (Semrock, Inc., Rochester, NY), and a custom CCD camera for image capture. The white LED (OSRAM GmbH, Munich, Germany) is used to take bright field images for microsphere registration, while the green Luxeon Rebel LED (Philips Lumileds Lighting Company, San Jose, CA) is used to excite the immunoassay reporter fluorophore.
Subject Recruitment and Saliva Collection
Subjects with asthma and CF were recruited from the Boston Medical Center Asthma Clinic and Emergency Departments, and Boston Children’s Hospital Pulmonary Clinic, respectively. Healthy control subjects were recruited from the Boston University Dental Clinics. All subjects provided informed consent and studies were approved by respective Institutional Review Boards.
A masticatory saliva sample was collected using standardized methods as previously described.38 Briefly, after a 30 min period of food or liquid abstinence, subjects chew on a neutral substance (Parafilm) and clear their mouth of saliva every 30 seconds into a 50 mL polystyrene tube kept on ice. This procedure is repeated until 6–10 mL of whole saliva are collected. Saliva supernatant was separated by centrifugation at 13,000g for 20 min and analyzed immediately or stored at −80 °C.
Saliva analysis
The chip loaded with microspheres was cleaned using a paper wipe and the PCR tape sealing the chip was peeled off. A disposable reagent reservoir and a waste reservoir were sealed onto the chip using double sided tape. The loading buffer in all reagent wells was removed and solutions were added according to Table 1. After the barcodes of the saliva sample and microfluidic chip were typed or scanned and the fully assembled chip was fed into the SDReader, the automated analysis procedure was initiated. One feature named “ultra-flow” was developed and implemented in all reagent incubations where the reagents were kept flowing for 5 s every 2 min to introduce fresh reagents into the array. The analysis was performed as follows: ultra-flow of saliva sample 30 min, buffer rinse 2 min, ultra-flow biotinylated detection antibody mixture 15 min, buffer rinse 2 min, ultra-flow streptavidin-dye solution 8 min, and final buffer rinse 3 min (details in ESI†). The objective lens was then automatically driven by a linear actuator and the optimal focusing position was determined as described below. The microsphere array was subsequently imaged under white and green LED illumination using exposure times of 100 ms and 1 s, respectively. Both images were automatically saved on the hard drive with the saliva sample and microfluidic chip barcodes contained in the file names.
Table 1.
Solutions added to reagent wells.
| Well | Reagent | Volume (μL) | Reagent Details |
|---|---|---|---|
| A | Saliva sample | 20 | 10 μL saliva mixed with 10 μL PBSS buffer |
| B | Detection antibodies | 20 | 5 μg mL−1 of each type of antibodies, in PBSS buffer |
| C | Streptavid in-dye | 20 | 20 μg mL−1 SARPE, in PBSP buffer |
| D | Washing buffer | 60 | PBSP buffer |
Image processing and data analysis
One complete set of data, including three encoding images (Fig. 4a–c) and two assay images (Fig. 4e and 4f), is shown in Fig. 4. The encoding images were taken on a fluorescence microscope at Tufts several weeks before saliva analysis, and the assay images were captured by the SDReader after the assay. Images were analyzed using a custom designed algorithm in MATLAB (MathWorks, Inc., Natick, MA). The three encoding images were processed as previously described34 to generate a decoding table for all the microspheres. Any hard-to-categorize microspheres were excluded from the analysis; representative decoding results are shown in Fig. 4d. An overall encoding accuracy above 99% is achieved with the current settings. A similar process was applied to the two assay images to generate the signal intensity table for these microspheres. The two tables were then combined to assign the encoding type and analytical signal intensity for each microsphere.
Fig. 4.

A typical set of images for a saliva sample and the representative decoding results. (a) bright field encoding image, (b) encoding image from the red channel, and (c) encoding image from the blue channel taken on a fluorescence microscope after chip loading. Images a–c are used to decode each microsphere. (d) Representative decoding results of different microsphere types based on their intensities in the red and blue channels. (e) Bright field image and (f) assay signal image taken on the SDReader after saliva sample analysis. Images e and f are used to calculate the assay intensity of each microsphere. All scale bars are 50 μm.
A minimum of 25 microspheres was required for each analyte in each experiment to ensure the statistical confidence of the data; otherwise, the entire set of images was excluded from analysis. The average signal intensity on each microsphere type was calculated by trimean, which is defined as the weighted average of the distribution median and its two quartiles.37 The definition is shown in Equation 1, where Q1, Q2, and Q3 denote the 25%, 50% and 75% points in a distribution, respectively. This statistic protects the population center against outliers, which in our case are usually caused by light scattering and can change the mean value significantly.
| (Equation 1) |
The fluorescence responses for different protein biomarkers from immunoassays were calculated by subtracting the signal from the control microspheres. All data analysis proceeds unsupervised by the user; analysis reports are automatically generated by the SDReader algorithm.
System characterization
The platform was characterized using recombinant protein standard mixtures at different concentrations. Three independent measurements were performed at each concentration and the average responses were used to generate a response curve using a 4-parameter logistic regression (4PL) model (details in ESI†). Data were analyzed using Origin (OriginLab Corporation, Northampton, MA).
Results and discussion
Chip geometry and fabrication
Silicon molds for chip fabrication were used more than 20 times each to cast more than 200 devices (10 devices/casting). The post arrays were durable, and few, if any posts severed from the mold over many casting cycles. No degradation of the silane coating was noted. The reduction of the channel length between the array and the waste wells as compared to earlier devices improved the flow of reagents through the chip when used on the SDReader, and ultimately resulted in faster and more effective washing steps. The alignment of the bonded PDMS chip onto the glass carrier substrate was reproducible within ± 15 μm (both x and y directions), ensuring that the SDReader camera could image the entire microsphere array. The UV epoxy did not significantly contribute to fluorescence background signal because it was thin and outside the plane of focus.
Surface passivation of both the PDMS and glass surfaces is essential to ensure compatibility with the biological sample matrix and assay reagents. The hydrophobic nature of the PDMS surface can lead to adsorption of biomolecules such as proteins and nucleic acids. Therefore, considerable effort in recent years has gone into increasing the biocompatibility of PDMS and glass surfaces.39–44 Both static and dynamic surface passivation agents were investigated for use with this device as the high abundance of mucins in saliva samples presents a challenging sample matrix.45 A marked increase in the average signal intensity and S/N ratio were found when 0.1% PEG 10k was added to PBS (see ESI†). For these reasons, PBSP buffer was chosen as the passivation and washing buffer for all immunoassays.
Chip loading
Microsphere loading and retention in PDMS chips has been reported36 and is known to be dependent on well geometry. Previously reported work used focused ion beam (FIB) milling to create molds for PDMS chips with microsphere arrays. These milled microsphere wells had a conical shape that was shown to load microspheres to a high occupancy. DRIE fabrication of posts for molding microwells results in cylindrical wells. DRIE fabrication is preferable to FIB milling because it is less expensive and can be used in a batch process to quickly and reproducibly create many relatively inexpensive molds. Microsphere loading in DRIE fabricated microwells was studied as a function of well geometry (see ESI†), and the optimal microsphere well geometry was chosen.
Chip loading was evaluated in terms of microwell occupancy, i.e. the total number of wells containing only one microsphere after the loading process. It was determined that a simple geometry consisting of a cylindrical well with a diameter slightly smaller than the microsphere diameter (~75% of the microsphere diameter) was able to be loaded quickly without instances of multiple microspheres loading into the same well. Automated loading with the loading device was simple and reproducible. Furthermore, loading could be observed in real time by imaging the array on a fluorescence microscope setup while loading. High occupancies ranging from 62–96% (550–850 microspheres) could be achieved with 60–80 total presses delivered over a timeframe of 3 min. The high loading occupancy and evenly adjusted distribution of different types of microspheres in the loading slurry were essential to ensure enough microspheres (>25 of each type) were present for the analysis to be statistically meaningful. Our current settings allow multiplexed profiling of up to 10 proteins by a single assay; higher levels of multiplexing are limited by the difficulty of ensuring that 25 microspheres of each type are loaded into the array. Images of the loaded microspheres indicate that they are not damaged or altered by forceful contact with the PDMS or glass (see Fig. 4).
SDReader configuration
A novel type of actuator valve was developed and implemented in the device for repeatable and durable solution flow control in the microfluidic chips (shown in Fig. S5a and S5b in ESI†). The actuator valve is driven by a modified, miniature, brushless motor and integrated gearbox (Maxon Motors, Fall River, MA, shown in Fig. S5c in ESI†). The commercial off-the-shelf motor/gearbox assembly was modified by the manufacturer with a mounting thread in the bottom of the gearbox housing, allowing the motor to be screwed into position in the mounting block. In addition, the motor is held by a set screw. The motor is built with an integrated, laser-welded lead screw. The lead screw is threaded onto a nut, which is captured by the actuator mount. Rotation of the lead screw drives the captured nut up and down, applying pressure on the valve pins. A spring above the captured nut and a small, rubber o-ring between the captured nut and the pin are used to provide spring force for both directions of motion in order to control the position of the valve.
The gearbox design of the actuator valve also ensures a repeatable applied force across a series of open/close cycles. The motor generates a force that is directly proportional to the applied current and stops once the current rises above a user-defined threshold. The motor runs at a few thousand rpms under normal operation. The integrated gearbox has a gear ratio of ~200:1. At this gear ratio, the valve is able to maintain sufficient pressure to keep the PDMS compressed without keeping the motor energized. This design also allows the generation of an appropriate force to seal off the microfluidic channel while avoiding breakage of the microfluidic chip. The four motors on the device were tested on a microfluidic chip, and multiple open/close cycles were performed. The variation of the applied currents when the actuators were stopped indicates the variation of the closing force applied on the microfluidic channels (see Table S2 in ESI† for details). Overall, the closing force varied by 6.8% across all four actuators and 17 cycles of each actuator, which demonstrates the high repeatability of the closing force applied by the actuator valves. More than 1,000 open/close cycles were successfully performed on each valve with no system failure observed.
Fluid motion was achieved using a small diaphragm pump. The pump is linked via a ‘T’ to a needle valve (Beswick Engineering, Greenland, NH) venting to air, which was adjusted to provide the appropriate vacuum force to move fluid through the microfluidic channels. A 0.2 μm membrane filter is placed after the needle valve to prevent particles and solvent aerosols from being pulled into the pump. The air pressure in the vacuum system is monitored by an integrated air pressure sensor.
The image capture system is designed for high sensitivity, long durability, and ease of modification. Two long-life LEDs are used as light sources, and the light intensities are adjusted by controlling the applied voltages. The optical channel design provides 27.8X magnification over a 350 × 280 μm2 field of view and high collection efficiency (NA ~0.55). The objective lens was mounted on an adjustable mount, which was driven by a high-precision linear actuator (Haydon Kerk, Waterbury, CT). The precision of the linear actuator, combined with a 3:1 lever arm in the adjustable mount gives a focusing precision of <1 μm. A simple auto-focusing algorithm was developed, based on maximizing the variation of light intensity across all pixels in the field of view. A coarse adjustment of ~10 μm steps followed by a fine adjustment of ~2 μm steps was sufficient to provide high-quality images of the microsphere array. The image is finally captured by a CCD camera based upon an ICX285AL image sensor (SONY Corporation, Tokyo, Japan), which has very low noise at RT.
Protein biomarker selection
Based on our previous results,34 the following six inflammatory protein biomarkers that potentially correlate with asthma and CF were chosen for this study: human vascular endothelial growth factor (VEGF), interferon gamma-induced protein 10 (IP-10), interleukin-8 (IL-8), epidermal growth factor (EGF), matrix metalloproteinase 9 (MMP-9), and interleukin-1 beta (IL-1β). The current settings of the platform allow simultaneous analysis of up to 10 different proteins in a single assay.
Assay process
The saliva assay was fully automated with pre-optimized parameters to achieve better performance and prevent user error. Two special features, termed “reagent-rinse” and “ultra-flow”, were implemented to increase the reproducibility as well as the reaction speed and sensitivity of the assay. In the reagent-rinse process, the microfluidic channel is rinsed with the reagent solution for 1 min before each incubation step. This rinse step minimizes dilution effects caused by solution left over in the microfluidic channels from the previous steps and increases the reproducibility of the assay. The ultra-flow process minimizes the effects of reagent depletion during the incubation and increases the reaction speed and sensitivity. Because of the extremely low volume of the microsphere array chamber (~2.6 nL) and the low concentrations of some protein biomarkers in the sample (in the low pico-molar range), the ultra-flow process was designed such that the reagent solution is actively flowed for 5 s every 2 min in all incubation steps to continuously introduce fresh solution into the reaction array. Ultra-flow is most helpful in the saliva sample incubation step considering the long incubation time (30 min) and low protein concentrations. Our results confirmed that 5 s is long enough to fill the array chamber with fresh solution from the reagent wells with the current flow control settings. The flow speed in the microfluidic channels, which can be controlled by changing the vacuum pressure, may affect the binding efficiency of the assay; further optimization may result in more repeatable assay results.
System characterization
The performance of the SDReader was characterized using solutions of recombinant human protein standards in blocking buffer. Loaded chips were first tested using PBSS buffer in three independent experiments to evaluate the background signal of the assay. Negligible responses were observed from all microsphere types and no statistically significant variations were observed among the three experiments. The cross-reactivities between all of the antibodies and proteins were also tested by incubating one chip with each of six protein standards. Signals from all non-complementary proteins and blank tests were negligible (less than 3% fluorescence response increase, see Fig. S6 in ESI†). This observation agrees with our previous results from the fiber-optic bundle platform.34
Multiplexed calibration curves were constructed by testing a series of protein standards in PBSS buffer (details in Table S3 in ESI†). Six different concentrations of each protein, prepared by serial dilution of 2.5 X, were tested, and three independent measurements were performed at each concentration. The average signal responses were fit using the 4–PL model and R2 values above 0.99 were achieved for all six proteins (shown in Fig. 5). The limit of detection (LOD) was calculated as the protein concentration that results in the average signal of the blank plus three times the standard deviation. The LODs ranged from 4 to 30 pg mL−1 for VEGF, IP-10, EGF, and IL-8. The LOD was 8624 pg mL−1 for MMP-9, and 138 pg mL−1 for IL-1β (Table 2). Most of these LODs are comparable with those of our previous platform (listed in the last column in Table 2 as a reference). The results of the SDReader are reported in 70 min, much faster than our previous platform, which required more than 210 min.
Fig. 5.

Six-plex protein concentration calibration curves for the SDReader. The calibration curves were constructed by testing a series of protein standard mixtures in PBSS buffer at different concentrations with a serial dilution of 2.5. Three independent measurements were done at each concentration and the average responses were fit using the 4–PL model.
Table 2.
Six-plex protein concentration calibration characteristics of the SDReader.
| Analyte | Molecular Weight (kDa) | LOD (pg mL−1) | LOD (pM) | R2 | LOD-fiber* (pg mL−1) |
|---|---|---|---|---|---|
| VEGF | 19.2 | 14 | 0.7 | 0.9980 | 6 |
| IP-10 | 8.7 | 30 | 3.5 | 0.9997 | 26 |
| IL-8 | 8.0 | 6 | 0.8 | 0.9982 | 4 |
| EGF | 6.0 | 4 | 0.7 | 0.9998 | 3 |
| MMP-9 | 77 | 8624 | 112 | 0.9961 | 1311 |
| IL-1β | 17 | 138 | 8.1 | 0.9970 | 5 |
Results from our previous work on the fiber-optic bundle platform.34
Onsite saliva testing
The SDReader has been deployed in two clinics for onsite saliva analysis: the Boston Medical Center and Boston Children’s Hospital. Saliva samples representing various clinical conditions were collected and tested, including samples from patients with mouth bleeding, which resulted in blood in the sample; samples from patients who had just ingested Gatorade, which resulted in an orange, pink, or purple color in the saliva sample; and others. All samples were successfully analyzed, demonstrating the possibility of deploying the SDReader in the clinic to analyze samples that may contain various impurities and potential interferences. While our current protocol requires sample preparation using a bench top centrifuge, comparable results should be achievable with a hand-powered device for centrifugation such as an egg-beater.46 This approach would enable us to produce an integrated POC diagnostic platform.
A total of 273 saliva samples were collected and tested, including 117 saliva samples collected from patients with CF, 106 samples from asthmatic patients, and 50 from healthy control individuals. The boxplots of the concentrations of all six proteins in each group are shown in Fig. 6. Different levels of these proteins were observed in patients with different respiratory diseases as compared to healthy controls, suggesting this platform can be used for CF and asthma research. Furthermore, for some proteins, such as IP-10, the levels in the different groups were distinct, which suggests that IP-10 may be a highly specific biomarker for CF and asthma analysis and monitoring.
Fig. 6.

Boxplot of the salivary protein levels in different groups. All concentrations are shown in pg mL−1, except for MMP-9 where ng mL−1 is used.
Conclusions
In this paper, we described the first automated integrated platform capable of multiplexed protein profiling of human saliva samples. In summary, our platform offers the following advantages:
Multiple potential protein biomarkers for inflammatory respiratory diseases have been simultaneously analyzed by the device using disposable microfluidic chips. The rapid and sensitive profiling of multiple salivary protein biomarkers will be a useful tool for respiratory disease research and diagnosis. Based on the non-invasive collection of human saliva specimens, this platform could also be utilized in POC diagnostics and patient self-tests. Furthermore, this platform could be applicable to other protein biomarkers in saliva and to other bio-fluid specimens, such as serum and urine.
Supplementary Material
Table 3.
The advantages of the SDReader platform
| No | Advantages | Details |
|---|---|---|
| 1 | Noninvasive detection | Saliva samples can be collected noninvasively |
| 2 | Easy sample processing | Detection requires minimal sample processing |
| 3 | Automated detection | Full assay performed at the press of a button |
| 4 | Speed | Results obtained in 70 min |
| 5 | Low sample requirement | As little as 10 μL saliva is needed |
| 6 | Multiplexing ability | Up to 10 proteins can be analyzed simultaneously |
| 7 | High sensitivity | LODs in the low picomolar range |
| 8 | Low cost | Each multiplexed test costs less than $10 |
| 9 | High portability | Device weighs 2.7 kg |
| 10 | Tolerance to impurities | Can analyze samples for different clinical conditions |
Acknowledgments
This work was supported by the National Institutes of Health (grant 08UDE017788-05). Fabrication of Si molds was developed with funding from the University Cancer Research Fund (UCRF) Core Facility Pilot Project Award in collaboration with the Chapel Hill Analytical and Nanofabrication Laboratory (CHANL).
Footnotes
Associated content
Electronic Supplementary Information (ESI) available: details of microfluidic chip sruface passivation, microfluidic chip loading device, calibration curve fitting, detailed saliva analysis process, microwell geometries, SDReader valve test, and protein cross-reactivity tests. See DOI: 10.1039/b000000x/
References
- 1.Tabak LA. J Dent Educ. 2001;65:1335–1339. [PubMed] [Google Scholar]
- 2.Chiappin S, Antonelli G, Gatti R, De Palo EF. Clin Chim Acta. 2007;383:30–40. doi: 10.1016/j.cca.2007.04.011. [DOI] [PubMed] [Google Scholar]
- 3.Lee YH, Wong DT. Am J Dent. 2009;22:241–248. [PMC free article] [PubMed] [Google Scholar]
- 4.Malamud D. Dent Clin North Am. 2011;55:159–178. doi: 10.1016/j.cden.2010.08.004. [DOI] [PMC free article] [PubMed] [Google Scholar]
- 5.Spielmann N, Wong DT. Oral Dis. 2011;17:345–354. doi: 10.1111/j.1601-0825.2010.01773.x. [DOI] [PMC free article] [PubMed] [Google Scholar]
- 6.Liu JY, Duan YX. Oral Oncol. 2012;48:569–577. doi: 10.1016/j.oraloncology.2012.01.021. [DOI] [PubMed] [Google Scholar]
- 7.Streckfus CF, Bigler LR. Oral Dis. 2002;8:69–76. doi: 10.1034/j.1601-0825.2002.1o834.x. [DOI] [PubMed] [Google Scholar]
- 8.Mullen JBM, Wright JL, Wiggs BR, Pare PD, Hogg JC. Br Med J. 1985;291:1235–1239. doi: 10.1136/bmj.291.6504.1235. [DOI] [PMC free article] [PubMed] [Google Scholar]
- 9.Djukanovic R, Roche WR, Wilson JW, Beasley CRW, Twentyman OP, Howarth PH, Holgate ST. Am Rev Respir Dis. 1990;142:434–457. doi: 10.1164/ajrccm/142.2.434. [DOI] [PubMed] [Google Scholar]
- 10.Collins FS. Science. 1992;256:774–779. doi: 10.1126/science.1375392. [DOI] [PubMed] [Google Scholar]
- 11.Beasley R, Keil U, von Mutius E, Pearce N, Ait-Khaled N, Anabwani G, Anderson HR, Asher MI, Bjorkstein B, Burr ML, Clayton TO, Crane J, Ellwood P, Lai CKW, Mallol J, Martinez FD, Mitchell EA, Montefort S, Robertson CF, Shah JR, Sibbald B, Stewart AW, Strachan DP, Weiland SK, Williams HC C. Int Study Asthma Allergies. Lancet. 1998;351:1225–1232. [Google Scholar]
- 12.Ratjen F, Doring G. Lancet. 2003;361:681–689. doi: 10.1016/S0140-6736(03)12567-6. [DOI] [PubMed] [Google Scholar]
- 13.Ober C, Yao TC. Immunol Rev. 2011;242:10–30. doi: 10.1111/j.1600-065X.2011.01029.x. [DOI] [PMC free article] [PubMed] [Google Scholar]
- 14.Cohen-Cymberknoh M, Shoseyov D, Kerem E. Am J Respir Crit Care Med. 2011;183:1463–1471. doi: 10.1164/rccm.201009-1478CI. [DOI] [PubMed] [Google Scholar]
- 15.WHO. [Accessed July 1, 2013.];Global surveillance, prevention and control of chronic respiratory diseases: a comprehensive approach. http://www.who.int/gard/publications/GARD_Manual/en/index.html.
- 16.Cystic fibrosis foundation. [Accessed July 1, 2013.]; www.cff.org.
- 17.Mangos JA, McSherry NR, Benke PJ. Pediatr Res. 1967;1:436. doi: 10.1203/00006450-196711000-00002. [DOI] [PubMed] [Google Scholar]
- 18.Ryberg M, Moller C, Ericson T. J Dent Res. 1987;66:1404–1406. doi: 10.1177/00220345870660082401. [DOI] [PubMed] [Google Scholar]
- 19.Schmekel B, Ahlner J, Malmstrom M, Venge P. Respir Med. 2001;95:670–675. doi: 10.1053/rmed.2001.1123. [DOI] [PubMed] [Google Scholar]
- 20.Mascini M, Tombelli S. Biomarkers. 2008;13:637–657. doi: 10.1080/13547500802645905. [DOI] [PubMed] [Google Scholar]
- 21.Weigl B, Domingo G, LaBarre P, Gerlach J. Lab Chip. 2008;8:1999–2014. doi: 10.1039/b811314a. [DOI] [PMC free article] [PubMed] [Google Scholar]
- 22.Hart RW, Mauk MG, Liu C, Qiu X, Thompson JA, Chen D, Malamud D, Abrams WR, Bau HH. Oral Dis. 2011;17:745–752. doi: 10.1111/j.1601-0825.2011.01808.x. [DOI] [PMC free article] [PubMed] [Google Scholar]
- 23.Lee-Lewandrowski E, Lewandrowski K. Clin Lab Med. 2009;29:479. doi: 10.1016/j.cll.2009.07.001. [DOI] [PubMed] [Google Scholar]
- 24.Hartmann M, Schrenk M, Dottinger A, Nagel S, Roeraade J, Joos TO, Templin MF. Clin Chem. 2008;54:956–963. doi: 10.1373/clinchem.2007.099812. [DOI] [PubMed] [Google Scholar]
- 25.Hartwell SK, Grudpan K. Microchim Acta. 2010;169:201–220. [Google Scholar]
- 26.Sia SK, Whitesides GM. Electrophoresis. 2003;24:3563–3576. doi: 10.1002/elps.200305584. [DOI] [PubMed] [Google Scholar]
- 27.Spisak S, Guttman A. Curr Med Chem. 2009;16:2806–2815. doi: 10.2174/092986709788803141. [DOI] [PubMed] [Google Scholar]
- 28.Derveaux S, Stubbe BG, Braeckmans K, Roelant C, Sato K, Demeester J, De Smedt SC. Anal Bioanal Chem. 2008;391:2453–2467. doi: 10.1007/s00216-008-2062-4. [DOI] [PMC free article] [PubMed] [Google Scholar]
- 29.Barbee KD, Hsiao AP, Roller EE, Huang XH. Lab Chip. 2010;10:3084–3093. doi: 10.1039/c0lc00044b. [DOI] [PMC free article] [PubMed] [Google Scholar]
- 30.Derveaux S, Stubbe BG, Roelant C, Leblans M, De Geest BG, Demeester J, De Smedt SC. Anal Chem. 2008;80:85–94. doi: 10.1021/ac071212i. [DOI] [PubMed] [Google Scholar]
- 31.Thompson JA, Du XG, Grogan JM, Schrlau MG, Bau HH. J Micromech Microeng. 2010:20. [Google Scholar]
- 32.Rissin DM, Walt DR. Anal Chim Acta. 2006;564:34–39. doi: 10.1016/j.aca.2005.10.012. [DOI] [PubMed] [Google Scholar]
- 33.Thompson JA, Bau HH. J Chromatogr B. 2010;878:228–236. doi: 10.1016/j.jchromb.2009.08.050. [DOI] [PMC free article] [PubMed] [Google Scholar]
- 34.Nie S, Benito-Peña E, Zhang H, Wu Y, Walt DR. Anal Chem. 2013;85:9272–9280. doi: 10.1021/ac4019523. [DOI] [PMC free article] [PubMed] [Google Scholar]
- 35.R&D sytems. [Accessed July 1, 2013.]; http://www.rndsystems.com/Products/MAB002.
- 36.Henley WH, Dennis PJ, Ramsey JM. Anal Chem. 2012;84:1776–1780. doi: 10.1021/ac202445g. [DOI] [PubMed] [Google Scholar]
- 37.Weisberg HF. Central Tendency and Variability. SAGE Publications; 1991. [Google Scholar]
- 38.Blicharz TM, Siqueira WL, Helmerhorst EJ, Oppenheim FG, Wexler PJ, Little FF, Walt DR. Anal Chem. 2009;81:2106–2114. doi: 10.1021/ac802181j. [DOI] [PMC free article] [PubMed] [Google Scholar]
- 39.Belanger MC, Marois Y. J Biomed Mater Res. 2001;58:467–477. doi: 10.1002/jbm.1043. [DOI] [PubMed] [Google Scholar]
- 40.Brunner C, Ernst KH, Hess H, Vogel V. Nanotechnology. 2004;15:S540–S548. [Google Scholar]
- 41.Park JH, Bae YH. Biomaterials. 2002;23:1797–1808. doi: 10.1016/s0142-9612(01)00306-4. [DOI] [PubMed] [Google Scholar]
- 42.Peterson SL, McDonald A, Gourley PL, Sasaki DY. J Biomed Mater Res A. 2005;72A:10–18. doi: 10.1002/jbm.a.30166. [DOI] [PubMed] [Google Scholar]
- 43.Seguin C, McLachlan JM, Norton PR, Lagugne-Labarthet F. Appl Surf Sci. 2010;256:2524–2531. [Google Scholar]
- 44.Sung WC, Chang CC, Makamba H, Chen SH. Anal Chem. 2008;80:1529–1535. doi: 10.1021/ac7020618. [DOI] [PubMed] [Google Scholar]
- 45.Humphrey SP, Williamson RT. J Prosthet Dent. 2001;85:162–169. doi: 10.1067/mpr.2001.113778. [DOI] [PubMed] [Google Scholar]
- 46.Wong AP, Gupta M, Shevkoplyas SS, Whitesides GM. Lab Chip. 2008;8:2032–2037. doi: 10.1039/b809830c. [DOI] [PubMed] [Google Scholar]
Associated Data
This section collects any data citations, data availability statements, or supplementary materials included in this article.