

Abstract
J-proteins are molecular chaperones and present in a wide variety of organisms from prokaryote to eukaryote. Based on their domain organizations, J-proteins can be classified into 4 types, that is, Type I, Type II, Type III, and Type IV. Different types of J-proteins play distinct roles in influencing cancer properties and cell death. Thus, reliably annotating the types of J-proteins is essential to better understand their molecular functions. In the present work, a support vector machine based method was developed to identify the types of J-proteins using the tripeptide composition of reduced amino acid alphabet. In the jackknife cross-validation, the maximum overall accuracy of 94% was achieved on a stringent benchmark dataset. We also analyzed the amino acid compositions by using analysis of variance and found the distinct distributions of amino acids in each family of the J-proteins. To enhance the value of the practical applications of the proposed model, an online web server was developed and can be freely accessed.
1. Introduction
J-protein, also known as Hsp40 (heat shock protein 40 kD), is a molecular chaperone protein and is found ubiquitously in both prokaryotes and eukaryotes [1, 2]. J-proteins represent a large family of molecular chaperones and have cooperative functions with Hsp70. Most of the J-proteins contain a “J” domain through which they can interact with and stimulate Hsp70. Based on the structural differences, J-proteins can be classified into four types, that is, Type I, Type II, Type III, and Type IV J-proteins. Type I J-proteins contain an N-terminal J-domain that is separated from the rest of the proteins by a linker “G/F” region (glycine/phenylalanine region) [3, 4]. Distal to G/F region is the zinc-binding cysteine-rich sequence named as “Zinc-finger domain” which distinguishes Type I proteins from other types of J-proteins [4], and Zinc-finger domain is followed by the C-terminal domain [1, 2]. Type II proteins possess all the domains in Type I except the zinc-finger domain [3]. Type III J-proteins contain a C-terminal J-domain but lack both G/F and zinc-finger domains [3]. Type IV, also known as the J-like protein [5], is a group of recently identified proteins that lacks histidine, proline, and aspartate signature motifs in their sequences [4].
By binding Hsp70 and Hsp90, J-proteins play important roles in chaperone cycle regulation and control many physiological functions [4], such as assisting the folding of nascent and damaged proteins, translocation of polypeptides across cellular membranes, and degradation of misfolded proteins [6]. Studies carried out in the past decade have also shown the regulatory roles of J-proteins in cell death. In association with Hsp70, J-proteins not only involve in the folding of caspase-activated DNase which is responsible for the apoptosis-induced DNA fragmentation [7] but also protect the macrophages from nitric-oxide-mediated apoptosis [8]. Gotoh and his colleagues have demonstrated the role of J-protein in the inhibition of Bax translocation to the mitochondria to prevent nitric-oxide-induced cell apoptosis [9]. Kurisu et al. found that MDG1/ERdj4, a member of the human J-protein family, can interact with GRP78/BiP and protect against the cell death induced by endoplasmic reticulum stress in human [10]. The regulation of cell death by J-protein was also reported in plant. Liu and Whitham found that the overexpression of J-protein stimulated the hypersensitive response (HR)-like cell death in soybean [11]. Cancer progressions are also reported to be closely related to J-proteins, but different types of J-proteins play distinct roles [12, 13]. Type I J-protein is tumour promoting, while Type II J-protein acts as tumour suppressors [13]. Therefore, reliably annotating the types of J-proteins is of major importance in order to clarify their distinct biological functions in cell death. However, to the best of our knowledge, there is no computational method for predicting the types of J-proteins.
Keeping these in mind, in the present work, we proposed a model to predict the four functional types of J-proteins based on reduced amino acid alphabet compositions. According to a recent review [14], the rest of the papers are organized as follows: (i) construct a valid benchmark dataset to train and test the predictor; (ii) formulate the samples with an effective mathematical expression that can truly reflect their intrinsic correlation with the target to be predicted; (iii) select a powerful machine learning method to operate the prediction; (iv) perform cross-validation tests to objectively evaluate the anticipated accuracy of the predictor; (v) provide a web server for the prediction method.
2. Materials and Methods
2.1. Dataset
The sequences of J-protein were taken from the HSPIR database at http://pdslab.biochem.iisc.ernet.in/hspir/, which currently contains 3,901 J-protein sequences [15]. To reduce homologous bias, J-proteins that have ≥40% pairwise sequence identity to each other were removed by using the CD-HIT program [16]. By doing so, we obtained a benchmark dataset containing 1,245 J-proteins that were classified into four types: 63 Type I J-proteins, 53 Type II J-proteins, 1,107 Type III J-proteins, and 22 Type IV J-proteins (Table 1). The benchmark dataset can be freely downloaded from http://lin.uestc.edu.cn/server/iJPred/data.
Table 1.
Breakdown of the benchmark dataset used in current study.
| Total number | Subfamily | Number |
|---|---|---|
| 1245 | Type I J-protein | 63 |
| Type II J-protein | 53 | |
| Type III J-protein | 1107 | |
| Type IV J-protein | 22 |
2.2. Reduced Amino Acid Alphabet
Based on the physiochemical properties, the 20 native amino acids can be clustered into a smaller number of representative residues called reduced amino acid alphabet (RAAA) [17–19]. Compared with the traditional amino acid composition, RAAA not only simplifies the complexity of protein system but also improves the ability in finding structurally conserved regions and structural similarity of entire proteins.
Recently, a structural alphabet called protein blocks (PBs) was proposed by de Brevern et al. [20, 21] and has been widely used in computational proteomics as indicated in a review [22]. To aid the design of mutations, Etchebest and his colleagues defined a novel type of RAAA based on PBs [23], where the 20 native amino acids can form five different cluster profiles, that is, CP(13), CP(11), CP(9), CP(8), and CP(5) as shown in Table 2. Ever since it was proposed, RAAA has been widely used for protein family classifications [24–27].
Table 2.
Scheme for reduced amino acid alphabet based on protein blocks method.
| Cluster profiles | Protein blocks method |
|---|---|
| CP(13) | G-IV-FYW-A-L-M-E-QRK-P-ND-HS-T-C |
| CP(11) | G-IV-FYW-A-LM-EQRK-P-ND-HS-T-C |
| CP(9) | G-IV-FYW-ALM-EQRK-P-ND-HS-TC |
| CP(8) | G-IV-FYW-ALM-EQRK-P-ND-HSTC |
| CP(5) | G-IVFYW-ALMEQRK-P-NDHSTC |
Hence, in the present study, the J-proteins were encoded using the RAAA as formulated by the discrete feature vector P:
| (1) |
where T is the transposing operator and f i is the occurrence frequency of the ith n-peptide RAAA and defined as
| (2) |
where N i is the number of the ithn-peptide (n = 1, 2, or 3) RAAA in a J-protein with length of L. For the different cluster profiles (Table 2) and different values of n, the vector dimension (D) in (1) will be different. The corresponding dimensions of reduced amino acid (n = 1) composition, reduced dipeptide (n = 2) composition, and reduced tripeptide (n = 3) composition were listed in Table 3.
Table 3.
Feature vector dimension of n-peptide composition with different cluster profiles.
| n-peptide | Cluster profiles | ||||
|---|---|---|---|---|---|
| CP(13) | CP(11) | CP(9) | CP(8) | CP(5) | |
| n = 1 | 13 | 11 | 9 | 8 | 5 |
| n = 2 | 169 | 121 | 81 | 64 | 25 |
| n = 3 | 2197 | 1331 | 729 | 512 | 125 |
2.3. Support Vector Machine (SVM)
SVM is a powerful and popular method for pattern recognition that has been widely used in the realm of bioinformatics [28–41]. The basic idea of SVM is to transform the data into a high dimensional feature space and then determine the optimal separating hyperplane using a kernel function. To handle a multiclass problem, “one-versus-one (OVO)” and “one-versus-rest (OVR)” methods are generally applied to extend the traditional SVM. For a brief formulation of SVM and how it works, see the papers [28, 29].
In the current study, the LIBSVM 2.84 package [42] was used as an implementation of SVM, which can be downloaded from http://www.csie.ntu.edu.tw/~cjlin/libsvm/. The OVO method was employed for making predictions using the popular radial basis function (RBF). The regularization parameter C and the kernel width parameter γ were determined via an optimization procedure using a grid search approach using the fivefold cross-validation. In grid research, the search spaces for parameter C and γ range from 215 to 2−5 and from 2−5 to 2−15 with the steps of 2−1 and 2, respectively.
2.4. Performance Evaluation
The performance of the method was measured in terms of sensitivity (Sn), specificity (Sp), Matthew's correlation coefficient (MCC), and overall accuracy (OA) defined as follows:
| (3) |
where TP(i), TN(i), FP(i), and FN(i) represent true positive, true negative, false positive, and false negative of family i; M is the number of subsets and equals to 4, while N is the number of the total J-proteins in benchmark dataset.
3. Results and Discussion
3.1. Cross-Validation
Three cross-validation methods, namely, subsampling (or K-fold cross-validation) test, independent dataset test, and jackknife test, are often used to evaluate the quality of a predictor [43]. Among the three methods, the jackknife test is deemed the least arbitrary and most objective as elucidated in [44] and hence has been widely recognized and increasingly adopted by investigators to examine the quality of various predictors [31, 34, 45–50]. Accordingly, the jackknife test was used to examine the performance of the model proposed in the current study. In the jackknife test, each sequence in the training dataset is in turn singled out as an independent test sample and all the rule parameters are calculated without including the one being identified.
The jackknife results obtained by the proposed model on the benchmark dataset based on the five different cluster profiles of the tripeptide (i.e., n = 3) case were listed in Table 4. As it can be seen from Table 4, the best success rate of 94.06% was achieved when the predictions were based on CP(8) with a dimension of 512. For comparison, the results of the amino acid (i.e., n = 1) and dipeptide (i.e., n = 2) cases were also calculated and listed in Table 5, from which we can see that none of them has higher success rates than the case of n = 3.
Table 4.
Results obtained in identifying J-protein functional types with tripeptide case (n = 3).
| Subfamily | Metrics | Feature dimension of n = 3 for each cluster profile | ||||
|---|---|---|---|---|---|---|
| CP(13) | CP(11) | CP(9) | CP(8) | CP(5) | ||
| 2197 | 1331 | 729 | 512 | 125 | ||
| Type I J-protein | Sn | 63.49% | 74.60% | 77.78% | 74.60% | 60.31% |
| Sp | 99.56% | 98.94% | 99.11% | 98.76% | 98.93% | |
| MCC | 0.74 | 0.76 | 0.79 | 0.75 | 0.66 | |
| Type II J-protein | Sn | 37.73% | 45.28% | 39.62% | 49.06% | 24.53% |
| Sp | 100% | 99.31% | 99.39% | 99.05% | 99.56% | |
| MCC | 0.60 | 0.57 | 0.53 | 0.57 | 0.41 | |
| Type III J-protein | Sn | 99.81% | 98.82% | 99.09% | 98.56% | 99.19% |
| Sp | 44.44% | 58.78% | 55.72% | 62.02% | 40.00% | |
| MCC | 0.63 | 0.68 | 0.67 | 0.69 | 0.56 | |
| Type IV J-protein | Sn | 0 | 27.27% | 13.64% | 31.81% | 4.54% |
| Sp | 100.00% | 100.00% | 100.00% | 100.00% | 100.00% | |
| MCC | 0 | 0.52 | 0.37 | 0.56 | 0.21 | |
|
| ||||||
| OA | 93.57% | 94.06% | 93.98% | 94.06% | 92.36% | |
Table 5.
Results obtained in identifying functional types with (a) single amino acid case (n = 1) and (b) dipeptide case (n = 2).
(a) For the single amino acid case (n = 1)
| Subfamily | Metrics | Feature dimension of n = 1 for each cluster profile | |||||
|---|---|---|---|---|---|---|---|
| CP(20) | CP(13) | CP(11) | CP(9) | CP(8) | CP(5) | ||
| 20 | 13 | 11 | 9 | 8 | 5 | ||
| Type I J-protein | Sn | 71.42% | 65.08% | 68.25% | 52.38% | 50.79% | 22.22% |
| Sp | 98.58% | 98.66% | 98.66% | 98.93% | 98.48% | 98.03% | |
| MCC | 0.71 | 0.67 | 0.69 | 0.60 | 0.56 | 0.26 | |
| Type II J-protein | Sn | 33.96% | 30.19% | 33.96% | 16.98% | 16.98% | 15.09% |
| Sp | 99.82% | 99.21% | 99.12% | 99.47% | 99.56% | 99.09% | |
| MCC | 0.54 | 0.42 | 0.45 | 0.30 | 0.31 | 0.23 | |
| Type III J-protein | Sn | 98.74% | 98.28% | 98.10% | 99.09% | 98.73% | 98.19% |
| Sp | 48.12% | 42.86% | 45.52% | 32.31% | 31.54% | 17.46% | |
| MCC | 59.71% | 0.53 | 0.54 | 0.48 | 0.45 | 0.26 | |
| Type IV J-protein | Sn | 4.54% | 0 | 0 | 0 | 0 | 0 |
| Sp | 99.91% | 100.00% | 100.00% | 100.00% | 100.00% | 100.00% | |
| MCC | 0.15 | 0.53 | 0 | 0 | 0 | 0 | |
|
| |||||||
| OA | 92.93% | 91.97% | 92.13% | 91.48% | 91.08% | 89.08% | |
(b) For the dipeptide case (n = 2)
| Subfamily | Metrics | Feature dimension of n = 2 for each cluster profile | |||||
|---|---|---|---|---|---|---|---|
| CP(20) | CP(13) | CP(11) | CP(9) | CP(8) | CP(5) | ||
| 400 | 169 | 121 | 81 | 64 | 25 | ||
| Type I J-protein | Sn | 74.42% | 60.31% | 73.02% | 60.32% | 58.73% | 49.20% |
| Sp | 97.58% | 98.59% | 98.76% | 97.71% | 98.32% | 97.79% | |
| MCC | 0.75 | 0.63 | 0.73 | 0.58 | 0.60 | 0.5 | |
| Type II J-protein | Sn | 39.76% | 45.23% | 39.62% | 39.62% | 35.84% | 28.30% |
| Sp | 94.31% | 99.29% | 99.48% | 99.03% | 98.60% | 97.99% | |
| MCC | 0.57 | 0.57 | 0.54 | 0.49 | 0.42 | 0.31 | |
| Type III J-protein | Sn | 98.88% | 98.10% | 98.82% | 97.74% | 98.01% | 97.31% |
| Sp | 46.37% | 50.74% | 51.14% | 50.79% | 48.80% | 40.34% | |
| MCC | 60.08% | 0.59 | 0.62 | 0.57 | 0.56 | 0.46 | |
| Type IV J-protein | Sn | 13.16% | 27.27% | 0 | 22.73% | 25.00% | 9.09% |
| Sp | 99.91% | 99.91% | 100.00% | 100.00% | 100.00% | 99.91% | |
| MCC | 0.13 | 0.48 | 0 | 0.47 | 0.47 | 0.24 | |
|
| |||||||
| OA | 91.47% | 92.93% | 93.25% | 91.97% | 92.04% | 91.16% | |
In our previous study [27], the six HSP families were successfully classified by using the dipeptide of RAAA. But for the classification of the J-protein subfamilies in the present work, the best predictive result was obtained by using the tripeptide of RAAA. Hsps belong to the same family share more sequence identity than that of different families [5]; hence we need more suitable parameters to encode the protein sequences as used in the current study.
3.2. Comparison with Other Methods
Since there is no published work to predict the types of J-proteins, we could not provide the comparison analysis with existing results to confirm that our presented model is superior to other methods. However, for the purpose of comparison, we compared the results of the present model with that of Random Forest and Naïve Bayes using the same optimal features (the reduced tripeptide compositions based on CP(8)). The results of jackknife test on the benchmark dataset for Random Forest and Naïve Bayes are listed in Table 6. It is shown that the accuracy of SVM is higher than that of Random Forest and Naïve Bayes.
Table 6.
Comparative result of SVM with other methods for J-protein types classification.
| Subfamily | SVM | Random Forest | Naïve Bayes | ||||||
|---|---|---|---|---|---|---|---|---|---|
| Sn | SP | MCC | Sn | SP | MCC | Sn | SP | MCC | |
| Type I J-protein | 74.60% | 98.76% | 0.75 | 14.29% | 99.55% | 0.29 | 74.60% | 92.17% | 0.47 |
| Type II J-protein | 49.06% | 99.05% | 0.57 | 13.33% | 99.82% | 0.31 | 54.72% | 94.67% | 0.39 |
| Type III J-protein | 98.56% | 62.02% | 0.69 | 99.73% | 12.70% | 0.31 | 88.62% | 65.83% | 0.43 |
| Type IV J-protein | 31.81% | 100.00% | 0.56 | 4.55% | 100.00% | 0.21 | 13.64% | 100.00% | 0.37 |
|
| |||||||||
| OA | 94.06% | 89.96% | 85.14% | ||||||
3.3. Amino Acids Composition Analysis
To provide an overall view, the frequencies of the 20 naive amino acids were compared among the four types of J-proteins using the analysis of variance (ANOVA), and the average amino acid frequency of one type of J-protein with that of another type was further explored and compared using the Fisher's least significant difference (LSD) test. The result is given in Figure 1, where the green boxes indicate that the frequency differences among different types of J-proteins are not significant, while blue and red boxes indicate that the frequency differences are significant (P < 0.05; LSD test) among different types of J-proteins (see Figure 1 for more details).
Figure 1.
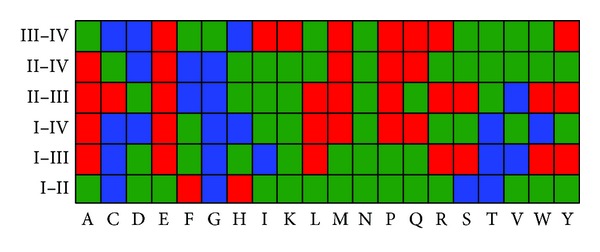
Statistical results to show the divergent distributions of the 20 amino acids among the four (I, II, III, and IV) types of J-proteins. The green boxes indicate that the frequency differences among different types of J-proteins are not significant. The blue boxes indicate that the amino acid is significantly enriched (P < 0.05; LSD test) in one type of J-proteins compared with its counterpart. Taking W as an example, the blue box with the coordinate (W, I–IV) indicates that W is enriched in Type I J-proteins compared with Type IV J-proteins. The red boxes indicate that the amino acid is lacking in one type of J-proteins but significantly enriched (P < 0.05; LSD-test) in its counterpart. Also taking W as the example, the two red boxes with the coordinates (W, I–III) and (W, II-III) indicate that W is lacking in both Type I and Type II J-proteins compared with Type III J-proteins, respectively.
We found that, except Asn (N), the frequencies of all the other 19 amino acids are significantly different among the four types of J-proteins. Compared with other three types, Type I J-proteins are enriched in Cys (C), Gly (G), and Thr (T), Type II J-proteins are enriched in Phe (F), Type III J-proteins are enriched in Ala (A) and Leu (L), while Type IV-J proteins are enriched in Met (M), Gln (Q), Glu (E), and Pro (P) but lack Asp (D) and His (H). The lack of D and H residues in Type IV-J proteins leads to their inability to stimulate ATP hydrolysis [5]. Moreover, according to the binomial distribution [51], we also found the overpresented tripeptides in each family and listed them in Supporting Table S1 in Supplementary Material available online at http://dx.doi.org/10.1155/2014/935719, where the over-presented tripeptides with their confidence levels are provided. These results indicate that the distinct distributions of amino acids in the four types of J-proteins may account for their distinct functions in biological processes.
3.4. Web Server Guide
To enhance the value of the practical applications of the proposed model and for the convenience of the vast majority of experimental scientists, an online predictor was developed. The step-by-step guide on how to use it is provided as follows.
Open the web server at http://lin.uestc.edu.cn/server/Jpred and you will see the top page as shown in Figure 2. Click on the Read Me button to see a brief introduction about the predictor and the caveat when using it, and click on the Data button to download the benchmark datasets used to train and test the predictor. The relevant papers that document the algorithm of the predictor can be found by clicking on the Citation button.
Either type or copy/paste the query J-protein sequence into the input box at the center of Figure 2. The input protein sequence should be in the FASTA format that can be seen by clicking on the Example button right above the input box.
Click on the Submit button to see the predicted result. For example, if you use the four query J-protein sequences in the Example window as the input, after clicking the Submit button, you will obtain the results: the outcome for the 1st query sample is “Type I J-protein;” the outcome for the 2nd query sample is “Type II J-protein;” the outcome for the 3rd query sample is “Type III J-protein;” the outcome for the 4th query sample is “Type IV J-protein.”
Figure 2.
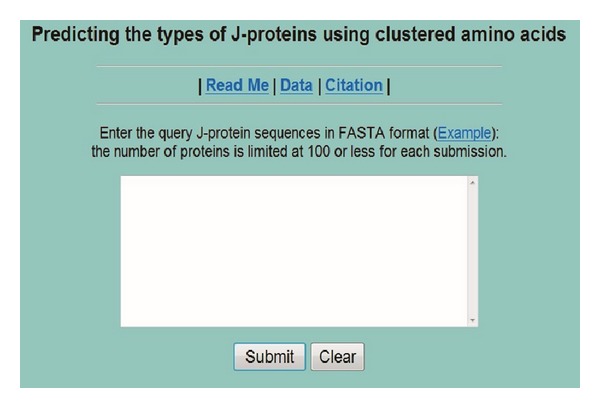
A semiscreenshot to show the top page of the web server. It is available at http://lin.uestc.edu.cn/server/Jpred.
4. Conclusion
Cell death is a common phenomenon in developmental processes or in normal physiological conditions and is induced by an array of extra- or intracellular stimuli [7]. However, organisms are equipped with their own physiological defense to cope with environmental stress in order to prevent or induce cell death depending upon the severity of the stress [7]. In mammalian cells, the stress response involves the induction of Hsps, such as Hsp70 and Hsp90. By interacting with J-proteins, these Hsps play pivotal roles in cell death regulations. Since J-proteins act as intermediates, the analysis of J-proteins functions is urgent in order to clarify the regulatory roles of Hsps in cell death.
Based on combination of whole-genome analyses and biochemical evidences, a large number of J-proteins have been identified [6]. However, the exact roles for many of the J-proteins are far from being understood [2, 52]. In order to understand its biological functions, it is highly desirable to know which family a given J-protein belongs to.
By encoding the sequences using the reduced amino acid alphabet information, a predictor was developed to identify the four different families of J-proteins in the present work. To enhance the value of the practical applications of the proposed model and for the convenience of the experimental scientists, an online web server was provided and can be freely accessed at http://lin.uestc.edu.cn/server/Jpred. We hope that the present model will be helpful for scientists who focus on J-proteins and will provide novel insights into the research of cell death.
Supplementary Material
According to the binomial distribution, we analyzed the distribution of the tripeptides and found the over-presented tripeptides in each J-protein families. Listed in Supporting Table S1 are the over-presented tripeptides with confidence level (=1-p) greater than 99.9%.
Acknowledgments
The authors wish to express their gratitude to executive editor and three anonymous reviewers whose constructive comments were very helpful in strengthening the presentation of this paper. This work was supported by the National Nature Scientific Foundation of China (nos. 61100092 and 61202256), Nature Scientific Foundation of Hebei Province (no. C2013209105), Foundation of Science and Technology Department of Hebei Province (no. 132777133), and the Fundamental Research Funds for the Central Universities (ZYGX2013J102).
Conflict of Interests
There is no conflict of interests with any financial organization regarding this paper.
References
- 1.Caplan AJ, Cyr DM, Douglas MG. Eukaryotic homologues of Escherichia coli dnaJ: a diverse protein family that functions with HSP70 stress proteins. Molecular and Cellular Biology. 1993;4(6):555–563. doi: 10.1091/mbc.4.6.555. [DOI] [PMC free article] [PubMed] [Google Scholar]
- 2.Qiu XB, Shao YM, Miao S, Wang L. The diversity of the DnaJ/Hsp40 family, the crucial partners for Hsp70 chaperones. Cellular and Molecular Life Sciences. 2006;63(22):2560–2570. doi: 10.1007/s00018-006-6192-6. [DOI] [PMC free article] [PubMed] [Google Scholar]
- 3.Cheetham ME, Caplan AJ. Structure, function and evolution of DnaJ: conservation and adaptation of chaperone function. Cell Stress Chaperones. 1998;3(1):28–36. doi: 10.1379/1466-1268(1998)003<0028:sfaeod>2.3.co;2. [DOI] [PMC free article] [PubMed] [Google Scholar]
- 4.Rajan VB, D’Silva P. Arabidopsis thaliana J-class heat shock proteins: cellular stress sensors. Functional & Integrative Genomics. 2009;9(4):433–446. doi: 10.1007/s10142-009-0132-0. [DOI] [PubMed] [Google Scholar]
- 5.Walsh P, Bursać D, Law YC, Cyr D, Lithgow T. The J-protein family: modulating protein assembly, disassembly and translocation. EMBO Reports. 2004;5(6):567–571. doi: 10.1038/sj.embor.7400172. [DOI] [PMC free article] [PubMed] [Google Scholar]
- 6.Craig EA, Huang P, Aron R, Andrew A. The diverse roles of J-proteins, the obligate Hsp70 co-chaperone. Reviews of Physiology, Biochemistry and Pharmacology. 2006;156:1–21. doi: 10.1007/s10254-005-0001-0. [DOI] [PubMed] [Google Scholar]
- 7.Sreedhar AS, Csermely P. Heat shock proteins in the regulation of apoptosis: new strategies in tumor therapy—a comprehensive review. Pharmacology & Therapeutics. 2004;101(3):227–257. doi: 10.1016/j.pharmthera.2003.11.004. [DOI] [PubMed] [Google Scholar]
- 8.Gotoh T, Terada K, Mori M. Hsp70-DnaJ chaperone pairs prevent nitric oxide-mediated apoptosis in RAW 264.7 macrophages. Cell Death & Differentiation. 2001;8(4):357–366. doi: 10.1038/sj.cdd.4400829. [DOI] [PubMed] [Google Scholar]
- 9.Gotoh T, Terada K, Oyadomari S, Mori M. hsp70-DnaJ chaperone pair prevents nitric oxide- and CHOP-induced apoptosis by inhibiting translocation of Bax to mitochondria. Cell Death & Differentiation. 2004;11(4):390–402. doi: 10.1038/sj.cdd.4401369. [DOI] [PubMed] [Google Scholar]
- 10.Kurisu J, Honma A, Miyajima H, Kondo S, Okumura M, Imaizumi K. MDG1/ERdj4, an ER-resident DnaJ family member, suppresses cell death induced by ER stress. Genes to Cells. 2003;8(2):189–192. doi: 10.1046/j.1365-2443.2003.00625.x. [DOI] [PubMed] [Google Scholar]
- 11.Liu JZ, Whitham SA. Overexpression of a soybean nuclear localized type-III DnaJ domain -containing HSP40 reveals its roles in cell death and disease resistance. Plant Journal. 2013;74(1):110–121. doi: 10.1111/tpj.12108. [DOI] [PubMed] [Google Scholar]
- 12.Mitra A, Shevde LA, Samant RS. Multi-faceted role of HSP40 in cancer. Clinical & Experimental Metastasis. 2009;26(6):559–567. doi: 10.1007/s10585-009-9255-x. [DOI] [PubMed] [Google Scholar]
- 13.Sterrenberg JN, Blatch GL, Edkins AL. Human DNAJ in cancer and stem cells. Cancer Letters. 2011;312(2):129–142. doi: 10.1016/j.canlet.2011.08.019. [DOI] [PubMed] [Google Scholar]
- 14.Chou K-C. Some remarks on protein attribute prediction and pseudo amino acid composition. Journal of Theoretical Biology. 2011;273(1):236–247. doi: 10.1016/j.jtbi.2010.12.024. [DOI] [PMC free article] [PubMed] [Google Scholar]
- 15.Ratheesh RK, Nagarajan SN, Arunraj PA, et al. HSPIR: a manually annotated heat shock protein information resource. Bioinformatics. 2012;28(21):2853–2855. doi: 10.1093/bioinformatics/bts520. [DOI] [PMC free article] [PubMed] [Google Scholar]
- 16.Li W, Godzik A. Cd-hit: a fast program for clustering and comparing large sets of protein or nucleotide sequences. Bioinformatics. 2006;22(13):1658–1659. doi: 10.1093/bioinformatics/btl158. [DOI] [PubMed] [Google Scholar]
- 17.Thomas PD, Dill KA. An iterative method for extracting energy-like quantities from protein structures. Proceedings of the National Academy of Sciences of the United States of America. 1996;93(21):11628–11633. doi: 10.1073/pnas.93.21.11628. [DOI] [PMC free article] [PubMed] [Google Scholar]
- 18.Mirny LA, Shakhnovich EI. Universally conserved positions in protein folds: reading evolutionary signals about stability, folding kinetics and function. Journal of Molecular Biology. 1999;291(1):177–196. doi: 10.1006/jmbi.1999.2911. [DOI] [PubMed] [Google Scholar]
- 19.Solis AD, Rackovsky S. Optimized representations and maximal information in proteins. Proteins. 2000;38(2):49–164. [PubMed] [Google Scholar]
- 20.de Brevern AG. New assessment of a structural alphabet. In Silico Biology. 2005;5(3):283–289. [PMC free article] [PubMed] [Google Scholar]
- 21.de Brevern AG, Etchebest C, Hazout S. Bayesian probabilistic approach for predicting backbone structures in terms of protein blocks. Proteins. 2000;41(3):271–287. doi: 10.1002/1097-0134(20001115)41:3<271::aid-prot10>3.0.co;2-z. [DOI] [PubMed] [Google Scholar]
- 22.Joseph AP, Agarwal G, Mahajan S, et al. A short survey on protein blocks. Biophysical Reviews. 2010;2(3):137–147. doi: 10.1007/s12551-010-0036-1. [DOI] [PMC free article] [PubMed] [Google Scholar]
- 23.Etchebest C, Benros C, Bornot A, Camproux A-C, de Brevern AG. A reduced amino acid alphabet for understanding and designing protein adaptation to mutation. European Biophysics Journal. 2007;36(8):1059–1069. doi: 10.1007/s00249-007-0188-5. [DOI] [PubMed] [Google Scholar]
- 24.Zuo YC, Li QZ. Using reduced amino acid composition to predict defensin family and subfamily: Integrating similarity measure and structural alphabet. Peptides. 2009;30(10):1788–1793. doi: 10.1016/j.peptides.2009.06.032. [DOI] [PubMed] [Google Scholar]
- 25.Chen W, Feng PM, Lin H. Prediction of ketoacyl synthase family using reduced amino acid alphabets. Journal of Industrial Microbiology and Biotechnology. 2011;39(4):579–584. doi: 10.1007/s10295-011-1047-z. [DOI] [PubMed] [Google Scholar]
- 26.Chen YL, Li QZ, Zhang LQ. Using increment of diversity to predict mitochondrial proteins of malaria parasite: integrating pseudo-amino acid composition and structural alphabet. Amino Acids. 2010;42(4):1309–1316. doi: 10.1007/s00726-010-0825-7. [DOI] [PubMed] [Google Scholar]
- 27.Feng PM, Chen W, Lin H, Chou KC. iHSP-PseRAAAC: identifying the heat shock protein families using pseudo reduced amino acid alphabet composition. Analytical Biochemistry. 2013;442(1):118–125. doi: 10.1016/j.ab.2013.05.024. [DOI] [PubMed] [Google Scholar]
- 28.Chou KC, Cai YD. Using functional domain composition and support vector machines for prediction of protein subcellular location. The Journal of Biological Chemistry. 2002;277(48):45765–45769. doi: 10.1074/jbc.M204161200. [DOI] [PubMed] [Google Scholar]
- 29.Cai YD, Zhou GP, Chou KC. Support vector machines for predicting membrane protein types by using functional domain composition. Biophysical Journal. 2003;84(5):3257–3263. doi: 10.1016/S0006-3495(03)70050-2. [DOI] [PMC free article] [PubMed] [Google Scholar]
- 30.Chen W, Lin H. Prediction of midbody, centrosome and kinetochore proteins based on gene ontology information. Biochemical and Biophysical Research Communications. 2010;401(3):382–384. doi: 10.1016/j.bbrc.2010.09.061. [DOI] [PubMed] [Google Scholar]
- 31.Hayat M, Khan A. MemHyb: predicting membrane protein types by hybridizing SAAC and PSSM. Journal of Theoretical Biology. 2012;292:93–102. doi: 10.1016/j.jtbi.2011.09.026. [DOI] [PubMed] [Google Scholar]
- 32.Lin H, Ding H. Predicting ion channels and their types by the dipeptide mode of pseudo amino acid composition. Journal of Theoretical Biology. 2011;269(1):64–69. doi: 10.1016/j.jtbi.2010.10.019. [DOI] [PubMed] [Google Scholar]
- 33.Xiao X, Wang P, Chou K-C. iNR-physchem: a sequence-based predictor for identifying nuclear receptors and their subfamilies via physical-chemical property matrix. PLoS ONE. 2012;7(2) doi: 10.1371/journal.pone.0030869.e30869 [DOI] [PMC free article] [PubMed] [Google Scholar]
- 34.Chen W, Feng PM, Lin H, Chou KC. iRSpot-PseDNC: identify recombination spots with pseudo dinucleotide composition. Nucleic Acids Research. 2013;41(6):p. e68. doi: 10.1093/nar/gks1450. [DOI] [PMC free article] [PubMed] [Google Scholar]
- 35.Feng PM, Lin H, Chen W. Identification of antioxidants from sequence information using Naive Bayes. Computational and Mathematical Methods in Medicine. 2013;2013:5 pages. doi: 10.1155/2013/567529.567529 [DOI] [PMC free article] [PubMed] [Google Scholar]
- 36.Liu B, Wang X, Zou Q, Dong Q, Chen Q. Protein remote homology detection by combining chou's pseudo amino acid composition and profile-based protein representation. Molecular Informatics. 2013;32(9-10):775–782. doi: 10.1002/minf.201300084. [DOI] [PubMed] [Google Scholar]
- 37.Liu B, Wang X, Chen Q, Dong Q, Lan X. Using amino acid physicochemical distance transformation for fast protein remote homology detection. PLoS ONE. 2012;7(9) doi: 10.1371/journal.pone.0046633.e46633 [DOI] [PMC free article] [PubMed] [Google Scholar]
- 38.Feng PM, Ding H, Chen W, Lin H. Naive Bayes classifier with feature selection to identify phage virion proteins. Computational and Mathematical Methods in Medicine. 2013;2013:6 pages. doi: 10.1155/2013/530696.530696 [DOI] [PMC free article] [PubMed] [Google Scholar]
- 39.Liu B, Wang X, Lin L, Tang B, Dong Q, Wang X. Prediction of protein binding sites in protein structures using hidden Markov support vector machine. BMC Bioinformatics. 2009;10, article 381 doi: 10.1186/1471-2105-10-381. [DOI] [PMC free article] [PubMed] [Google Scholar]
- 40.Liu B, Wang X, Lin L, Dong Q, Wang X. Exploiting three kinds of interface propensities to identify protein binding sites. Computational Biology and Chemistry. 2009;33(4):303–311. doi: 10.1016/j.compbiolchem.2009.07.001. [DOI] [PubMed] [Google Scholar]
- 41.Liu B, Wang X, Lin L, Dong Q, Wang X. A discriminative method for protein remote homology detection and fold recognition combining Top-n-grams and latent semantic analysis. BMC Bioinformatics. 2008;9, article 510 doi: 10.1186/1471-2105-9-510. [DOI] [PMC free article] [PubMed] [Google Scholar]
- 42.Chang CC, Lin CJ. LIBSVM: a library for support vector machines. 2001 http://www.csie.ntu.edu.tw/∼cjlin/libsvm. [Google Scholar]
- 43.Chou KC, Zhang CT. Prediction of protein structural classes. Critical Reviews in Biochemistry and Molecular Biology. 1995;30(4):275–349. doi: 10.3109/10409239509083488. [DOI] [PubMed] [Google Scholar]
- 44.Chou KC, Shen HB. Cell-PLoc: a package of Web servers for predicting subcellular localization of proteins in various organisms. Nature Protocols. 2008;3(2):153–162. doi: 10.1038/nprot.2007.494. [DOI] [PubMed] [Google Scholar]
- 45.Esmaeili M, Mohabatkar H, Mohsenzadeh S. Using the concept of Chou’s pseudo amino acid composition for risk type prediction of human papillomaviruses. Journal of Theoretical Biology. 2010;263(2):203–209. doi: 10.1016/j.jtbi.2009.11.016. [DOI] [PubMed] [Google Scholar]
- 46.Mei S. Predicting plant protein subcellular multi-localization by Chou's PseAAC formulation based multi-label homolog knowledge transfer learning. Journal of Theoretical Biology. 2012;310:80–87. doi: 10.1016/j.jtbi.2012.06.028. [DOI] [PubMed] [Google Scholar]
- 47.Chou KC, Wu ZC, Xiao X. iLoc-Euk: a multi-label classifier for predicting the subcellular localization of singleplex and multiplex eukaryotic proteins. PLoS ONE. 2011;6(3) doi: 10.1371/journal.pone.0018258.e18258 [DOI] [PMC free article] [PubMed] [Google Scholar]
- 48.Mohabatkar H. Prediction of cyclin proteins using Chou’s pseudo amino acid composition. Protein and Peptide Letters. 2010;17(10):1207–1214. doi: 10.2174/092986610792231564. [DOI] [PubMed] [Google Scholar]
- 49.Chou KC, Wu ZC, Xiao X. ILoc-Hum: using the accumulation-label scale to predict subcellular locations of human proteins with both single and multiple sites. Molecular BioSystems. 2012;8(2):629–641. doi: 10.1039/c1mb05420a. [DOI] [PubMed] [Google Scholar]
- 50.Mohabatkar H, Mohammad Beigi M, Esmaeili A. Prediction of GABAA receptor proteins using the concept of Chou’s pseudo-amino acid composition and support vector machine. Journal of Theoretical Biology. 2011;281(1):18–23. doi: 10.1016/j.jtbi.2011.04.017. [DOI] [PubMed] [Google Scholar]
- 51.Ding C, Yuan LF, Guo SH, Lin H, Chen W. Identification of mycobacterial membrane proteins and their types using over-represented tripeptide compositions. Journal of Protemics. 2012;77:321–328. doi: 10.1016/j.jprot.2012.09.006. [DOI] [PubMed] [Google Scholar]
- 52.Ohtsuka K, Hata M. Mammalian HSP40/DNAJ homologs: cloning of novel cDNAs and a proposal for their classification and nomenclature. Cell Stress and Chaperones. 2000;5(2):98–112. doi: 10.1379/1466-1268(2000)005<0098:mhdhco>2.0.co;2. [DOI] [PMC free article] [PubMed] [Google Scholar]
Associated Data
This section collects any data citations, data availability statements, or supplementary materials included in this article.
Supplementary Materials
According to the binomial distribution, we analyzed the distribution of the tripeptides and found the over-presented tripeptides in each J-protein families. Listed in Supporting Table S1 are the over-presented tripeptides with confidence level (=1-p) greater than 99.9%.