Abstract
The chromatin immunoprecipitation (ChIP) assay is widely used to capture interactions between chromatin and regulatory proteins, but it is unknown how stable most native interactions are. Although live cell imaging suggests short-lived interactions at tandem gene arrays, current methods cannot measure rapid binding dynamics at single-copy genes. Here we show using a modified ChIP assay with sub-second temporal resolution that the time dependence of formaldehyde crosslinking can be used to extract in vivo on- and off-rates for site-specific chromatin interactions varying over a ~100-fold dynamic range. Using the method, we show that a regulatory process can shift weakly bound TATA-binding protein to stable promoter interactions, thereby facilitating transcription complex formation. This assay provides an approach for systematic, quantitative analyses of chromatin binding dynamics in vivo.
The chromatin immunoprecipitation (ChIP) assay is an approach for determining where chromatin-binding factors interact with DNA sequences, and as such has provided fundamental insight into where and how gene regulatory processes occur in cells. In the ChIP assay, cellular constituents are crosslinked with formaldehyde, the isolated chromatin is fragmented, and protein-DNA complexes are then recovered by immunoprecipitation using an antibody that detects a chromatin-associated protein of interest. DNA sequences in the immunoprecipitate are then inventoried by PCR. The assay accurately defines where proteins bind (1), but it provides limited information about how stable the interactions are. For example, a relatively high ChIP signal could reflect high occupancy stable binding, or that a low-occupancy dynamic interaction was trapped owing to the long formaldehyde incubation period employed in standard assays. In fact, live cell imaging approaches indicate that many chromatin interactions are exceedingly short-lived (2) (3), although such techniques do not provide high resolution data regarding chromatin binding location. Precise chromatin location information can be obtained by competition ChIP, a method that monitors the replacement rate by a differentially tagged factor of interest. However, the time resolution is limited to ~20 min owing to the delay required to generate the competitor species (e.g., (4–6)). A general assay that provides quantitative measures of site-specific on- and off-rates is essential for defining chromatin regulatory events as they occur in vivo.
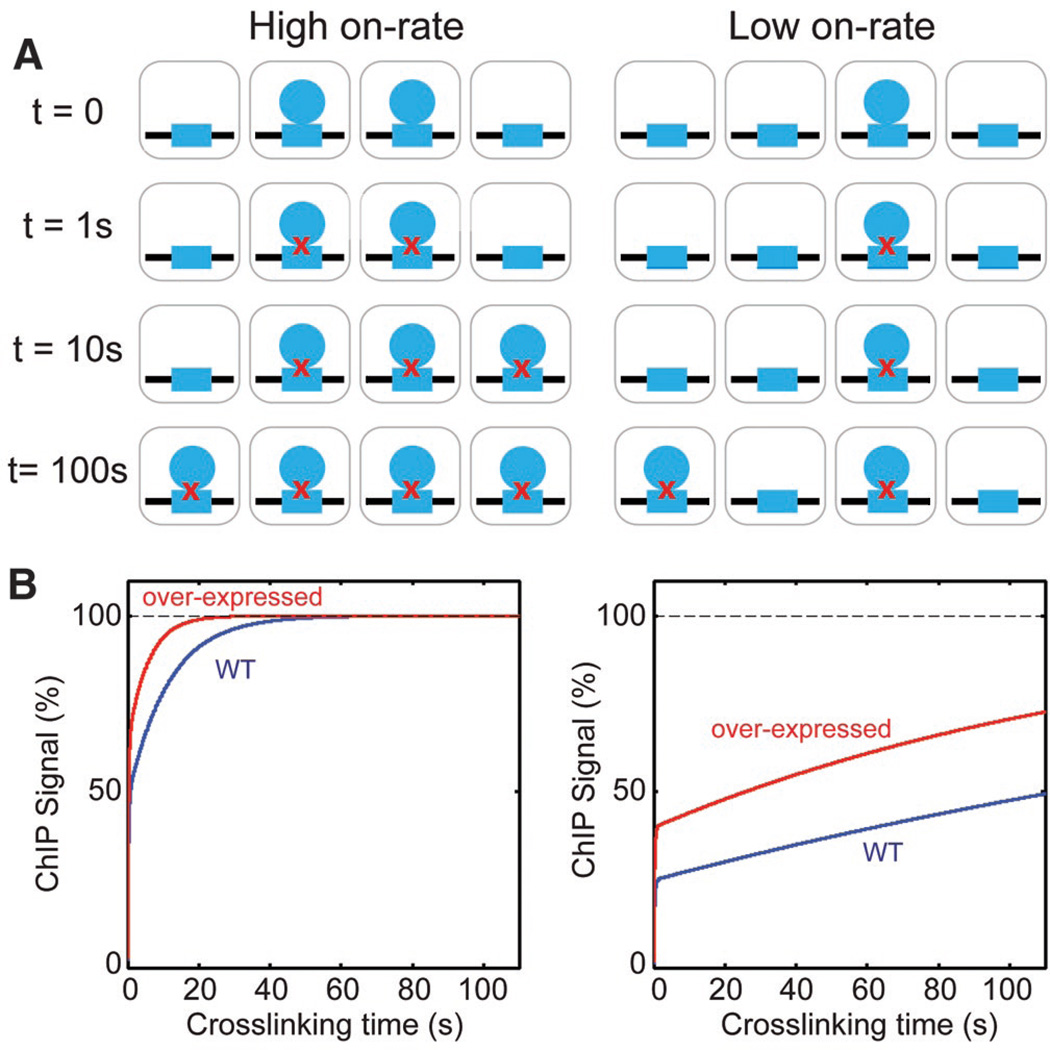
To measure chromatin-binding dynamics in vivo, we developed and applied a mathematical model based on standard principles of chemical kinetics that describes the dependence of ChIP signal on formaldehyde crosslinking time. In this method, which we call crosslinking kinetic (CLK) analysis (7), the mathematical relationship between crosslinking time and ChIP signal is used to extract the overall on-rate (the product of the second order rate constant, ka, and the chromatin binding factor concentration CTF), the off-rate, kd, and the fraction of bound chromatin sites at steady state, . If CTF is known, then the value of ka can be determined. From kd, the half-life, t1/2, of the chromatin complex can be calculated (t1/2 = ln2/kd). Fig. 1A illustrates the model for a chromatin interaction with a relatively high on-rate (left) or low on-rate (right). Both complexes have the same off-rate, so the higher on-rate gives rise to a higher fractional occupancy prior to addition of formaldehyde (t=0). If formaldehyde crosslinking occurs rapidly as expected (supplementary online text), then complexes will be crosslinked at this rapid rate driven by crosslinking kinetics (row labeled t=1s), fixing the in vivo occupancy in each cell within the first few seconds. At longer formaldehyde incubation times, the unbound chromatin sites become occupied and crosslinked at a rate driven by kaCTF, resulting in an additional increase in the ChIP signal over time. Simulations (Fig. 1B) show this biphasic behavior. The inflection or “knee” in the curves reveals the fractional occupancy in the cell population within the first few seconds of crosslinking. To better constrain the model fits of the data, measurements were made using cells expressing two different concentrations of the transcription factor (TF) of interest, and the two data sets were fit simultaneously.
Figure 1. Overview of the CLK model.
(A) Schematic showing a chromatin site (blue rectangle) interacting with a transcription factor (blue circle) in a population of four cells in which chromatin binding has a relatively high on-rate (left) or low on-rate (right), but in both cases the off-rate is the same. Rows descending from t=0 show how the site occupancy in the cell population is predicted to change following addition of formaldehyde for 1, 10 or 100 seconds. Red X’s indicate crosslinking. (B) Simulations of the two scenarios in (A) using the CLK model (blue lines). The red lines show simulations in which the TF concentration was increased three-fold.
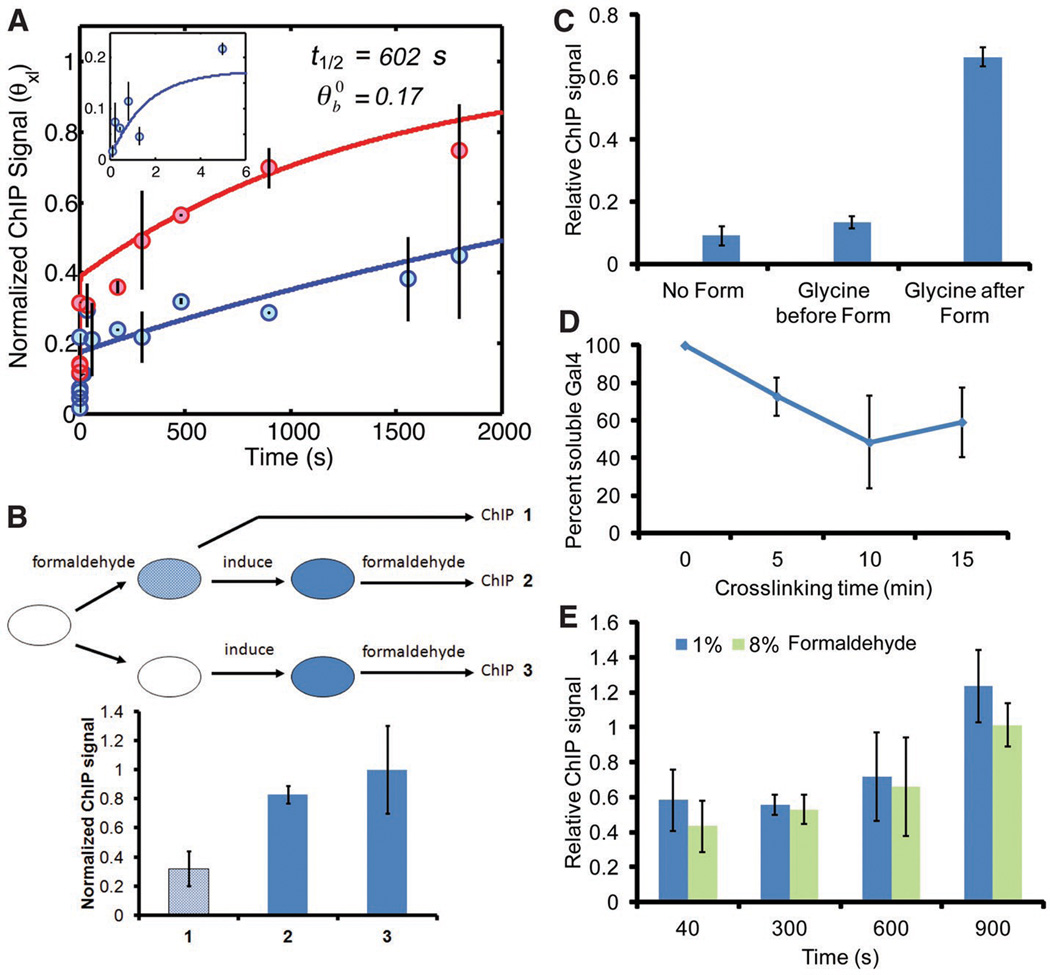
To test the CLK method, we analyzed Gal4 binding to the single UAS in the GAL3 promoter. The Gal4 system has provided a paradigm for transcriptional regulation (8), but the in vivo stability of the Gal4-promoter interaction has been the subject of debate (9) (10). A quench flow apparatus was adapted to acquire formaldehyde-treated samples on the sub-second timescale, and longer time points were obtained by hand mixing, prior to quenching in glycine (supplementary online text). As predicted by the simulations (Fig. 1, fig. S2, S3), the ChIP signal increased dramatically at short formaldehyde incubation times (< 5 sec), and then gradually following longer incubation times (Fig. 2A, blue curve). The time dependence of the ChIP signal substantiates several key aspects of the model (fig. S4), and other fundamental suppositions were validated experimentally. First, the steep increase in ChIP signal at short crosslinking times demonstrates that crosslinking occurred rapidly and that glycine efficiently quenched the reaction (Fig. 2A,C), as stipulated in the model. The curve was shifted upward in cells with a 2.5-fold increase in Gal4, (Fig. 2A, red curve), consistent with the time dependence of the slower phase of the ChIP signal being driven by the overall on-rate for Gal4 chromatin binding and not formaldehyde reaction kinetics. In the model, the ChIP assay rapidly captures specifically bound TFs but does not inactivate or nonspecifically crosslink the remaining TF pool. Remarkably, the Gal4-promoter interaction occurred in cells even when binding was induced after formaldehyde pre-treatment (Fig. 2B). Thus, Gal4 was not nonspecifically inactivated by formaldehyde. Moreover, the levels of soluble Gal4 and other proteins were reduced less than two-fold in cell extracts following formaldehyde incubation, and their apparent molecular weights were not detectably affected (Fig. 2D, fig. S1). In addition, ChIP signals were indistinguishable over an 8-fold range of formaldehyde concentration (Fig. 2E), demonstrating that formaldehyde was not limiting in the reaction. CLK analysis revealed that the Gal4-GAL3 interaction had a t1/2 of about 10 min (Fig. 2A; table S9), suggesting that a single Gal4 complex facilitates multiple rounds of transcription initiation. Combined with the low fractional promoter occupancy (~0.17), we conclude that the GAL3 gene is likely transcribed in infrequent bursts.
Figure 2. CLK analysis of Gal4 and tests of model assumptions.
(A) Model fits of CLK data for Gal4 binding to the GAL3 promoter in cells with WT Gal4 levels (blue line) and cells with 2.5-fold overexpression of Gal4 (red line). Inset shows first 5 sec of time course from cells with WT Gal4 levels. (B) Gal4 ChIP results obtained with cells treated as shown in the schematic. ChIP signal obtained in formaldehyde treated, uninduced cells (1), formaldehyde treated cells subsequently induced by addition of galactose (2), and cells induced with galactose and subsequently treated with formaldehyde (3). Note that Gal4 chromatin binding was fully inducible in formaldehyde treated cells. (C) Glycine addition prior to formaldehyde (Form) prevents crosslinking. The graph shows the relative Gal4 ChIP signal obtained when glycine was added prior to formaldehyde or 8 min after formaldehyde treatment, compared to cells in which no formaldehyde was added. (D) Relative soluble Gal4 protein level in extracts from cells treated with formaldehyde for the indicated times. Gal4 was quantified by Western blotting. (E) Gal4 ChIP signals at GAL3 obtained using cells treated with 1% or 8% formaldehyde for the indicated times. ChIP signals did not depend on formaldehyde concentration.
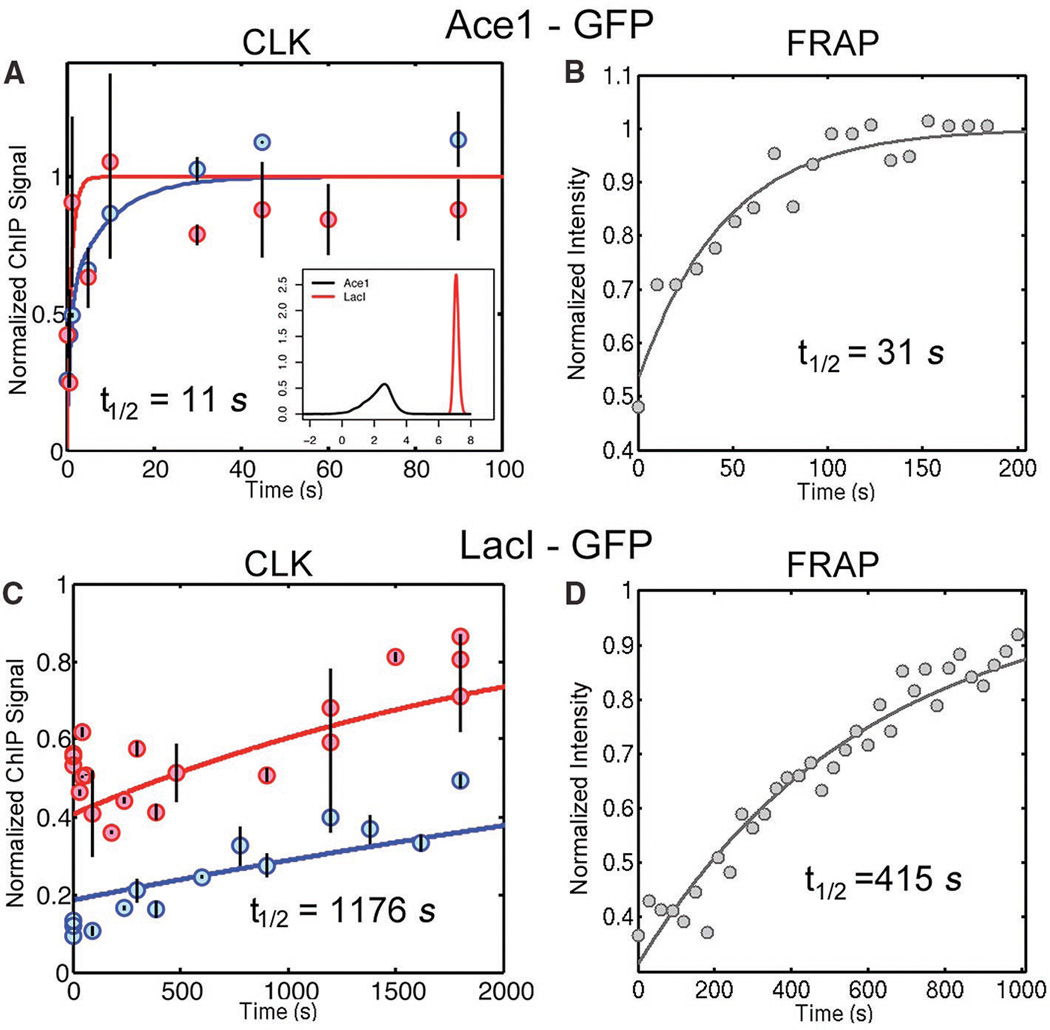
To better define the dynamic range of the CLK method, we analyzed two TFs whose widely divergent dynamic behavior could be independently measured by fluorescence recovery after photobleaching (FRAP). FRAP was possible in these cases because the fluorescently tagged factors interact with tandem arrays of binding sites, making the chromosomal loci visible by microscopy. The CLK measured t1/2 for the interaction of Ace1-GFP with the CUP1 gene array (11) was 11 sec, in excellent agreement with the value of 31 sec obtained by FRAP (Fig. 3A,B; table S8). The interaction of LacI-GFP with an array of Lac operators (12) was far more stable, and the two methods yielded t1/2 values that differ by less than 3-fold (Fig. 3C,D; table S8). Thus, as validated by an independent approach, the CLK method can reveal rank-ordered estimates of TF-chromatin interaction stability over a wide range in vivo, including interactions that persist for mere seconds. Compared to other methods, the CLK method increases the time resolution of chromatin dynamics at single copy loci by two to three orders of magnitude.
Figure 3. Comparison of TF-chromatin dynamics by CLK and FRAP.
(A) Model fits of CLK data for Ace1-GFP binding to CUP1 in cells with two different expression levels of Ace1-GFP (low, blue curve; high, red curve; table S2). Inset: distributions of t1/2 values obtained from multiple independent fits of the Ace1-GFP or LacI-GFP CLK data (shown in (C); (7)). (B) FRAP of Ace1-GFP in cells with low Ace1-GFP levels. (C) Model fits of CLK data for LacI-GFP binding to the Lac array in cells with low (blue curve) or high (red curve) levels of LacI-GFP (table S2). (D) FRAP of LacI-GFP in cells with low LacI-GFP levels.
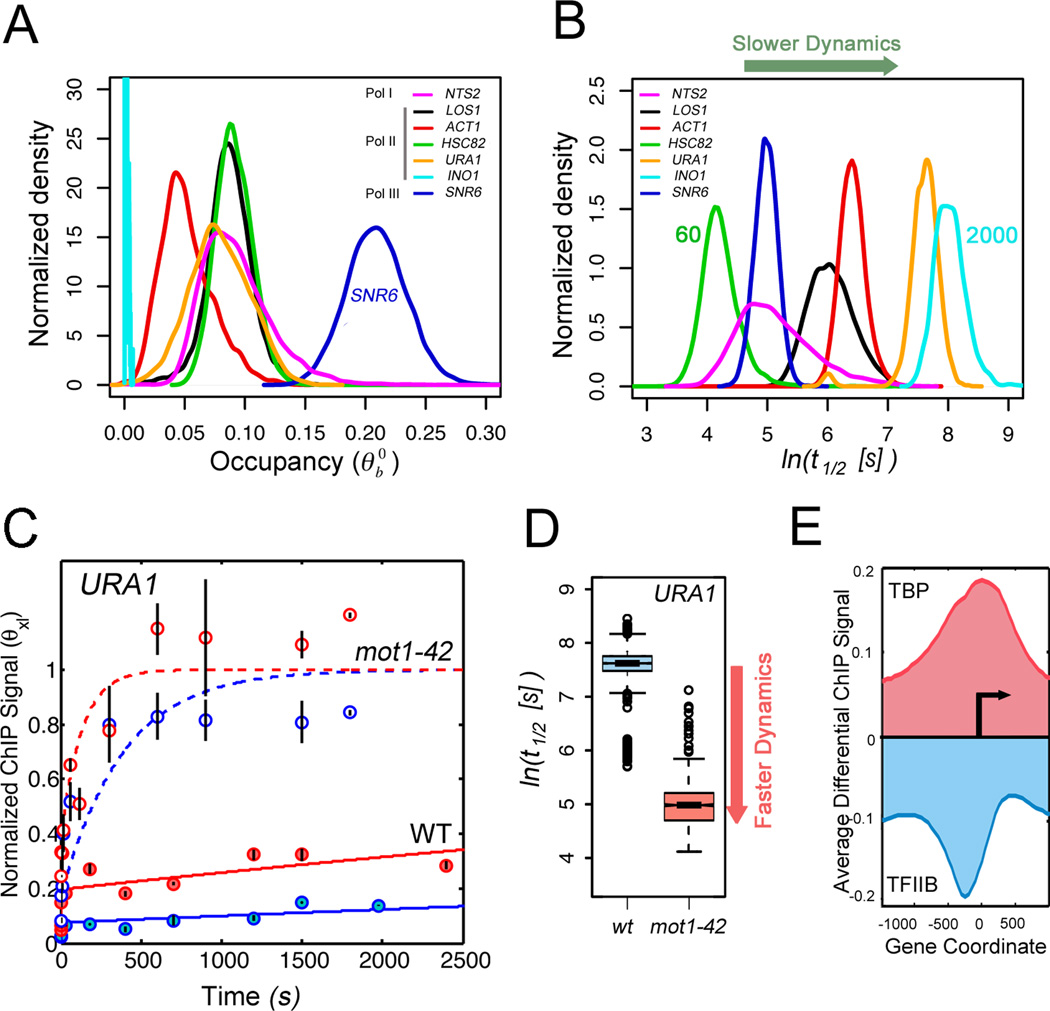
To further explore transcription dynamics using this method, we investigated the interaction of the TATA-binding protein (TBP) with each of seven different promoters possessing diverse transcriptional activities and driven by RNA polymerases I, II or III. Consistent with expectation (13), the Pol III-driven SNR6 promoter had the highest occupancy, however, interestingly, occupancies of all promoters were well below saturation (Fig. 4A; supplementary online text). Moreover, TBP-promoter interactions varied dramatically, with t1/2 values ranging from one to about thirty minutes (Fig. 4B; table S7), and in many cases half-lives were much shorter than distinguishable by any other technique. To test whether the method can quantify a dynamic difference associated with a perturbation in cellular transcription, we compared TBP dynamics in WT and mot1-42 cells. Mot1 is an essential regulator of TBP, which uses its ATPase activity to dissociate TBP from DNA in vitro (14). Evidence supports a direct role for Mot1 in gene activation, but how it accomplishes this is unknown. Using URA1 as a model Mot1-activated gene (15), we observed dramatically different CLK curves for TBP binding to the URA1 promoter in WT and mot1-42 cells (Fig. 4C; table S7). Biochemical results suggested that Mot1 would activate URA1 expression by displacing stably bound but inactive TBP from the promoter. Surprisingly, however, mutation of Mot1 caused TBP binding to be far more dynamic than in WT cells (Fig. 4D). Similar results were observed at INO1, another Mot1-regulated promoter (fig. S13; table S7).
Figure 4. TBP dynamics and regulation by Mot1.
(A) Distributions of TBP occupancy at different yeast promoters obtained by multiple independent fits of the CLK data (7). (B) Distributions of TBP-promoter half-lives (7), whose mean values vary from 60 to about 2000 seconds. (C) Model fits of CLK data for TBP binding to the Mot1-activated URA1 promoter in WT (sold lines) and mot1-42 cells (dashed lines). Data and fits from cells expressing WT levels of TBP are shown in blue, results from cells over-expressing TBP are in red. (D) Boxplots for distribution of t1/2 values (log scale) for TBP binding to the Mot1-activated URA1 promoter in WT (blue) and mot1-42 cells (red). (E) Average genome-wide log2 differential TBP and TFIIB ChIP-chip signals at promoters in mot1-42 versus WT cells shown with respect to the transcription start site (arrow) (7).
To reconcile the CLK data with Mot1’s biochemical activity and shed light on the process of transcription complex assembly in vivo, we compared the genome-wide TBP ChIP signal at a single crosslinking time in WT and mot1-42 cells. Mutation of Mot1 increased the TBP ChIP signal at Pol II promoters, and the increase extended well outside the average nucleosome-free promoter region of about 200 bp and into flanking transcribed regions (Fig. 4E, fig S14). TFIIB is a hallmark of transcriptional activity, but in contrast, the TFIIB ChIP signal decreased over these same regions. Thus, unstable TBP complexes detectable in mot1-42 cells were not associated with TFIIB and were transcriptionally inactive. Stable TBP complexes are apparently better substrates for TFIIB binding, and in turn, the binding of TFIIB and other factors can block TBP clearance by Mot1 (14). Rather than catalyzing dissociation of stable interactions, these results reveal that Mot1 is responsible for dissociating weakly bound TBPs at diverse sites, thereby facilitating more stable TBP binding in functional transcription complexes. This enzyme-catalyzed change in TBP dynamics appears essential for proper gene expression; analogous processes may facilitate functional high affinity chromatin binding at the expense of weak binding by other TFs as well.
The CLK assay yields estimates of physical kinetic parameters as opposed to relative rates, and it is applicable over a much broader time scale than competition ChIP since it is not limited by the time required to synthesize or activate a competitor molecule. This will permit rapid chromatin interaction dynamics for a factor to be compared directly to kinetic parameters for functionally related factors or processes. The CLK methodology is in principle not limited to yeast, and it is based on ChIP, one of the most widely used assays in chromatin research. Our data suggest an explanation for why there is no detectable stable chromatin-bound TBP as judged by live cell imaging (16), but there are stable TBP complexes as judged by competition ChIP (4). The CLK results show that TBP fractional occupancies are low. Thus, while there are stable TBP-promoter complexes in vivo, most promoters are not occupied at steady state. The surprisingly low occupancies are consistent with results showing that transcription in vivo occurs via uncoordinated stochastic cycles separated in time (17, 18). CLK results also illustrate the danger of inferring relative occupancies or dynamics from ChIP assays employing single, long formaldehyde incubation times. TBP ChIP signals are much greater in mot1-42 cells than in WT cells, but the higher ChIP signals result from highly dynamic TBP molecules being trapped during the formaldehyde incubation period, rather than reflecting stable TBP binding.
Supplementary Material
Acknowledgments
We thank K. Struhl, F. Pugh, S. Hahn and P. deHaseth for discussion, R. Nakamoto and M. Galkin for discussions and help with the KinTek instrument, J. Muldoon, J. Hopper, F. Pugh, and S. Hahn for strains and plasmids. J.M. and T.K. were supported by the intramural program of the National Institutes of Health, National Cancer Institute, Center for Cancer Research. Supported by NIH grant GM55763 to D.T.A.
Footnotes
Supporting Online Material
SOM Text
Figs. S1 to S15
Tables S1 to S9
References (19–37)
References
- 1.Rhee HS, Pugh BF. Cell. 2011;147:1408. doi: 10.1016/j.cell.2011.11.013. [DOI] [PMC free article] [PubMed] [Google Scholar]
- 2.Hager GL, McNally JG, Mistelli T. Mol. Cell. 2009;35:741. doi: 10.1016/j.molcel.2009.09.005. [DOI] [PMC free article] [PubMed] [Google Scholar]
- 3.van Royen ME, Zotter A, Ibrahim SM, Geverts B, Houtsmuller AB. Chromosome Res. 2011;19:83. doi: 10.1007/s10577-010-9172-5. [DOI] [PubMed] [Google Scholar]
- 4.van Werven FJ, van Teeffelen HAAM, Holstege FCP, Timmers HTM. Nat. Struct. & Mol. Biol. 2009;16:1043. doi: 10.1038/nsmb.1674. [DOI] [PubMed] [Google Scholar]
- 5.Deal RB, Henikoff JG, Henikoff S. Science. 2010;328:1161. doi: 10.1126/science.1186777. [DOI] [PMC free article] [PubMed] [Google Scholar]
- 6.Lickwar CR, Mueller F, Hanlon SE, McNally JG, Lieb JD. Nature. 2012;484:251. doi: 10.1038/nature10985. [DOI] [PMC free article] [PubMed] [Google Scholar]
- 7.Materials and methods are available as supporting material on Science Online.
- 8.Traven A, Jelicic B, Sopta M. EMBO Rep. 2006;7:496. doi: 10.1038/sj.embor.7400679. [DOI] [PMC free article] [PubMed] [Google Scholar]
- 9.Collins GA, Lipford JR, Deshaies RJ, Tansey WP. Nature. 2009;461:E7. doi: 10.1038/nature08406. [DOI] [PMC free article] [PubMed] [Google Scholar]
- 10.Nalley K, Johnston SA, Kodadek T. Nature. 2009;461:E8. doi: 10.1038/nature05067. [DOI] [PubMed] [Google Scholar]
- 11.Karpova TS, et al. Science. 2008;319:466. doi: 10.1126/science.1150559. [DOI] [PubMed] [Google Scholar]
- 12.Robinett CC, et al. J. Cell Biol. 1996;135:1685. doi: 10.1083/jcb.135.6.1685. [DOI] [PMC free article] [PubMed] [Google Scholar]
- 13.Roberts DN, Stewart AJ, Huff JT, Cairns BR. PNAS. 2003;100:14695. doi: 10.1073/pnas.2435566100. [DOI] [PMC free article] [PubMed] [Google Scholar]
- 14.Viswanathan R, Auble DT. BBA Gene Reg. Mech. 2011;1809:488. doi: 10.1016/j.bbagrm.2011.05.012. [DOI] [PMC free article] [PubMed] [Google Scholar]
- 15.Sprouse RO, et al. J. Biol. Chem. 2008;283:24935. doi: 10.1074/jbc.M803749200. [DOI] [PMC free article] [PubMed] [Google Scholar]
- 16.Sprouse RO, et al. PNAS. 2008;105:13304. doi: 10.1073/pnas.0801901105. [DOI] [PMC free article] [PubMed] [Google Scholar]
- 17.Larson DR, Zenklusen D, Wu B, Chao JA, Singer RH. Science. 2011;332:475. doi: 10.1126/science.1202142. [DOI] [PMC free article] [PubMed] [Google Scholar]
- 18.Suter DM, et al. Science. 2011;332:472. doi: 10.1126/science.1198817. [DOI] [PubMed] [Google Scholar]
Associated Data
This section collects any data citations, data availability statements, or supplementary materials included in this article.


