Abstract
Obesity-induced changes in the metabolic and endocrine milieu elicit deficits in neuroplasticity, including increased risk for development of neuropsychiatric disorders such as depressive illness. We previously demonstrated that downregulation of hypothalamic insulin receptors (hypo-IRAS) elicits a phenotype that is consistent with features of the metabolic syndrome (MetS) and that rats with this phenotype exhibit deficits in neuronal plasticity, including depressive-like behaviors such as anhedonia. Since food restriction paradigms effectively inhibit obesity-induced neuroplasticity deficits, the aim of the current study was to determine whether food restriction could reverse obesity-induced anhedonia in hypo-IRAS rats. Compared to hypo-IRAS rats provided ad lib food access, food restriction paradigms that were initiated either prior to increases in body weight or following development of the MetS/obesity phenotype effectively restored sucrose intake in hypo-IRAS rats. Moreover, food restriction paradigms were able to prevent and reverse the changes in the endocrine/metabolic/inflammatory milieu observed in hypo-IRAS, such as increases in plasma leptin and triglyceride levels and increases in pro-inflammatory cytokines such as IL-1α, IL-6 and C-reactive protein (CRP). Collectively, these results demonstrate that obesity-induced anhedonia is a reversible process and identify some potential mechanistic mediators that may be responsible for co-morbid depression in obesity.
Keywords: leptin, triglycerides, pro-inflammatory cytokines, metabolic syndrome, depressive illness
1. Introduction
Obesity is defined as a body mass index (BMI) of greater than 30 and is associated with a host of co-morbidities, including cardiovascular disease and type 2 diabetes mellitus (T2DM). In addition to peripheral complications, there is a growing appreciation that the complications of obesity extend to the central nervous system (CNS) and may result in increased risk for neurological co-morbidities like depressive illness. In support of this hypothesis, clinical and epidemiological studies indicate that there is an association between obesity and mood disorders [1-6]; this correlation is particularly strong for individuals with a BMI greater than 40 [7]. A number of factors have been suggested as mechanistic links between obesity and mood disorders; a potential mechanistic mediator linking obesity and depressive illness that has been somewhat underappreciated is the adipocyte derived hormone leptin. A number of studies suggest that leptin is involved in depressive-like behaviors [8]. For example, chronic stress-induced behavioral despair in the forced swim test (FST) is reversed by leptin administration in a dose-dependent manner [9]. Leptin administration also reverses chronic stress-induced anhedonia as measured by sucrose intake [9]. Some additional studies support the hypothesis that decreases in brain leptin activity is a mechanistic link between obesity and depressive-like behaviors. In this regard, ob/ob mice, which lack the gene coding for leptin, exhibit increased immobility time in the FST compared to wild-type controls [10,11]. Additionally, db/db mice, which lack functional leptin receptors, exhibit increased immobility time in the FST and altered anxiety-like behaviors [12]. Beyond leptin, there is an emerging appreciation that pro-inflammatory cytokines are mechanistic mediators in depressive illness pathogenesis and do not merely serve as biomarkers. In this regard, clinical studies indicate that plasma levels of IL-6 and TNF-α are elevated in patients with depression and pro-inflammatory cytokines are linked to treatment resistant depression [13]. Moreover, preclinical studies demonstrate that pro-inflammatory cytokines elicit depressive-like symptoms in animals [14]. Mechanistically, pro-inflammatory cytokines are proposed to decrease brain-derived neurotrophic factor (BDNF) levels, as well as impair the activity of neural networks implicated in the pathology of depressive illness [14].
The wide variety of endocrine and metabolic changes associated with obesity is an obvious obstacle in accurately identifying the mechanistic links between metabolic stress and neuropsychiatric disorders. Due to the absence of good pharmacological tools such as an insulin receptor antagonist, we have developed an alternative molecular strategy to more selectively examine the role of insulin receptors (IRs) in neuroplasticity deficits observed in obesity phenotypes. In this regard, we have developed a lentivirus vector that produces an antisense RNA selective for the insulin receptor (IRAS) [15-18]. Hypothalamic administration of the LVIRAS construct (hypo-IRAS) elicits a phenotype that is consistent with features of the metabolic syndrome (MetS), including increased body weight and adiposity, increases in plasma leptin and plasma triglycerides, as well as hepatic insulin resistance [19]. Although hippocampal insulin receptor (IR) expression and signaling is unaffected, hypo-IRAS rats exhibit deficits in hippocampal synaptic plasticity that include changes in the phosphorylation state of AMPA receptors, failure to develop stimulus-induced long term potentiation (LTP) and deficits in hippocampal dependent learning [16]. In view of the increased risk of depressive illness in obesity, we recently examined depressive-like behaviors in our model of obesity/MetS. These studies demonstrated that hypo-IRAS rats developed a depression-like phenotype that included decreased sucrose preference (i.e. anhedonia) [17]. Hypo-IRAS rats also exhibited significant decreases in plasma BDNF levels. Since our previous studies determined that mild food restriction paradigms can prevent or reverse the deficits in hippocampal synaptic plasticity observed in hypo-IRAS rats [18], a goal of the current study was to determine whether these food restriction paradigms could reverse obesity-induced anhedonia in hypo-IRAS rats. In addition, we examined whether obesity-induced anhedonia was associated with changes in pro-inflammatory cytokines, as well as whether food restriction affected pro-inflammatory cytokine levels in our experimental model of MetS.
2. Materials and methods
2.1. Animal Protocols
Adult male Sprague Dawley rats (CD strain, Charles River) weighing 225-250 g were housed in groups of three with ad libitum access to water and food (Harland Teklad rodent diet #8604), in accordance with all guidelines and regulations of The University of South Carolina Animal Care and Use Committee. Animals were maintained in a temperature-controlled room, with a light/dark cycle of 12/12 h (lights on at 0700h). As described previously [15-18], rats were anesthetized, placed in the stereotaxic apparatus and lentivirus was injected into the third ventricle using the following coordinates : AP: -2.6 mm; L: 0.0 mm; DV: -10.0 mm. Rats were injected with lentivirus containing an antisense sequence selective for the IR (LV-IRAS) or control virus (LV-Con). The viral stock (5x10⁶ tu/μl) was injected at a speed of 1 μl/min with a 10 μl Hamilton syringe driven by a motorized stereotaxic injector (Stoelting 53310); the needle was left in place for additional 10 min. Total volume injected was 6 μl. After surgery rats were individually housed. A series of pilot studies were conducted in hypo-IRAS rats to determine the time points to initiate food restriction. Twenty-four hour food intake was monitored prior to increases in body weight (10 days post-injection) and after significant increases in body weight (19 days post-injection). Based on these observations, the Prevention group and the Reversal group were provided the same amount of food each day as was consumed by the hypo-Con rats on day 19, which represents approximately 80% of food intake of ad lib hypo-IRAS rats 19 days post viral vector injection. For the subsequent food restriction studies, hypo-IRAS rats were divided into three experimental groups: 1) rats provided ad libitum access to food, 2) rats subjected to food restriction at day 5 (Prevention group), and 3) rats subjected to food restriction at day 21 (Reversal group), as described previously [18]. These feeding conditions were maintained in hypo-IRAS group until the completion of the study, approximately 45 days after LV-IRAS administration. Under these conditions, the ‘Prevention’ group does not develop an obesity phenotype, while the obesity phenotype is reversed in the ‘Reversal’ group. Control (hypo-Con) rats were provided ad lib access to food throughout the study.
2.2. Anhedonia
Anhedonic-like response to a palatable fluid was performed approximately 40 days post virus administration as described in our previous study [17]. Briefly, rats were exposed for 24 hours to two identical bottles containing water and 1% sucrose solution (Sigma Chemical Co., St Louis MO). The next day the rats were water-deprived for 6 hours (1300h-1900h) before testing their preference for sucrose (1%) or water (identical bottles) in a two-bottle choice beginning at 1900h. Sucrose preference is defined as the ratio of sucrose intake/sucrose + water intake.
2.3. Plasma metabolic and endocrine analysis
Plasma was isolated from trunk blood collected at 10:00 am under non-fasting conditions approximately 45 days post-virus surgery. Plasma triglycerides were determined using an enzymatic kit (modified Trinder) according to the manufacturer's instructions (Pointe Scientific, Inc., Canton, MI, USA). Determination of plasma CORT was performed using a commercially-available ELISA kit (Enzo Life Sciences, Inc., Plymouth Meeting, PA). Determination of plasma leptin was performed using a commercially available leptin ELISA kit (Millipore Corporation, Billerica, MA). Plasma BDNF levels were determined using a commercial available ELISA from Promega (BDNF Emax ImmunoAssay System, Promega Corp., Madison, WI). ELISA plates were analyzed with a BioTek Synergy microplate reader (BioTek Instruments Inc., Winooski, VT), according to the manufacturers’ instructions.
2.4. Plasma cytokine analysis
Plasma cytokine analysis was performed using the Bio-Plex cytokine 9-plex A panel system according to the manufacturer's instructions. This panel consists of the following cytokines: IL-1α, IL-1β, IL-2, IL-4, IL-6, IL-10, GM-CSF, IFN-γ and TNF-α. Plates were analyzed with a Bio-Plex System coupled to Bio-Plex Manager software. Plasma analysis for C-reactive protein (CRP) was performed using a commercial available ELISA from BD Biosciences (San Diego, CA). ELISA plates were analyzed with a BioTek Synergy microplate reader (BioTek Instruments Inc., Winooski, VT), according to the manufacturers’ instructions.
2.5. In vitro phosphorylation assays
In vitro phosphorylation of the insulin receptor was performed as described in our previous studies [15,18] based upon protocols developed by Alkon and co-workers [20,21]. Briefly, 50 μg of hypothalamic total membrane fractions isolated from hypo-Con rats, ad lib hypo-IRAS rats, Prevention rats and Reversal rats were incubated with reaction buffer (50 mM Tris-HCl, pH 7.4; 1 mM MgCl2; 2 mM EGTA; 1x protease inhibitor cocktail [Sigma Chemical Company]; 1x phosphatase inhibitor cocktail [Sigma Chemical Company]). In vitro phosphorylation was stimulated by addition of 1 μM insulin and 5 mM ATP. Following addition of insulin/ATP, samples were incubated for 3 minutes at 37°C. SDS/PAGE sample buffer was quickly added, the samples were boiled for 10 minutes and added to a precast 4-20% SDS/PAGE gel (Bio-Rad Laboratories).
2.6. Statistical analysis
Statistical analysis was performed using StatView. Analysis of data was performed using a one-way ANOVA, followed by a Student-Newman-Keuls post-hoc test, with P < 0.05 as the criterion for statistical significance.
3. RESULTS
3.1. Hypo-IRAS rats exhibit increased food intake
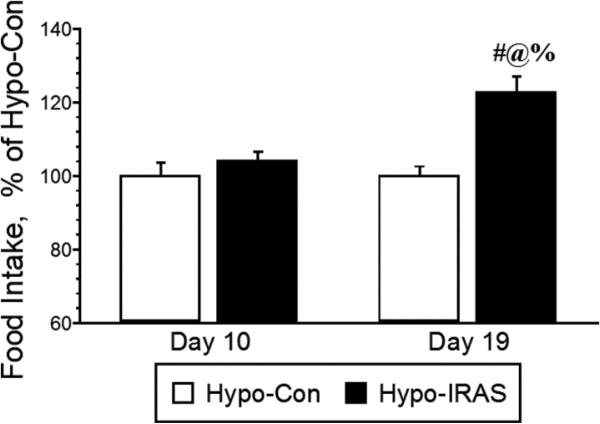
Based on our prior studies assessing body weight changes in hypo-IRAS rats [15-18], 24 hour food intake was monitored prior to increases in body weight (10 days post-injection) and after significant increases in body weight (19 days post-injection) in hypo-Con and hypo-IRAS rats. As shown in Figure 1, food intake did not significantly differ between hypo-Con rats and hypo-IRAS rats when measured 10 days after virus administration, consistent with the absence in changes in body weight between the groups at this time point. However, approximately 19 days after virus administration, hypo-IRAS rats exhibited significant increases in food intake. These increases in food intake correspond to the time points at which hypo-IRAS rats exhibit significant increases in body weight ([15,16,18]; also see Figure 2). These results indicate that increases in food intake are responsible, at least in part, for the development of the obesity phenotype in hypo-IRAS rats. These data helped guide the food restriction studies described below.
Figure 1.
Hypo-IRAS rats exhibit increases in food intake that correspond with increases in body weight and adiposity. Twenty-four hour food intake was monitored at a time point in which hypo-IRAS rats do not exhibit changes in body weight (10 days post virus injection) and a time point in which hypo-IRAS rats exhibit significant increases in body weight and adiposity (19 days). While no differences in food intake were observed a the 10 day time point, hypo-IRAS rats exhibited significant increases in food intake 19 days post-injection. These data suggest that increases in food intake contribute in part to the increases in adiposity and body weight observed in hypo-IRAS rats. [F(3,40) 10.79, p= 0.001; data expressed as percentage of food intake observed in hypo-Con rats. # = compared to hypo-Con rats, Day 10; @ = compared to Hypo-IRAS rats, Day 10; % = compared to Hypo-Con rats, Day 19]
Figure 2.
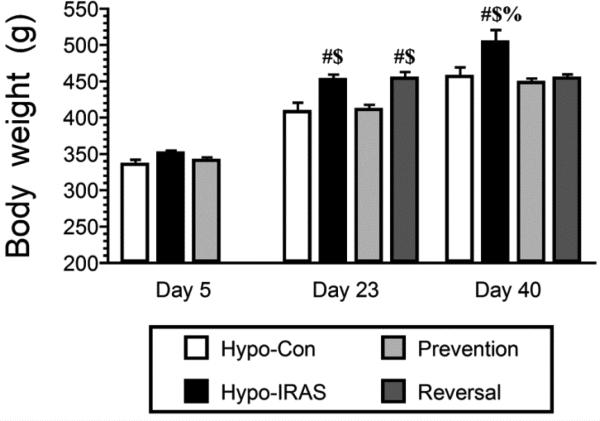
Hypo-IRAS rats exhibit significant increases in body weight that can be prevented or reversed by food restriction. No differences in body weight were observed in the hypo-Con group, ad lib Hypo-IRAS and hypo-IRAS Prevention group 5 days after lentivirus injection (Day 5). Conversely, at Day 23 hypo-IRAS rats provided ad lib access to food exhibited significant increases in body weight, increases not observed in the hypo-IRAS Prevention group. At this time, the hypo-IRAS rats were further divided into a group that continued to have ad lib access to food and the Reversal group. At Day 40, hypo-Con rats, hypo-IRAS Prevention rats and hypo-IRAS Reversal rats all exhibited body weights that were significantly different from the hypo-IRAS rats provided ad lib access to food. [Day 5: F(3,18) 2.931, p = 0.06. Day 23: F(3,18) 11.723, p = 0.0002. Day 40: F(3,18) 11.0, p = 0.0002. # = compared to hypo-Con rats; $ = compared to Prevention rats; % = compared to Reversal rats.]
3.2. Food restriction effects on body weight
We initiated the food restriction paradigm in the Prevention group 5 days after administration of the LV-IRAS construct. At this point, the experimental groups consisted of an ad lib hypo-Con group, an ad lib hypo-IRAS group and the Prevention group; body weights did not differ between the groups at this time point (Figure 2). In agreement with our previous reports [15,16,18], hypo-IRAS rats provided ad lib access to food exhibited significant increases in body weight approximately 3 weeks following virus administration when compared with hypo-Con rats and Prevention rats. The Prevention group exhibited body weights that were nearly identical to hypo-Con rats at Day 23. At this time, the hypo-IRAS rats were split into an ad lib group and a Reversal group. Measurement of body weights at Day 40 revealed that the hypo-IRAS ad lib group continued to exhibited significant increases in body weight, while the Prevention and Reversal groups exhibited body weights that were similar to the body weights of hypo-Con rats.
3.3. Hypo-IRAS-induced anhedonia is prevented and reversed by food restriction
Since we have previously demonstrated that hypo-IRAS rats provided ad lib access to food exhibit decreases in sucrose intake [17], we examined whether food restriction paradigms that prevent or reverse the metabolic changes could affect obesity/MetS-induced anhedonia. The sucrose preference test was performed approximately 40 days after virus administration, corresponding to a time point in which hypo-IRAS rats provided ad lib access to food exhibit significant increases in body weight compared to Prevention rats, Reversal rats and hypo-Con rats (See Figure 2). While total fluid intake did not differ between the groups (Figure 3, Panel A), hypo-IRAS rats provided ad lib access to food exhibited significant decreases in sucrose preference when compared to hypo-Con rats (Figure 3, Panel B). Conversely, hypo-IRAS rats subjected to the Prevention paradigm or the Reversal paradigm exhibited sucrose intake that was similar to the hypo-Con rats.
Figure 3.
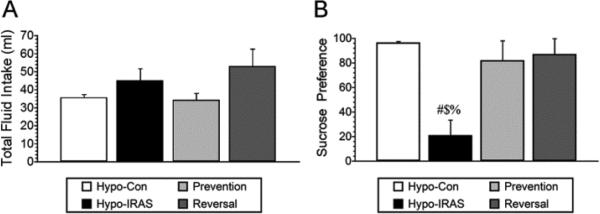
Food restriction prevents and reverses obesity-induced anhedonia in hypo-IRAS rats. Following habituation, sucrose preference (sucrose intake/total fluid intake) was monitored 12 hours following access to either a 1% sucrose solution or water. Hypo-IRAS rats provided ad lib access to food exhibited significant decreases in sucrose intake, while the food restriction paradigms effectively prevented (Prevention) or reversed (Reversal) the obesity-induced anhedonia. [Total fluid intake: F(3,18) 1.819, p = 0.167. Sucrose preference: F(3,18) 5.55, p = 0.007. # = compared to hypo-Con rats; $: compared to Prevention rats; % = compared to Reversal rats.]
3.4. Food restriction effects on plasma metabolic and endocrine parameters
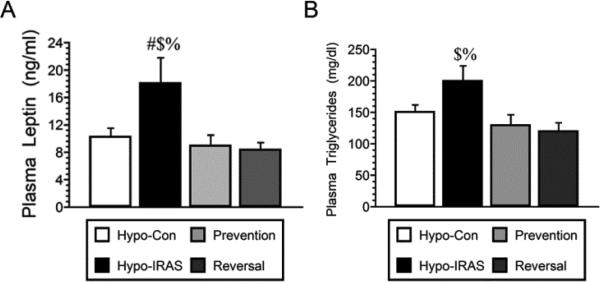
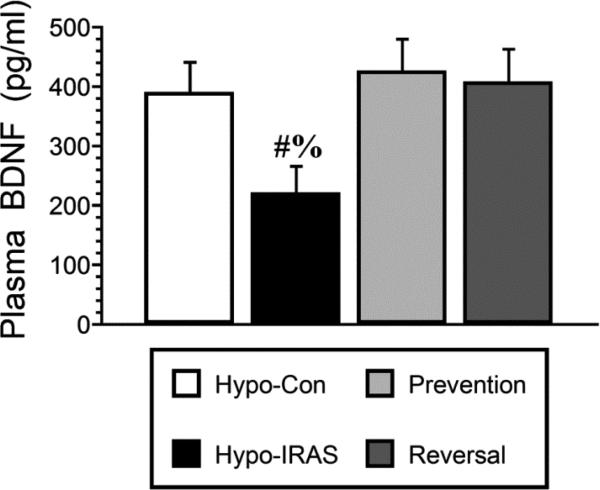
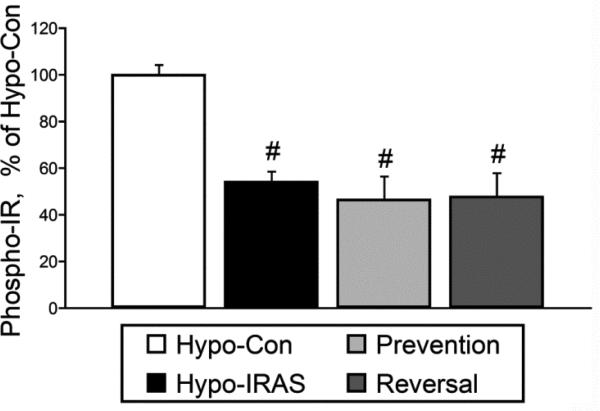
Approximately 45 days after virus injection, plasma was isolated under non-fasting conditions for analysis of endocrine and metabolic parameters. Hypo-IRAS rats provided ad lib access to food exhibited the expected increases in plasma leptin levels (Figure 4, Panel A) and plasma triglyceride levels (Figure 4, Panel B) as described in our previous studies [15,16,18]. In the Prevention group and the Reversal group, plasma leptin and plasma triglyceride levels were similar to those observed in hypo-Con rats. Since our previous studies determined that brain-derived neurotrophic factor (BDNF) expression was decreased in hypo-IRAS rats that exhibited anhedonia [17], we examined plasma BNDF levels in hypo-Con rats, hypo-IRAS rats provided ad lib access to food and hypo-IRAS rats subjected to the food restriction paradigms. As shown in Figure 5, hypo-IRAS rats exhibited the expected decreases in plasma BDNF levels, while plasma BDNF levels were returned to control values in the Prevention and Reversal groups. In agreement with our previous reports [17,18], plasma corticosterone did not differ between any of the groups at Day 21 or Day 45 (data not shown). Insulin-stimulated phosphorylation of hypothalamic IRs was reduced in Hypo-IRAS rats, irrespective of food access (Figure 6). These results indicate that the restoration of metabolic parameters did not result from a recovery of hypothalamic IR expression or signaling in the Prevention and Restriction groups.
Figure 4.
Food restriction paradigms prevent and reverse increases in plasma leptin levels and plasma triglyceride levels in hypo-IRAS rats. Panel A: Hypo-IRAS rats provided ad lib access to food exhibited the expected increases in plasma leptin levels and these increases were prevented when food restriction of hypo-IRAS rats was initiated on day 5 (Prevention) or when food restriction of hypo-IRAS rats was initiated on day 23 (Reversal) [F(3,20) 20.88, p = 0.0001]. Panel B: Hypo-IRAS rats provided ad lib access to food exhibited the expected increases in plasma triglyceride levels, while hypo-IRAS Prevention rats and hypo-IRAS Reversal rats exhibited plasma triglyceride levels that were similar to levels observed in hypo-Con rats [F(3,18) 4.523, p = 0.015. # = compared to hypo-Con rats; $: compared to Prevention rats; % = compared to Reversal rats.]
Figure 5.
Obesity-induced decreases in BDNF levels are prevented and reversed by food restriction. Plasma BDNF levels were significantly reduced in hypo-IRAS rats provided ad lib access to food compared to hypo-Con rats, hypo-IRAS Prevention rats and hypo-IRAS Reversal rats. [F(3,20) 10.74, p = 0.0002. # = compared to hypo-Con rats; $: compared to Prevention rats; % = compared to Reversal rats.]
Figure 6.
In vitro insulin-stimulated phosphorylation of the insulin receptor (phospho-IR) is reduced in the hypothalamus of hypo-IRAS rats irrespective of access to food. Hypo-IRAS rats provided ad libitum access to food, the hypo-IRAS Prevention group and the hypo-IRAS Reversal group exhibited significant decreases in phospho-IR levels when compared to Hypo-Con rats. [F(3,20) 12.53, p = 0.0002. * = compared to hypo-Con]
3.5. Plasma inflammatory cytokine levels are increased in Hypo-IRAS rats
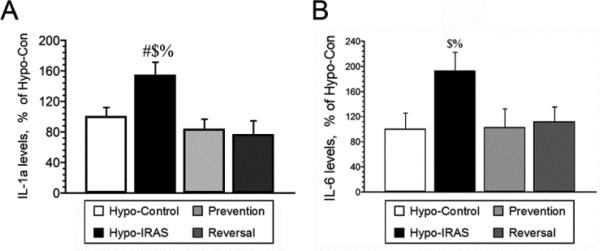
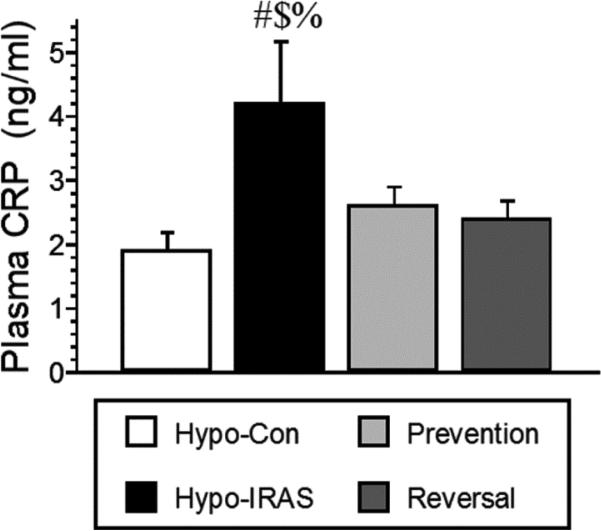
Since preclinical studies demonstrate that pro-inflammatory cytokines elicit depressive-like behaviors in animals [14], we examined plasma cytokine profiles in hypo-Con rats, hypo-IRAS rats provided ad lib access to food, hypo-IRAS-Prevention rats and hypo-IRAS-Reversal rats. As shown in Table 1, hypo-IRAS rats exhibited significant increases in IL-1α levels and IL-6 levels compared to hypo-Con rats, increases that were prevented and reversed by the food restriction paradigms. When these data are expressed relative to values observed in hypo-Con rats, hypo-IRAS rats exhibit a greater than 50% increase in plasma IL-1α levels (Figure 7, Panel A) and a nearly two-fold increase in plasma IL-6 levels (Figure 7, Panel B). Hypo-IRAS rats provided ad lib access to normal chow also exhibited significant increases in plasma C-reactive protein (CRP) levels, increases that were not observed in the Prevention or Reversal groups (Figure 8).
Table 1.
Plasma cytokine profile of Hypo-Control and Hypo- IRAS rats
| Group | Hypo-Control | Hypo-IRAS | Prevention | Reversal | P value |
|---|---|---|---|---|---|
| IL-1α | 24.4 ± 2.7 | 37.0 ± 4.0 | 20.3 ± 3.1 | 18.6 ± 4.2 | 0.008 |
| IL-1β | 55.6 ± 13.6 | 53.2 ± 5.4 | 44.3 ± 7.2 | 42.0 ± 6.2 | 0.612 |
| IL-2 | 31.79 ± 3.6 | 45.2 ± 6.2 | 28.1 ± 4.6 | 26.3 ± 5.0 | 0.058 |
| IL-4 | 13.0 ± 1.3 | 17.3 ± 2.6 | 13.6 ± 1.8 | 12.4 ± 2.6 | 0.455 |
| IL-6 | 24.3 ± 6.1 | 46.8 ± 7.2 | 24.9 ± 4.1 | 27.1 ± 5.7 | 0.045 |
| IL-10 | 135.4 ± 17.6 | 172.1 ± 20.9 | 143.8 ± 14.5 | 126.7 ± 20.4 | 0.377 |
| IFN-γ | 8.3 ± 2.7 | 16.0 ± 2.5 | 9.5 ± 1.9 | 9.6 ± 2.7 | 0.190 |
| GM-CSF | 24.4 ± 2.4 | 32 ± 4.6 | 22.3 ± 3.1 | 20.2 ± 3.4 | 0.125 |
| TNF-α | 10.4 ± 1.3 | 9.2 ± 1.7 | 12.3 ± 3.2 | 7.5 ± 3.5 | 0.641 |
Data based upon at least 12 rats/group. Units for all cytokines is pg/ml.
Figure 7.
Hypo-IRAS rats provided ad lib access to food exhibit significant increases in plasma cytokine levels, increases that are prevented and reversed by food restriction. Panel A: IL-1α levels are increased in hypo-IRAS rats that develop the MetS/obesity phenotype, while hypo-IRAS Prevention rats and hypo-IRAS Reversal rats exhibit plasma IL-1α levels that are similar to hypo-Con rats [F(3,20) = 9.26, p = .0005]. Panel B: Hypo-IRAS rats exhibit a nearly two-fold increase in plasma IL-6 levels when compared to hypo-Con rats. These increases in IL-6 levels in hypo-IRAS rats were prevented when food restriction of hypo-IRAS rats was initiated on day 5 (Prevention) or when food restriction of hypo-IRAS rats was initiated on day 23 (Reversal) [F(3,20) = 5.132, p = 0.008. # = compared to hypo-Con rats; $ = compared to Prevention rats; % = compared to Reversal rats. Data expressed at a percentage of plasma cytokine levels in hypo-Con rats (see Table 1).]
Figure 8.
Obesity-induced increases in plasma C-reactive protein (CRP) levels are prevented and reversed by food restriction. Hypo-IRAS rats provided ad lib access to food exhibited the significant increases in plasma CRP levels, while hypo-IRAS Prevention rats and hypo-IRAS Reversal rats exhibited plasma leptin levels that were similar to levels observed in hypo-Con rats [F(3,20) = 3.234, p = 0.04. # = compared to hypo-Con rats; $ = compared to Prevention rats; % = compared to Reversal rats.]
4. DISCUSSION
The results of the current study identify some potential mechanistic mediators of co-morbid obesity and depression and indicate that obesity-induced anhedonia is a reversible process. Indeed, one of the more important aspects of the current study was the observation that food restriction paradigms that inhibit the development of the obesity/MetS phenotype (Prevention group) or restore body weight and adiposity to levels observed in control rats (Reversal group; [18]) effectively prevent or reverse obesity-induced decreases in sucrose intake, as well as several endocrine changes. More simply, management of body weight can prevent or reverse anhedonia induced by the obesity/MetS phenotype. Such observations have important clinical implications. As noted above, there is an association between obesity and mood disorders [1,2,5,6] and this relationship is particularly strong for individuals with a BMI greater than 40 [7]. Reductions in BMI are associated with improved depression and anxiety measure in obese patients [5,6,22,23]. Many of these studies involving bariatric surgery patients have determined that improvements in mood may occur rapidly and are maintained for extended periods following surgical intervention [24,25]. Moreover, the degree of weight loss is positively correlated with improved mood while the regaining of weight is associated with regression of mood, especially in patients that experienced the lowest percentage of initial weight loss [26]. One potential limitation associated with lifestyle interventions such as dietary restriction is that following an initial reductions, many obese individuals will return to their original body weight levels (For review, see [27]). Nonetheless, the take home message from these studies is that reductions in body weight and adiposity improves mood in patients with co-morbid depression and obesity and that these improvements appear to be correlated with the magnitude of weight loss.
In view of the metabolic and endocrine disturbances that are characteristic of obesity and MetS, as well as how these changes may impact the central nervous system, it is not surprising that there may be numerous potential mechanistic mediators in the development of co-morbid depressive illness in subjects with obesity [28]. Indeed, prior studies support an association between metabolic and endocrine parameters in the development of depressive illness in obese individuals. For example, compared to metabolically healthy participants, obese individuals with a greater number of metabolic risk factors have increased risk of developing depressive illness [29]. Changes in plasma lipid profiles is a hallmark feature of obesity/MetS and a number of studies have examined the relationship between alterations in plasma lipid profiles and the development of co-morbid depressive illness and obesity. Collectively these studies failed to reach a consensus regarding these relationships, which likely is related to differences in study designs, the patient populations examined and the interaction of a variety of covariates [30]. However, a more recent longitudinal study determined that the trajectory of increases in plasma triglyceride levels was predictive of the development of depressive symptoms in young adult participants [31]. Similar relationships have been described for leptin in that greater increases in plasma leptin levels are associated with moderate to severe depression [32]. These clinical observations are supported by preclinical studies that have identified depressive-like behaviors in obese rodents that exhibit increases in plasma leptin levels and/or decreases in leptin signaling [10-12], including our recent studies that demonstrate that hypo-IRAS rats exhibit depressive-like behaviors that are associated with elevations in plasma leptin and triglyceride levels [15-18].
Beyond leptin and triglycerides, pro-inflammatory cytokines may be important mediators in co-morbid depression and obesity. The existing literature supports the concept that inflammation is intimately involved in the pathogenesis of depression and is not merely a biomarker in some depressive illness patient populations [13,33]. Since chronic mild inflammation is a characteristic feature of obesity [34], this has led to the hypothesis that adipokines, including pro-inflammatory cytokines, may be critical factors in the pathogenesis of depression in obese subjects [35]. Excess calories/saturated fat can be stored by hypertrophy of adipocytes. Under these conditions it has been suggested that there is a switch from an anti-inflammatory to pro-inflammatory milieu of the adipose tissue which is followed by macrophage infiltration. Ultimately, this will lead to increases in pro-inflammatory cytokine release from adipose tissue [36]; a number of studies support this hypothesis. For example, a population-based study of male subjects determined that obese individuals with the most severe forms of depression also exhibit the highest levels of CRP [37]. Additional longitudinal studies support a role for CRP in comorbid depression in obese patients [38], with some studies indicating an important interaction between obesity, triglycerides and CRP [39]. More recent studies by Capuron and coworkers extended these observations to include IL-6 and TNF-α as pro-inflammatory cytokines that may serve as mechanistic mediators of depressive illness in MetS patients [40]. Interestingly, post-operative decreases in plasma adipokines (i.e. leptin, CRP, IL-6) may contribute to or be responsible for decreases in depressive symptoms in these patient populations [41,42]. The results of the current study support this hypothesis in that obesity-induced increases in IL-1α and IL-6 are prevented and reversed by the food restriction paradigms and are correlated with the prevention/reversal of obesity-induced anhedonia. Interestingly, while the anti-inflammatory adipokine adiponectin regulates anti-inflammatory/pro-inflammatory ratios, stimulates secretion of anti-inflammatory cytokines (i.e. IL-10) and also inhibits/attenuates effects of pro-inflammatory cytokines, our previous studies indicate that plasma levels of adiponectin are not modulated in hypo-IRAS rats [15]. Future studies will be required to fully address these relationships, as well as how changes in adipocytes may dysregulate pro-inflammatory and anti-inflammatory cascades.
As noted above, in the absence of an IR antagonist we developed a lentiviral vector that reduces IR expression in order to more selectively examine the functional activities of neuronal IRs. Similar to observations using different molecular approaches [43,44], lentivirus-mediated downregulation of hypothalamic IRs increases body weight and adiposity, increases plasma leptin and triglyceride levels and also elicits leptin resistance and hepatic insulin resistance [15,16,18,19]. We believe there are several advantages associated with the Hypo-IRAS model of obesity/MetS. To begin, the LV-IRAS construct, unlike the neuronal insulin receptor knockout (NIRKO) mouse [44], allows for site specific targeting of IR populations in the CNS and also produces longer lasting changes when compared to antisense oligonucleotide approaches [43]. Another advantage of our lentivirus approach is that the development of the obesity/MetS phenotype does not rely upon the use of a high fat or high sucrose diet. Moreover, the current study and our previous results [18] demonstrate that food restriction paradigms effectively reverse neuroplasticity deficits in Hypo-IRAS rats, which may be more difficult to achieve in other models of obesity/leptin resistance such as the db/db mouse and the Zucker rat. Indeed, food restricted Hypo-IRAS rats exhibit improvements in neuroplasticity that are similar to those observed in patients with comorbid depression and obesity following weight loss (see above). In addition to demonstrating that obesity-induced anhedonia is a reversible process, our study also identifies several endocrine/metabolic parameters that might mediate these neurobehavioral changes. Collectively, the Hypo-IRAS rat provides a unique model system to examine the deleterious consequences of obesity on the central nervous system, as well as the mechanistic mediators of comorbid depression and obesity.
In spite of these advantages, there may be some perceived limitations associated with this model. For example, Hypo-IRAS rats do not exhibit impairments in hypothalamic-pituitary-adrenal (HPA) axis reactivity to stress [15,17]. Since HPA axis dysfunction is a common feature of obesity and neuropsychiatric disorders, our findings that a MetS/obesity phenotype that results in depressive-like behaviors is not associated with HPA axis may be considered somewhat unexpected. However, a recent clinical study identified associations between inflammation, dyslipidemia and obesity in patients with depressive illness, but did not identify an association with HPA axis activity [45]. Therefore, these data suggest that obesity-induced anhedonia may be observed in the absence of HPA axis deficits. In addition, it could be argued that the increase in sucrose preference shown by the prevention and reversal group could be interpreted as ‘calorie seeking’ since these groups of rats were food restricted for at least six and three weeks respectively. However, we observed that food restricted rats frequently left some food in their hopper, suggesting that they were habituated to the food restriction paradigm and that their sucrose intake was not the result of seeking extra calories. In addition, the total sucrose consumption among the control and the food restricted groups was not different, suggesting that prevention and reversal groups were motivated by the consumption of a palatable solution more than trying to recover calories.
In summary, the results of the current study demonstrate that obesity-induced anhedonia is a reversible process and identifies the metabolic and inflammatory processes that may be involved in these behavioral changes. When viewed in the context of the clinical and preclinical literature, these observations further emphasize that a constellation of metabolic, endocrine and inflammatory parameters contribute to an environment that promotes the development of comorbidities in obesity and MetS, including neuropsychiatric disorders like depressive illness. As such, except perhaps under those circumstances when a single component of the endocrine/metabolic/inflammatory environment predominates [46], treatment strategies that target multiple components of the obesity/MetS milieu may be more efficacious in the treatment of co-morbid depression and obesity.
Research Highlights.
Lentivirus-mediated decreases in insulin receptors increases food intake
Hypo-IRAS rats exhibit increases in pro-inflammatory cytokines
Food restriction paradigms prevent and reverse obesity-induced anhedonia
Increases in leptin, triglycerides and cytokines are reversed by food restriction
Study identifies potential mechanistic mediators of obesity-induced anhedonia
Acknowledgements
Supported by the Department of Veterans Affairs (IO1 BX001804-01; LPR), the National Institutes of Health (RO1 MH063344; MAW) the University of South Carolina Research Foundation.
Footnotes
Publisher's Disclaimer: This is a PDF file of an unedited manuscript that has been accepted for publication. As a service to our customers we are providing this early version of the manuscript. The manuscript will undergo copyediting, typesetting, and review of the resulting proof before it is published in its final citable form. Please note that during the production process errors may be discovered which could affect the content, and all legal disclaimers that apply to the journal pertain.
References
- 1.Simon GE, Von Korff M, Saunders K, Miglioretti DL, Crane PK, van Belle G, Kessler RC. Association between obesity and psychiatric disorders in the US adult population. Arch Gen Psychiatry. 2006;63:824–30. doi: 10.1001/archpsyc.63.7.824. [DOI] [PMC free article] [PubMed] [Google Scholar]
- 2.Luppino FS, de Wit LM, Bouvy PF, Stijnen T, Cuijpers P, Penninx BW, Zitman FG. Overweight, obesity, and depression: a systematic review and meta-analysis of longitudinal studies. Arch Gen Psychiatry. 2010;67:220–229. doi: 10.1001/archgenpsychiatry.2010.2. [DOI] [PubMed] [Google Scholar]
- 3.Fabricatore AN, Wadden TA. Obesity. Annu Rev Clin Psychol. 2006;2:357–77. doi: 10.1146/annurev.clinpsy.2.022305.095249. [DOI] [PubMed] [Google Scholar]
- 4.McElroy SL, Kotwal R, Malhotra S, Nelson EB, Keck PE, Nemeroff CB. Are mood disorders and obesity related? A review for the mental health professional. J Clin Psychiatry. 2004;65:634–51. doi: 10.4088/jcp.v65n0507. quiz. [DOI] [PubMed] [Google Scholar]
- 5.Andersen JR, Aasprang A, Bergsholm P, Sletteskog N, Vage V, Natvig GK. Anxiety and depression in association with morbid obesity: changes with improved physical health after duodenal switch. Health Qual Life Outcomes. 2010;8:52. doi: 10.1186/1477-7525-8-52. [DOI] [PMC free article] [PubMed] [Google Scholar]
- 6.Stunkard AJ, Faith MS, Allison KC. Depression and obesity. Biol Psychiatry. 2003;54:330–337. doi: 10.1016/s0006-3223(03)00608-5. [DOI] [PubMed] [Google Scholar]
- 7.Onyike CU, Crum RM, Lee HB, Lyketsos CG, Eaton WW. Is obesity associated with major depression? Results from the Third National Health and Nutrition Examination Survey. Am J Epidemiol. 2003;158:1139–47. doi: 10.1093/aje/kwg275. [DOI] [PubMed] [Google Scholar]
- 8.Lu XY. The leptin hypothesis of depression: a potential link between mood disorders and obesity? Curr Opin Pharmacol. 2007;7:648–52. doi: 10.1016/j.coph.2007.10.010. [DOI] [PMC free article] [PubMed] [Google Scholar]
- 9.Lu XY, Kim CS, Frazer A, Zhang W. Leptin: a potential novel antidepressant. Proc Natl Acad Sci U S A. 2006;103:1593–98. doi: 10.1073/pnas.0508901103. [DOI] [PMC free article] [PubMed] [Google Scholar]
- 10.Collin M, Hakansson-Ovesjo ML, Misane I, Ogren SO, Meister B. Decreased 5-HT transporter mRNA in neurons of the dorsal raphe nucleus and behavioral depression in the obese leptin-deficient ob/ob mouse. Brain Res Mol Brain Res. 2000;81:51–61. doi: 10.1016/s0169-328x(00)00167-4. [DOI] [PubMed] [Google Scholar]
- 11.Yamada N, Katsuura G, Ochi Y, Ebihara K, Kusakabe T, Hosoda K, Nakao K. Impaired CNS leptin action is implicated in depression associated with obesity. Endocrinology. 2011;152:2634–43. doi: 10.1210/en.2011-0004. [DOI] [PubMed] [Google Scholar]
- 12.Sharma AN, Elased KM, Garrett TL, Lucot JB. Neurobehavioral deficits in db/db diabetic mice. Physiol Behav. 2010;101:381–88. doi: 10.1016/j.physbeh.2010.07.002. [DOI] [PMC free article] [PubMed] [Google Scholar]
- 13.Raison CL, Capuron L, Miller AH. Cytokines sing the blues: inflammation and the pathogenesis of depression. Trends Immunol. 2006;27:24–31. doi: 10.1016/j.it.2005.11.006. [DOI] [PMC free article] [PubMed] [Google Scholar]
- 14.Capuron L, Miller AH. Immune system to brain signaling: neuropsychopharmacological implications. Pharmacol Ther. 2011;130:226–38. doi: 10.1016/j.pharmthera.2011.01.014. [DOI] [PMC free article] [PubMed] [Google Scholar]
- 15.Grillo CA, Tamashiro KL, Piroli GG, Melhorn S, Gass JT, Newsom RJ, Reznikov LR, Smith A, Wilson SP, Sakai RR, Reagan LP. Lentivirus-mediated downregulation of hypothalamic insulin receptor expression. Physiol Behav. 2007;92:691–701. doi: 10.1016/j.physbeh.2007.05.043. [DOI] [PMC free article] [PubMed] [Google Scholar]
- 16.Grillo CA, Piroli GG, Junor L, Wilson SP, Mott DD, Wilson MA, Reagan LP. Obesity/hyperleptinemic phenotype impairs structural and functional plasticity in the rat hippocampus. Physiol Behav. 2011;105:138–44. doi: 10.1016/j.physbeh.2011.02.028. [DOI] [PMC free article] [PubMed] [Google Scholar]
- 17.Grillo CA, Piroli GG, Kaigler KF, Wilson SP, Wilson MA, Reagan LP. Downregulation of hypothalamic insulin receptor expression elicits depressive-like behaviors in rats. Behav Brain Res. 2011;222:230–235. doi: 10.1016/j.bbr.2011.03.052. [DOI] [PMC free article] [PubMed] [Google Scholar]
- 18.Grillo CA, Piroli GG, Evans AN, Macht VA, Wilson SP, Scott KA, Sakai RR, Mott DD, Reagan LP. Obesity/hyperleptinemic phenotype adversely affects hippocampal plasticity: Effects of dietary restriction. Physiol Behav. 2011;104:235–41. doi: 10.1016/j.physbeh.2010.10.020. [DOI] [PMC free article] [PubMed] [Google Scholar]
- 19.Paranjape SA, Chan O, Zhu W, Horblitt AM, Grillo C, Wilson S, Reagan L, Sherwin RS. Chronic reductions of insulin receptors in the ventromedial hypothalamus produces glucose intolerance and islet dysfunction in the absence of weight gain. Am J Physiol. 2011;301:E978–E983. doi: 10.1152/ajpendo.00304.2011. [DOI] [PMC free article] [PubMed] [Google Scholar]
- 20.Zhao W, Chen H, Moore E, Meiri N, Quon MJ, Alkon DL. Brain insulin receptors and spatial memory. J Biol Chem. 1999;274:34893–902. doi: 10.1074/jbc.274.49.34893. [DOI] [PubMed] [Google Scholar]
- 21.Zhao WQ, Alkon DL. Role of insulin and insulin receptor in learning and memory. Mol Cell Endocrinol. 2001;177:125–34. doi: 10.1016/s0303-7207(01)00455-5. [DOI] [PubMed] [Google Scholar]
- 22.Dixon JB, Dixon ME, O'Brien PE. Depression in association with severe obesity: changes with weight loss. Arch Intern Med. 2003;163:2058–65. doi: 10.1001/archinte.163.17.2058. [DOI] [PubMed] [Google Scholar]
- 23.Faulconbridge LF, Wadden TA, Berkowitz RI, Sarwer DB, Womble LG, Hesson LA, Stunkard AJ, Fabricatore AN. Changes in symptoms of depression with weight loss: results of a randomized trial. Obesity (Silver Spring) 2009;17:1009–16. doi: 10.1038/oby.2008.647. [DOI] [PMC free article] [PubMed] [Google Scholar]
- 24.Dymek MP, Le Grange D, Neven K, Alverdy J. Quality of life after gastric bypass surgery: a cross-sectional study. Obes Res. 2002;10:1135–42. doi: 10.1038/oby.2002.154. [DOI] [PubMed] [Google Scholar]
- 25.de Zwaan M, Enderle J, Wagner S, Muhlhans B, Ditzen B, Gefeller O, Mitchell JE, Muller A. Anxiety and depression in bariatric surgery patients: a prospective, follow-up study using structured clinical interviews. J Affect Disord. 2011;133:61–68. doi: 10.1016/j.jad.2011.03.025. [DOI] [PubMed] [Google Scholar]
- 26.Karlsson J, Taft C, Ryden A, Sjostrom L, Sullivan M. Ten-year trends in health-related quality of life after surgical and conventional treatment for severe obesity: the SOS intervention study. Int J Obes (Lond) 2007;31:1248–61. doi: 10.1038/sj.ijo.0803573. [DOI] [PubMed] [Google Scholar]
- 27.Wadden TA, Berkowitz RI, Womble LG, Sarwer DB, Phelan S, Cato RK, Hesson LA, Osei SY, Kaplan R, Stunkard AJ. Randomized trial of lifestyle modification and pharmacotherapy for obesity. N Engl J Med. 2005;353:2111–20. doi: 10.1056/NEJMoa050156. [DOI] [PubMed] [Google Scholar]
- 28.Reagan LP. Diabetes as a chronic metabolic stressor: Causes, consequences and clinical complications. Exp Neurol. 2011 doi: 10.1016/j.expneurol.2011.02.004. [DOI] [PMC free article] [PubMed] [Google Scholar]
- 29.Hamer M, Batty GD, Kivimaki M. Risk of future depression in people who are obese but metabolically healthy: the English longitudinal study of ageing. Mol Psychiatry. 2012;17:940–945. doi: 10.1038/mp.2012.30. [DOI] [PMC free article] [PubMed] [Google Scholar]
- 30.Reedt Dortland AK, Giltay EJ, van Veen T, van Pelt J, Zitman FG, Penninx BW. Associations between serum lipids and major depressive disorder: results from the Netherlands Study of Depression and Anxiety (NESDA). J Clin Psychiatry. 2010;71:729–36. doi: 10.4088/JCP.08m04865blu. [DOI] [PubMed] [Google Scholar]
- 31.Elovainio M, Pulkki-Raback L, Kivimaki M, Jokela M, Viikari J, Raitakari OT, Telama R, Keltikangas-Jarvinen L. Lipid trajectories as predictors of depressive symptoms: the Young Finns Study. Health Psychol. 2010;29:237–45. doi: 10.1037/a0018875. [DOI] [PMC free article] [PubMed] [Google Scholar]
- 32.Morris AA, Ahmed Y, Stoyanova N, Hooper WC, De Staerke C, Gibbons G, Quyyumi A, Vaccarino V. The association between depression and leptin is mediated by adiposity. Psychosom Med. 2012;74:483–88. doi: 10.1097/PSY.0b013e31824f5de0. [DOI] [PMC free article] [PubMed] [Google Scholar]
- 33.Dantzer R. Cytokine, sickness behavior, and depression. Neurol Clin. 2006;24:441–60. doi: 10.1016/j.ncl.2006.03.003. [DOI] [PMC free article] [PubMed] [Google Scholar]
- 34.Lumeng CN, Saltiel AR. Inflammatory links between obesity and metabolic disease. J Clin Invest. 2011;121:2111–17. doi: 10.1172/JCI57132. [DOI] [PMC free article] [PubMed] [Google Scholar]
- 35.Soczynska JK, Kennedy SH, Woldeyohannes HO, Liauw SS, Alsuwaidan M, Yim CY, McIntyre RS. Mood disorders and obesity: understanding inflammation as a pathophysiological nexus. Neuromolecular Med. 2011;13:93–116. doi: 10.1007/s12017-010-8140-8. [DOI] [PubMed] [Google Scholar]
- 36.Shelton RC, Miller AH. Eating ourselves to death (and despair): the contribution of adiposity and inflammation to depression. Prog Neurobiol. 2010;91:275–99. doi: 10.1016/j.pneurobio.2010.04.004. [DOI] [PMC free article] [PubMed] [Google Scholar]
- 37.Ladwig KH, Marten-Mittag B, Lowel H, Doring A, Koenig W. Influence of depressive mood on the association of CRP and obesity in 3205 middle aged healthy men. Brain Behav Immun. 2003;17:268–75. doi: 10.1016/s0889-1591(03)00056-4. [DOI] [PubMed] [Google Scholar]
- 38.Daly M. The relationship of C-reactive protein to obesity-related depressive symptoms: A longitudinal study. Obesity (Silver Spring) 2013;21:248–50. doi: 10.1002/oby.20051. [DOI] [PubMed] [Google Scholar]
- 39.Elovainio M, Keltikangas-Jarvinen L, Pulkki-Raback L, Kivimaki M, Puttonen S, Viikari L, Rasanen L, Mansikkaniemi K, Viikari J, Raitakari OT. Depressive symptoms and C-reactive protein: the Cardiovascular Risk in Young Finns Study. Psychol Med. 2006;36:797–805. doi: 10.1017/S0033291706007574. [DOI] [PubMed] [Google Scholar]
- 40.Capuron L, Su S, Miller AH, Bremner JD, Goldberg J, Vogt GJ, Maisano C, Jones L, Murrah NV, Vaccarino V. Depressive symptoms and metabolic syndrome: is inflammation the underlying link? Biol Psychiatry. 2008;64:896–900. doi: 10.1016/j.biopsych.2008.05.019. [DOI] [PMC free article] [PubMed] [Google Scholar]
- 41.Emery CF, Fondow MD, Schneider CM, Christofi FL, Hunt C, Busby AK, Needleman BJ, Melvin WS, Elsayed-Awad HM. Gastric bypass surgery is associated with reduced inflammation and less depression: a preliminary investigation. Obes Surg. 2007;17:759–63. doi: 10.1007/s11695-007-9140-0. [DOI] [PubMed] [Google Scholar]
- 42.Capuron L, Poitou C, Machaux-Tholliez D, Frochot V, Bouillot JL, Basdevant A, Laye S, Clement K. Relationship between adiposity, emotional status and eating behaviour in obese women: role of inflammation. Psychol Med. 2011;41:1517–28. doi: 10.1017/S0033291710001984. [DOI] [PubMed] [Google Scholar]
- 43.Obici S, Feng Z, Karkanias G, Baskin DG, Rossetti L. Decreasing hypothalamic insulin receptors causes hyperphagia and insulin resistance in rats. Nat Neurosci. 2002;5:566–72. doi: 10.1038/nn0602-861. [DOI] [PubMed] [Google Scholar]
- 44.Bruning JC, Gautam D, Burks DJ, Gillette J, Schubert M, Orban PC, Klein R, Krone W, Muller-Wieland D, Kahn CR. Role of brain insulin receptor in control of body weight and reproduction. Science. 2000;289:2122–25. doi: 10.1126/science.289.5487.2122. [DOI] [PubMed] [Google Scholar]
- 45.Reedt Dortland AK, Vreeburg SA, Giltay EJ, Licht CM, Vogelzangs N, van Veen T, de Geus EJ, Penninx BW, Zitman FG. The impact of stress systems and lifestyle on dyslipidemia and obesity in anxiety and depression. Psychoneuroendocrinology. 2013;38:209–18. doi: 10.1016/j.psyneuen.2012.05.017. [DOI] [PubMed] [Google Scholar]
- 46.Raison CL, Rutherford RE, Woolwine BJ, Shuo C, Schettler P, Drake DF, Haroon E, Miller AH. A randomized controlled trial of the tumor necrosis factor antagonist infliximab for treatment-resistant depression: the role of baseline inflammatory biomarkers. JAMA Psychiatry. 2013;70:31–41. doi: 10.1001/2013.jamapsychiatry.4. [DOI] [PMC free article] [PubMed] [Google Scholar]


