Abstract
The 53 kDa insulin receptor substrate protein (IRSp53) is highly enriched in the brain. Despite evidence that links mutations of IRSp53 with autism and other neuropsychiatric problems, the functional significance of this protein remains unclear. We here use light and electron microscopic immunohistochemistry to demonstrate that IRSp53 is expressed throughout the adult rat brain. Labeling concentrated selectively in dendritic spines, where it was associated with the postsynaptic density. Surprisingly, its organization within the PSD of spiny excitatory neurons of neocortex and hippocampus differed from that within spiny inhibitory neurons of neostriatum and cerebellar cortex. The present data support previous suggestions that IRSp53 is involved in postsynaptic signaling, while hinting that its signaling role may differ in different types of neurons.
Keywords: dendritic spine, PSD, BAIAP2, Rho GTPase, GABAergic neurons
IRSp53 (Insulin Receptor Substrate p53; also known as BAIAP2, Brain-specific Angiogenesis Inhibitor 1-Associated Protein 2) concentrates in the brain, where it has been identified as a component of the biochemically-defined postsynaptic density fraction (Abbott et al., 1999). IRSp53 is a member of the I-BAR group of BAR (Bin-Amphiphysin-Rvs) domain proteins, which can sense or induce membrane curvature (Zhao et al., 2011). IRSp53 also acts as a signaling platform for Rho-GTPases (Choi et al., 2005; Oda et al., 1999; Yeh et al., 1996). Thus, IRSp53 may serve as a physical linker between the plasma membrane and the actin cytoskeleton (Scita et al., 2008).
Certain IRSp53 alleles in humans have been linked to neurological problems such as attention-deficit/hyperactivity disorder, Gilles de la Tourette syndrome, and autism (Paschou et al., 2004; Ribases et al., 2009; Toma et al., 2011), and its expression is selectively decreased in Alzheimer’s disease (Zhou et al., 2013), but its function in neurons remains unclear. In fibroblasts, IRSp53 has been shown to regulate Rac-dependent lamellipodia formation (Miki et al., 2000) and Cdc42-dependent filopodia formation (Govind et al., 2001; Krugmann et al., 2001; Lim et al., 2008; Nakagawa et al., 2003; Yamagishi et al., 2004). These observations led to the hypothesis that IRSp53 might play a key role in dendritic spines, whose morphology is controlled by their actin cytoskeleton. Accordingly, IRSp53 overexpression in cultured hippocampal neurons increases spine density, while acute knockdown (or dominant-negative inhibition) of IRSp53 decreases both the density and size of dendritic spines (Choi et al., 2005). Surprisingly, however, no significant changes in the density or ultrastructure of dendritic spines were detected in mice lacking IRSp53 (Kim et al., 2009; Sawallisch et al., 2009), presumably reflecting the effects of compensatory mechanisms in the intact animal. Nevertheless, spatial learning, novel object recognition, and contextual fear-conditioning were impaired in IRSp53 knockout mice (Kim et al., 2009; Sawallisch et al., 2009).
To gain further insight into possible functions of IRSp53 in neurons, we have studied its regional, cellular, and subcellular localization in the brain of the adult rat. We here show that IRSp53 is expressed throughout the brain, concentrating in dendritic spines, where it is closely associated with the PSD. While IRSp53 displayed a strong association with the PSD in spine-rich neurons from multiple brain regions, its organization within the synapses of spiny excitatory neurons of neocortex and hippocampus differed from that within spiny inhibitory neurons of neostriatum and cerebellar cortex, demonstrating intriguing organizational differences between PSDs in excitatory and inhibitory cells.
MATERIALS AND METHODS
13 male Sprague-Dawley rats (200–350 g, Charles River, Raleigh, NC, 5 for LM, 3 for GABA immunofluorescence and pre-embedding immunogold, and 5 for postembedding immunogold) were used for this study. All procedures related to the care and treatment of animals were in accordance with institutional and NIH guidelines; all animals use protocols were reviewed and approved by the relevant Institutional Animal Care and Use Committee.
Antibody specificity
Table 1 provides a list of primary antibodies used in this study.
Table 1.
Primary Antibodies
| Antigen | Immunogen | Source | Dilution |
|---|---|---|---|
| IRSp53 | Full-length IRSp53 (aa 1-521, H6-IRSp53) | Choi et al., 2005 | 1:500 |
| GABA | GABA coupled to BSA with glutaraldehyde. | Millipore (Billerica, MA), clone 5A9, cat. # MAB316, lot # 2080836 | 1:5,000 for LM 1:500 for EM |
To detect IRSp53, we generated rabbit polyclonal antibodies against the full-length human protein (aa 1-521, H6-IRSp53) (Choi et al., 2005). This antibody recognizes the two major IRSp53 bands previously reported (Abbott et al., 1999) (migrating on immunoblot at apparent molecular weights of ~58 and ~53 kDa) in brain samples from wild-type mice, but not from IRSp53-knockout mice. Since the primary antibody was affinity-purified, pre-adsorption would not be informative. To verify method specificity for postembedding immunogold, we performed experiments in which primary antibody was omitted, verifying that immunogold was nearly absent (no more than 2–4 particles/grid square); additionally, we performed experiments in which primary antibody was replaced with normal rabbit serum (see Results).
To identify GABAergic synapses, we use a mouse monoclonal antibody raised against GABA conjugated to BSA (clone 5A9, cat. # MAB316, lot # 2080836, Millipore Corporation, Billerica, MA). This antibody does not cross-react with other amino acids.
Tissue preparation
After inducing deep anesthesia with sodium pentobarbital (60 mg/kg, i.p.), rats were intracardially perfused with 500 ml of fixative: 4% freshly-depolymerized paraformaldehyde in phosphate buffer (PB, 0.1 M, pH 7.4), for LM; a mixture of 4% paraformaldehyde and 0.1% glutaraldehyde in PB, for LM labeling with GABA and pre-embedding EM; or a mixture of 2% paraformaldehyde and 2% glutaraldehyde in PB, for postembedding EM. Brains were sectioned at 50 μm and 100 μm on a Vibratome, and collected in cold PB.
Light microscopy
Free-floating sections were permeabilized with 50% ethanol (in PB) for 30 min, and then incubated in 10% normal donkey serum (NDS). The primary antibody (IRSp53, 1:500) was then applied overnight. For immunoperoxidase microscopy, sections were then incubated for 3 hours in biotinylated secondary antibody (1:200; Jackson ImmunoResearch, West Grove, PA) and for 1 hour in ExtrAvidin-peroxidase complex (1:5,000; Sigma, St. Louis, MO); peroxidase was histochemically visualized with nickel-intensified diaminobenzidine. Processed sections were mounted on gelatin-coated slides, air dried, and cleared with xylene before being coverslipped with D.P.X. mountant (BDH Chemicals, Poole, England).
For immunofluorescence microscopy, antigenic sites were visualized with donkey IgG conjugated to Cy3 (1:200, Jackson ImmunoResearch; West Grove, PA). For double labeling, the second primary antibody (1:5,000, mouse anti-GABA) was applied overnight and visualized by a secondary antibody conjugated to Cy5 (1:200, Jackson ImmunoResearch) or Alexa 488 (1:200, Invitrogen). Some sections were then counterstained with with NeuroTrace 500/525 (Invitrogen) to selectively visualize neuronal somata. Control experiments, in which the primary antibodies were omitted, were performed to control for nonspecific binding of the secondary antibody. Sections were examined with a Leitz DMR microscope (Leica, Wetzlar, Germany) and a Leica SP2 confocal microscope. Brightfield and fluorescence large scale images were acquired on a Nikon Eclipse 80i microscope equipped with a Surveyor/Turboscan automated tiling and imaging system for large area acquisition (Objective Imaging Ltd., Cambridge, UK) and Retiga EXi color CCD camera (Qimaging, Surrey, Canada) as the detector.
Electron microscopy
For pre-embedding, free-floating sections were incubated in 1% NaBH4 for 15 minutes (to quench free aldehyde groups), and 1.5% hydrogen peroxide for ten minutes (to quench endogenous peroxidases). After blocking for 20 minutes in 10% normal donkey serum (NDS), sections were incubated in primary antibody (IRSp53, 1:500) overnight. For pre-embedding immunoperoxidase staining, sections were then incubated for 3 hours in biotinylated secondary antibody (1:200–1:500; Jackson ImmunoResearch, West Grove, PA) and for 1 hour in ExtrAvidin-peroxidase complex (1:5,000; Sigma, St. Louis, MO); peroxidase was histochemically visualized using a standard DAB-nickel method (Shu et al., 1988).
For preembedding gold, sections were then incubated with biotinylated donkey-anti rabbit IgG (1:200, Jackson ImmunoResearch), followed by 1.4 nm gold particles conjugated to streptavidin (1:100; Nanoprobes, Yaphank, NY). Sections were washed in 0.01 M Na acetate (to remove phosphate and chloride ions), followed by silver enhancement with IntenSE-M (Amersham Biosciences). Sections were then post-fixed in 0.5% osmium tetroxide in 0.1 M PB for 30–45 min and incubated with 1% uranyl acetate in maleate buffer (0.1 M, pH 6.0) for 45 min. After dehydration, sections were infiltrated with Spurr’s resin (Electron Microscopy Sciences, Hatfield, PA) and flat-mounted between sheets of ACLAR® fluoropolymer (Electron Microscopy Sciences, Hatfield, PA) within glass slides. Sixty-nanometer sections were cut, mounted on 200 mesh copper grids, and contrasted with uranyl acetate and Sato’s lead.
For postembedding, 100 μm sections were pre-treated in 0.1% calcium chloride in 0.1 M sodium acetate, rinsed, then cryoprotected in a graded series to 30% glycerol in 0.1 M sodium acetate. Sections were quick-frozen in methanol chilled with dry ice. Freeze substitution in 4% uranyl acetate in methanol was carried out in a Leica Automatic Freeze Substitution System; after rinsing in methanol, section were infiltrated with Lowicryl HM-20, mounted between sheets of ACLAR supported by pieces of glass slide, and polymerized with ultraviolet light. After polymerization, regions of interested were cut from the sections and glued to plastic blocks. Sections were cut at ~70–90 nm with an ultramicrotome and collected on nickel grids, coated with Coat-Quick. Grids were pre-treated 15 mins at 60 °C in 0.01 M citrate buffer, pH 6, rinsed in water, blocked in 1% BSA in TRIS-buffered saline with 0.005% Tergitol NP-10, then incubated overnight at 21–24 °C with the primary antibody (IRSp53, 1:200 or a mixture of IRSp53, 1:200 and GABA, 1:500). Grids were rinsed, blocked in 1% normal goat serum, and incubated in goat antibody to rabbit IgG F(ab)2 conjugated to 10-nm gold particles (1:20, Ted Pella, Redding, CA) or a mixture of goat antibody to mouse IgG F(ab)2 conjugated to 10-nm and goat antibody to rabbit IgG conjugated to 20-nm gold particles (1:20, Ted Pella). Grids were then rinsed and counterstained with 1% uranyl acetate, followed by Sato’s lead.
Image analysis
To evaluate the distribution of labeling in different tissue compartments, we first collected random EM photomontages (each ~ 10 × 10 μm) from neuropil of the stratum radiatum from CA1 hippocampus. Using ImageJ, we outlined all identifiable spines, PSDs, presynaptic terminals, mitochondria, and dendritic shafts. Since these were from single sections, many profiles (especially neuroglia and small axons and dendrites) could not be unambiguously identified, and were grouped as “other. To assess how much of the immunogold labeling might represent noise rather than authentic IRSp53 protein, we examined immunogold-processed material in which primary antibody had been replaced with normal rabbit serum. As above, we collected random photomontages (each ~ 10 × 10 μm) from neuropil of the stratum radiatum from CA1 hippocampus, again outlining all identifiable spines, PSDs, presynaptic terminals, mitochondria, and dendritic shafts. To compare labeling in GABA-positive and GABA-negative synapses in the different regions studied, we performed double-labeling and counted all synapses from ten random photomontages (each ~ 10 × 10 μm) collected from each of neocortex, hippocampus, striatum, and cerebellum.
To investigate the organization of immunogold label associated with the PSD of asymmetric synapses, we took measurements from 35–40 immunolabeled synapses for each of the four brain regions studied, from each of three animals. For quantitative analysis of immunogold particles at synapses we used ImageJ (Schneider et al., 2012). To define “axodendritic” position, the distance between the center of each gold particle and the outer leaflet of the postsynaptic membrane was measured. To define the “lateral” synaptic position of a gold particle, we measured the distance from each end of the PSD to a line drawn perpendicular to the synapse running through the center of the particle (Valtschanoff and Weinberg, 2001). Normalized lateral position of each gold particle within the axodendritic peak (from −10 nm to +50 nm from the postsynaptic membrane) was computed as LN = |(a−b)|/|(a+b)|, where a and b are tangential distances along the plasma membrane from the center of the gold particle to the lateral edges of the synaptic specialization; thus LN = 0 for gold particles at the center of the PSD, and LN = 1 for particles at its edge.
RESULTS
General distribution of IRSp53
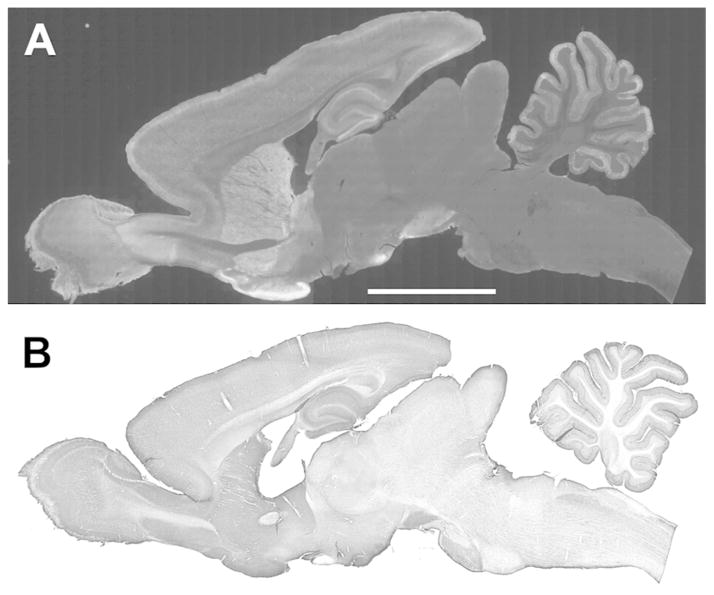
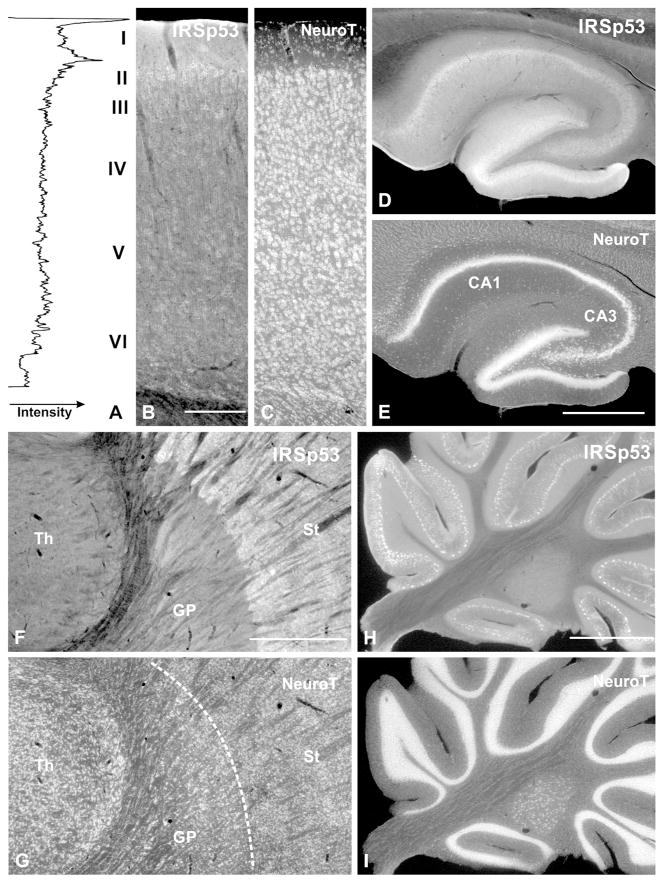
IRSp53 protein was detected throughout the rat brain, largely confined to gray matter (Fig. 1). IRSp53 staining was strongest in the olfactory tubercle and lateral hypothalamus. It was also prominent in olfactory bulb, neocortex, hippocampus, caudoputamen, nucleus accumbens, and substantia nigra (Fig. 1). IRSp53 staining was much weaker in globus pallidus, thalamus, and caudal brain stem. Because we wanted to explore the relationship of IRSp53 to dendritic spines, we focused our attention on spine-rich regions of the brain.
Figure 1.
Immunofluorescence (A) and immunoperoxidase (B) staining for IRSp53 in parasagittal sections of the rat brain. Staining is strong in regions rich in spiny neurons, including neocortex, hippocampus, striatum, and cerebellar cortex.
Scale bar = 0.5 cm
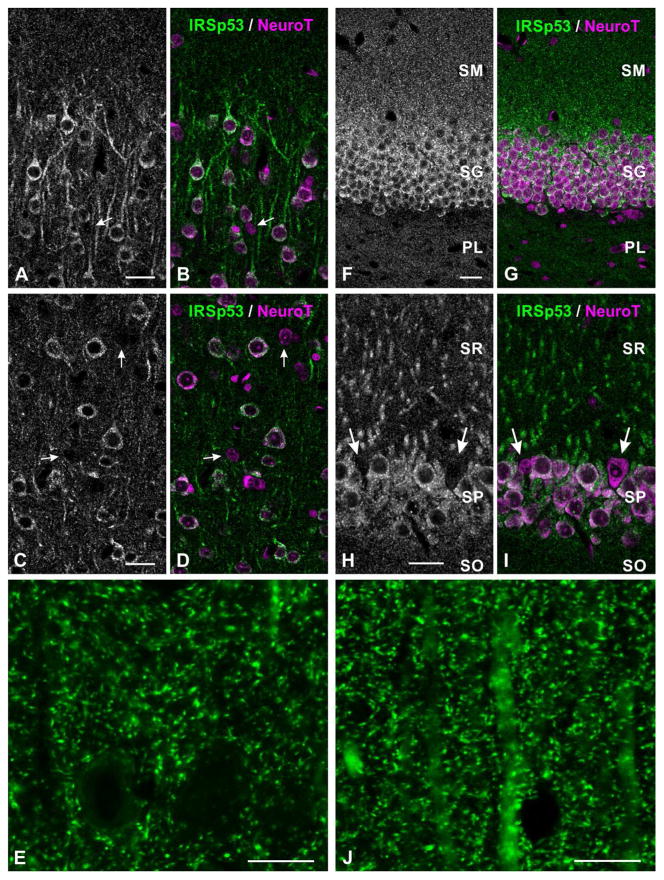
In the neocortex, staining extended through all layers (Fig. 2A). IRSp53 was detected in somata and dendrites, and in small puncta throughout the neuropil (Figs. 3A–E). The somato-dendritic staining was most prominent in superficial layer II, while punctate staining was strongest in layer I. While some of the neuropil staining was clearly in large dendrites, much of it was in processes too small for accurate identification. Counterstaining with NeuroTrace (a fluorescent Nissl stain) showed that while the majority of neuronal somata were immunopositive, a scattered subpopulation of small somata exhibited little or no staining (arrows in Fig. 3A–D). Our suspicion that these might represent inhibitory interneurons was confirmed by double labeling with GABA, which showed that GABA-positive somata were negative for IRSP53 (arrows in Fig. 4A, B).
Figure 2.
Immunofluorescence labeling for IRSp53 in coronal sections. A–C, neocortex (S1); D–E, hippocampus; F–G, basal ganglia and thalamus; H–I, cerebellum. The sections illustrated were also stained with NeuroTrace to identify anatomical features (C, E, G, I). Fluorometric plot (left panel in A) provides a quantitative view of the dense immunostaining at the superficial border of cortical layer II. Neuropil of layer I is strongly immunopositive, but the “peak” at the top of the section is an edge artifact.
Abbreviations: Th: thalamus, GP: globus pallidus, St: striatum, NeuroT: NeuroTrace
Scale bar = 0.5 mm in A–C; 1 mm in D–I.
Figure 3.
Immunofluorescence labeling for IRSp53 in neocortex (A–B, layer II; C–E, layer V) and hippocampus (F, G, dentate gyrus; H–J, CA1). Green channel, IRSp53; red channel, NeuroTrace. Scattered small neurons are immunonegative for IRSp53 (white arrows in A–D, H–I).
Abbreviations: SM: stratum moleculare, SG: stratum granulosum, PL: polymorphic layer; SR: stratum radiatum, SP: pyramidal cell layer, SO: stratum oriens, NeuroT: NeuroTrace
Scale bar = 25 μm in A–D, F–I; 10 μm in E, J.
Figure 4.
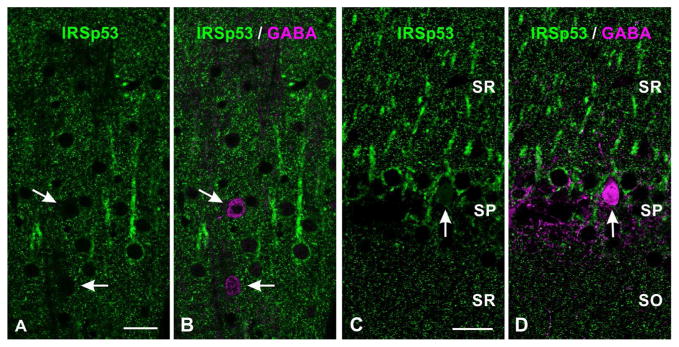
Double labeling for IRSp53 and GABA in neocortex (A, B, layer V), and hippocampus (C, D, CA1 field). Scattered GABAergic somata (white arrows) are immunonegative for IRSp53.
Abbreviations: SR: stratum radiatum, SP: pyramidal cell layer, SO: stratum oriens.
Scale bar = 25 μm in A–D.
In the hippocampus, IRSp53 staining was strongest in the dentate gyrus and the CA1 region of Ammon’s horn, followed by CA2 and CA3 (Fig. 2D, E). In the dentate gyrus, staining was strongest in somata of stratum granulosum and in small puncta in the stratum moleculare (Fig. 3F, G). Staining in CA1-3 was found in the somata and apical dendrites of pyramidal neurons (Fig. 3H, I). Punctate staining was present throughout the neuropil in both stratum radiatum and stratum oriens (Fig. 3H, J). As in the neocortex, GABAergic somata were immunonegative for IRSp53 (Fig. 4C, D)
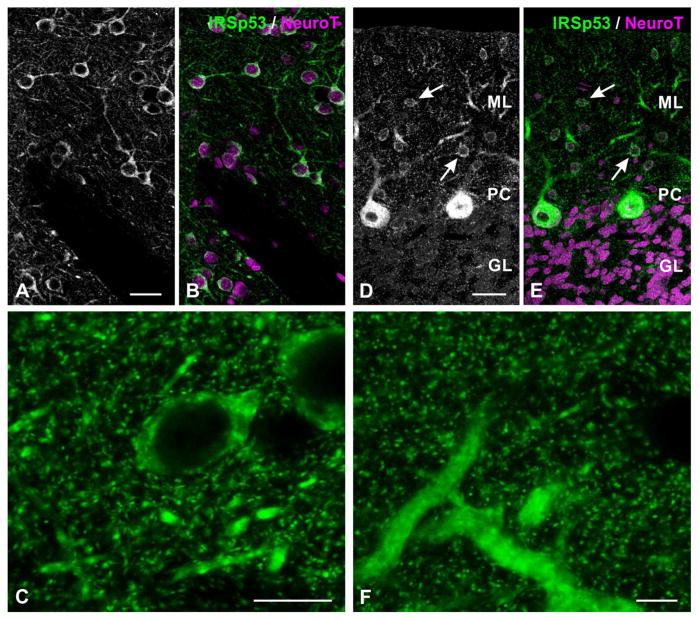
Staining in both neocortex and hippocampus was excluded from GABAergic neurons. However, GABAergic neurons are aspiny or sparsely spiny in these structures, leading us to wonder whether IRSp53 is selectively associated with excitatory neurons, or instead with spiny neurons per se, regardless of their neurotransmitter. To test this, we studied striatum and cerebellar cortex, whose principal cells are richly-spiny GABAergic neurons. In the caudoputamen, IRSp53 staining was prominent in gray matter between fascicles of myelinated fibers, which themselves were devoid of staining (Fig. 2F, G). Staining was strong in somata and dendrites of cells likely for their number, size, and distribution to be medium spiny neurons, and also in numerous puncta in the neuropil (Fig. 5A–C); double-labeling with GABA confirmed the identity of these cells (data not shown).
Figure 5.
Immunofluorescence labeling for IRSp53 in neostriatum (A–C), and cerebellar cortex (D–F). White arrows in D, E point to weakly-immunopositive interneurons in the molecular layer.
Abbreviations: ML: molecular layer; PC: Purkinje cell layer, GL: granule cell layer.
Scale bar = 25 μm in A, B, D, E; 10 μm in C, F.
In the cerebellum, IRSp53 staining concentrated in the cortex. Only weak staining was found in the deep nuclei (Fig. 2H, I), and little or no staining was found in the white matter. Within cerebellar cortex, scatted small somata in the molecular layer (likely to represent local circuit neurons) were positive; especially in rostral folia. The somata and large proximal dendrites of Purkinje cells were intensely stained (Fig. 2H, 5D, E). Immunopositive puncta were found in both the molecular and granule cell layers (Fig. 5D–F).
In summary, IRSp53 was present throughout the brain, most prominently in regions rich in dendritic spines. At the cellular level, it concentrated mainly in spiny excitatory and inhibitory principal neurons.
Subcellular organization
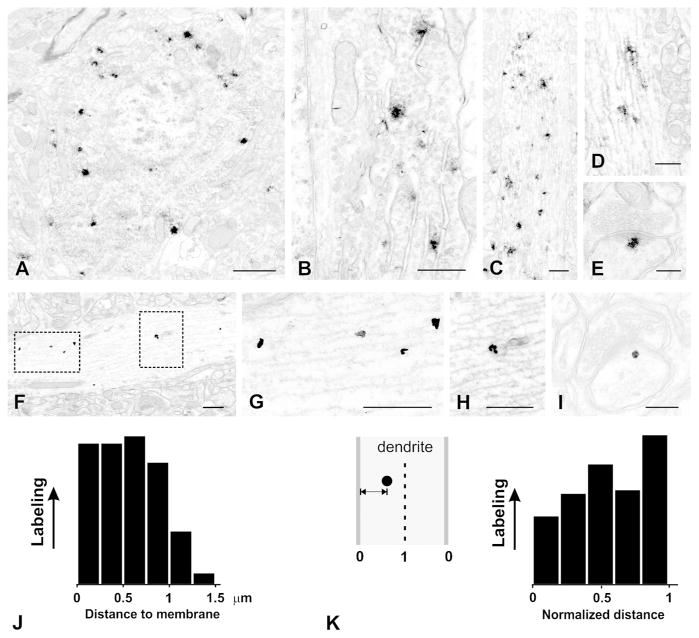
We used electron microscopy to examine the subcellular location of IRSp53. Immunostaining with DAB revealed small dark patches of label in the soma-dendritic compartment (Fig. 6A–D). In somata, label was often associated with the Golgi apparatus; in dendritic shafts, it seemed to associate with microtubules. Patches of labeling were occasionally found in dendritic spines, in some cases associated with the PSD (Fig. 6E). Staining was not seen in myelinated fibers.
Figure 6.
Electron micrographs of pre-embedding labeling for IRSp53. All images are from layers II–III of S1 neocortex; A–E are from immunoperoxidase material; F–I are from silver-enhanced nanogold. A, patches of nickel-intensified DAB immunoreaction in the soma of a small pyramidal cell. Label is in cytoplasm, excluded from nucleus. B, higher magnification image from another cell shows reaction product associated with rough endoplasmic reticulum and Golgi apparatus. C, large proximal dendrite contains numerous patches of immunoreaction. D, immunoreaction is associated with microtubules in a thin dendritic shaft. E, small patch of immunoreaction at the cytoplasmic fringe of the PSD of a dendritic spine. F, pre-embedding silver-enhanced immunogold shows immunolabel associated with microtubules (boxed area on left, enlarged in G) and with tubulovesicular structures (boxed area on right, enlarged in H). I, high-magnification image shows silver-enhanced gold particle lying close to the PSD in a small dendritic spine. J, histogram shows distance of gold particles to the plasma membrane (N = 161 particles from ten micrographs of randomly-selected dendritic shafts). K, histogram shows the same data, replotted to show “normalized distance” such that 0 corresponds to membrane, and 1 to center of dendrite (see inset on left).
Scale bar = 1 μm in A; 500 nm in B, C, D; 200 nm in E, 500 nm in F, G, H; 200 nm in I.
To get a clearer understanding of the relationship of IRSp53 to intracellular organelles, we examined material processed for pre-embedding immunogold labeling, followed by silver intensification (Fig. 6F–I). Intracellular labeling was observed in somata, where particles were associated with rough endoplasmic reticulum and Golgi apparatus; and large dendritic shafts, where it was typically associated with microtubules (Fig. 6F, G) and also with poorly-defined tubulo-vesicular endomembranous structures (Fig. 6H). Gold/silver particles labeled dendritic spines, but were rarely encountered in preterminal axon segments or in synapses likely for their morphology to be inhibitory. In contrast to the pattern in dendritic shafts, labeling in spines often lay near the plasma membrane (Fig. 6I).
To verify our impression that labeling in dendrites was predominantly intracellular, we measured the position of 161 gold particles from randomly-selected dendrites, taken from ten low-magnification photomontages of neuropil (14 × 14 μm), in relationship to the plasma membrane (Fig. 6J). Particles in dendritic shafts seemed fairly uniformly distributed within a band ~0.7 μm from the membrane. However, this histogram might be misleading, since the data were drawn from dendrites of various diameters. Accordingly, we normalized the particle distribution, such that 0 corresponded to a particle touching the membrane, and 1 to a particle lying in the center of the dendrite. This analysis confirmed that IRSp53 in dendrites had no clear affinity for the plasma membrane (Fig. 6K).
We used postembedding immunogold labeling to avoid problems of differential antibody access; though less sensitive than pre-embedding methods, postembedding immunogold is generally considered to provide an unbiased estimate of antigen distribution. As with pre-embedding, postembedding gold labeled dendrites and somata, but was seldom detected over axons. However, labeling in spines was more common than with pre-embedding methods; this spine labeling was mainly associated with the PSD (Fig. 7), consistent with published biochemical data that IRSp53 concentrates at the PSD.
Figure 7.
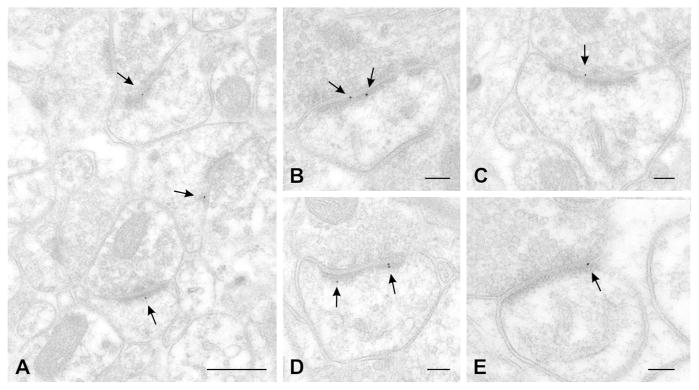
Postembedding labeling for IRSp53 (arrows point to 10 nm gold particles). A, low-magnification view of neocortex shows a field with three immunopositive dendritic spines; label is associated with the synapse. B, higher magnification view of an immunopositive spine in cortex. C, large immunopositive spine in hippocampus. D, large spine in neostriatum; three gold particles are all associated with PSD. E, immunolabeled synapse in cerebellum; gold particle lies near the edge of the PSD. A, B: layer II–III cortex; C, CA1 hippocampus (stratum radiatum); D, striatum, E, cerebellum (molecular layer).
Scale bar = 400 nm in A; 100 nm in B–E.
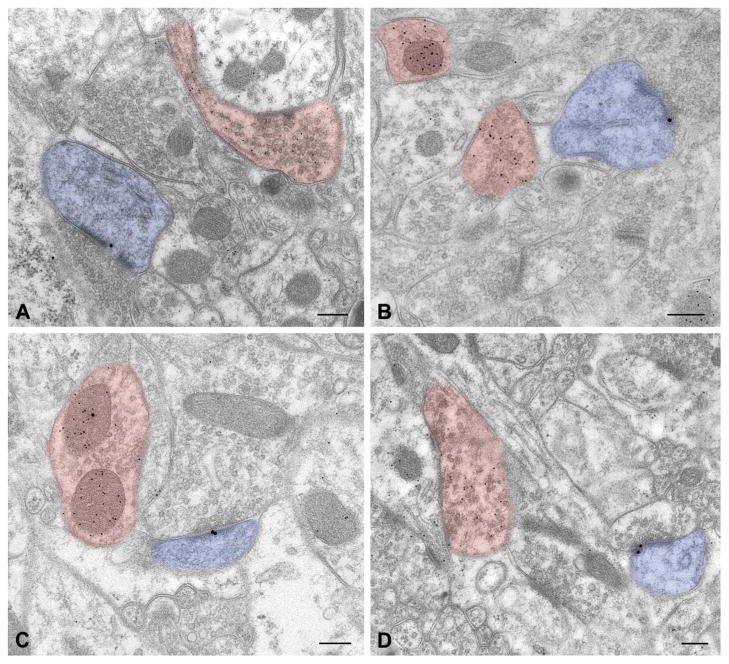
In contrast to the prominent label associated with presumed excitatory synapses, double labeling with GABA suggested that IRSp53 is rarely expressed in synaptic contacts made by GABAergic terminals. (Fig. 8). To evaluate this difference quantitatively, we counted all synapses in random fields from the four neuroanatomical regions. Overall, excitatory synapses were roughly ten times more likely to express IRSp53 in a single section than were GABAergic synapses, though the ratio varied somewhat in different brain regions (Table 2). Approximately ¼ of excitatory synapses in neocortex, hippocampus, and cerebellar cortex displayed labeling, in contrast to nearly ½ of excitatory synapses in striatum (Table 2). The numerical estimate of this labeling cannot be readily interpreted, since it greatly underestimates the true content of IRSp53 protein (in part because antigen can only be detected by postembedding methods at the very surface of the thin section), but the relative enrichment of labeling in striatum may be significant.
Figure 8.
Postembedding double labeling for IRSp53 (20 nm gold particles) and GABA (10 nm particles). IRSp53 labeling was often seen at postsynaptic sites of synapses likely, for their thickened postsynaptic density and GABA immunonegativity, to be glutamatergic (blue pseudocolored profiles), but rarely postsynaptic to GABAergic terminals (pink). A: neocortex layers II–III (S1); B, stratum radiatum of CA1 hippocampus; C, striatum, D, molecular layer, cerebellar cortex.
Scale bar = 200 nm in A–D.
Table 2.
|
|
||
|---|---|---|
| Excitatory synapses | Inhibitory synapses | |
| Cerebral cortex | 24% | 1.4% |
| Hippocampus | 28% | 2.0% |
| Striatum | 42% | 2.5% |
| Cerebellar cortex | 25% | 4.7%3 |
Percentage of synapses that contain at least one immunogold particle, in random single thin sections.
Quantification of label density in different tissue compartments showed that label was ~ 30-fold enriched over the PSD (Table 3). To ensure that this preferential PSD labeling reflected the distribution of antigen, rather than simply arising from some nonspecific affinity to the protein-rich environment of the synapse, we performed experiments in which the primary antibody was replaced by normal rabbit serum, finding in this case that label was only marginally enriched over the PSD, in contrast to strong enrichment over mitochondria (Table 3). The ratiometric data also support that most of the label detected within spine cytoplasm and presynaptic terminals, though present at far lower densities than at the PSD, reflects authentic IRSp53. These ratios likely overestimate nonspecific background, since to allow quantification of PSD labeling with normal serum as substitute for primary antibody, we had to increase its concentration to levels that gave excessive overall labeling.
Table 3.
|
|
|||
|---|---|---|---|
| IRSp53 | Serum | Ratio | |
| Total area | 0.47 ± 0.04 | 0.60 ± 0.02 | 0.78 |
| PSDs | 15.98 ± 3.22 | 1.12 ± 1.12 | 14.27 |
| Spines | 0.49 ± 0.18 | 0.23 ± 0.10 | 2.13 |
| Terminals | 0.58 ± 0.13 | 0.44 ± 0.10 | 1.32 |
| Mitochondria | 1.00 ± 0.27 | 3.12 ± 0.36 | 0.32 |
| Dendritic shafts | 0.28 ± 0.08 | 0.49 ± 0.07 | 0.57 |
| Others | 0.32 ± 0.05 | 0.69 ± 0.23 | 0.46 |
Mean number of gold particles/μm2 ± standard error
Organization at the synapse
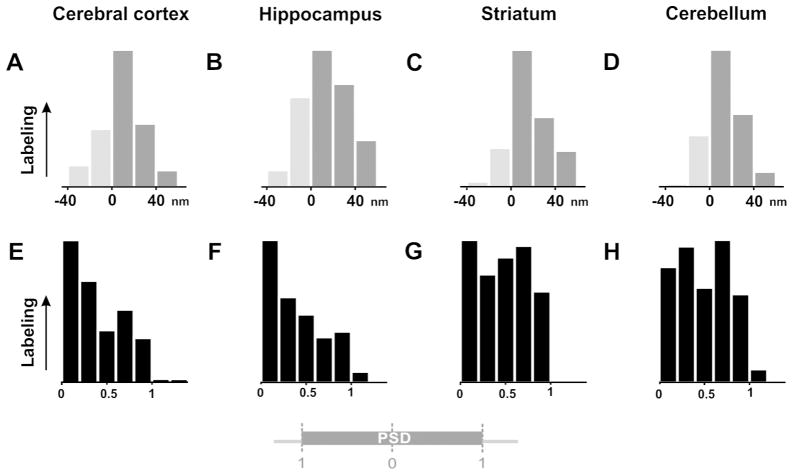
Quantitative analysis confirmed our qualitative impression from pre-embedding that label in spines was often close to the plasma membrane. In fact, we found that more than 80% of gold particles representing IRSp53 in dendritic spines (337 of 417 particles) lay within 30 nm of the membrane. This labeling showed a clear association with the PSD. To assess the organization of IRSp53 in the vicinity of the PSD quantitatively, we measured the axodendritic distribution of gold particles lying within the lateral borders of the synaptic specialization. At the synapse, IRSp53 immunogold particle density along the axo-dendritic axis was maximal over the PSD, with a peak ~20 nm inside the postsynaptic membrane; labeling density diminished rapidly outside the postsynaptic plasma membrane and also within the cytoplasmic matrix of the spine (Fig. 9A–D).
Figure 9.
Synaptic distribution of immunogold labeling. A–D, histograms in the upper row show the distribution of immunolabeling in the axodendritic axis (20 nm bins); light gray bars represent labeling outside the plasma membrane of the spine. The pattern of labeling was generally consistent for cortex (A), hippocampus (B), striatum (C), and cerebellum (D), peaking ~20 nm inside the postsynaptic plasma membrane. E–H, histograms in the lower row show distribution of label tangentially along the synapse, normalized such that 0 corresponds to the center of the PSD, and 1.0 to its edge (see diagram at bottom). While restricted to the synapse for all regions examined, labeling in cortex and hippocampus (E, F) concentrated at the center of the PSD, whereas labeling in striatum and cerebellum (G, H) spread uniformly along the PSD. Y-axis for each histogram is normalized so that the largest bin corresponds to 1.0 units, and the origin corresponds to zero.
To determine whether IRSp53 is uniformly distributed tangentially along the PSD, we computed the “normalized lateral position” (LN) of gold particles along the membrane (lying within a window between −10 nm and +50 nm from the postsynaptic plasma membrane; see Materials and Methods, and diagram at bottom of Fig. 9). For all regions examined, labeling was strongly associated with the PSD, declining abruptly at its edge. However, in spines from the neocortex and CA1 hippocampus but not striatum and cerebellum, IRSp53 concentrated at the center of the synapse (Fig. 9E, F), a distribution reminiscent of that previously reported for NMDA receptors (Kharazia and Weinberg, 1999; Takumi et al., 1999). To assess whether these distributions could have arisen by chance, we used chi-square statistics with 4 degrees of freedom (reflecting five bins within the border of the synaptic specialization in Fig. 9E, F) to assess significance. For both neocortex and hippocampus, the distribution of particles among the five bins was significantly different from a uniform distribution (neocortex, p < 0.001, n = 102 synaptic particles; CA1, p < 0.01, n = 69 particles). In contrast, in spines from striatum and cerebellum, IRSp53 was rather uniformly distributed along the synapse (striatum, p > 0.6, n = 106 synaptic particles; cerebellar cortex, p > 0.5, n = 85 particles, Fig. 9G, H).
We computed the mean LN of all particles in this axodendritic window that lay within the borders of the PSD for each anatomical region, finding mean values of 0.38 ± 0.03 for both neocortex and hippocampus, and 0.47 ± 0.03 for both striatum and cerebellar cortex. Not surprisingly, a Wilcoxon rank-sum test revealed that the distribution of synaptic particles in hippocampus was not significantly different from that in neocortex (p > 0.9), whereas the distributions in striatum and cerebellum differed from that in neocortex (p < 0.02 for both).
We also computed an “edge-to-center” ratio (defined as the number of particles within the limits of the PSD with LN > 0.5, divided by the number of particles with LN < 0.5). We found the edge-to-center ratio for neocortex to be 0.49, and hippocampus, 0.53; whereas the ratio for striatum was 0.95, and cerebellar cortex, 0.98, confirming that PSD-associated particles in neocortex and hippocampus concentrate at the center of the synapse, but were quite uniformly distributed along the synapse in striatum and cerebellar cortex.
DISCUSSION
We here provide the first detailed report of the distribution of IRSp53 protein in the adult brain. We find that the protein is expressed throughout the gray matter, especially in regions rich in spiny neurons, where is concentrates at the PSD. Our results suggest that IRSp53 is a core component of dendritic spines.
IRSp53 and insulin receptors
IRSp53 can participate in a variety of pathways, including insulin signaling itself. Insulin may play an important regulatory role in the brain, where it has been proposed to modulate synaptic plasticity (Dou et al., 2005). While the functional significance of insulin and insulin-like growth factors in the brain remains unclear (Banks et al., 2012; Ghasemi et al., 2013; Zhao et al., 1999), insulin receptors have been linked to a variety of physiological functions, including appetite regulation, fertility and reproduction, and learning and memory (Banks et al., 2012; Chiu and Cline, 2010). Activation of the insulin receptor promotes formation of dendritic spines (Lee et al., 2011), and has been shown to regulate the density of synapses in the developing visual system (Chiu et al., 2008). At the molecular level, insulin receptors may play an important role in regulation of intracellular trafficking, and surface expression of ion channels and neurotransmitter receptors (Beattie et al., 2000; Chiu et al., 2008; Huang et al., 2004; Huang et al., 2003; Liao and Leonard, 1999; Man et al., 2000; Passafaro et al., 2001; Skeberdis et al., 2001; Wan et al., 1997; Wang and Linden, 2000).
Autoradiography and in situ hybridization (Havrankova et al., 1978; Marks et al., 1990; Werther et al., 1987) reveal especially high levels of the insulin receptor in the olfactory bulb, neocortex, hypothalamus and hippocampus; and moderate expression in striatum and cerebellum; but only weak expression in the thalamus. Interestingly, these results correspond to the regional distribution of IRSp53 we find in the present study. Moreover, the β-subunit of the insulin receptor has also been found in synaptosome and PSD fractions (Abbott et al., 1999). Taken together, these data raise the possibility that IRSp53 may be a key element of an insulin receptor signaling system at the synapse.
IRSp53 and dendritic morphology
Experiments in cultured neurons show that IRSp53 can regulate dendritic branching. These effects may be related to the ability of IRSp53, as an I-BAR protein, to sense and/or modify membrane curvature (Ahmed et al., 2010). If so, one would expect to see the protein associated with the plasma membrane, but in fact we found that IRSp53 in dendrites was seldom close to the membrane. Moreover, we saw no evidence of antigen accumulation at zones of high curvature (e.g., dendritic branches and junctions with spine necks) However, label did associate with small membrane-bound tubules within dendritic shafts; these structures might be important for dendritic development and branching.
In any case, the large majority of IRSp53 in dendrites was cytoplasmic and associated with filaments, likely representing protein in transit. Since the protein can move quickly from dendrites to spines in response to neuronal activity (Hori et al., 2005), we speculate that IRSp53 in dendritic shafts may represent a reserve pool (though it remains possible that the protein may have a specific function in dendrites). In contrast, IRSp53 in spines was associated with the membrane, and thus is suitably positioned to modulate spine shape. This would be consistent with current views that morphologic plasticity in the adult is far more prominent in spines than dendritic shafts.
IRSp53 and the postsynaptic density
Our postembedding EM analysis documents that IRSp53 in the adult brain is highly concentrated at the PSD, as previously suggested by biochemical fractionation studies. These data are consistent with biochemical evidence that IRSp53 can bind to several key PSD scaffold proteins, including PSD-95 (via its PDZ motif) and Shank (via its SH3 domain); in fact, IRSp53 has been proposed to act as a bridge between these two proteins (Bockmann et al., 2002; Choi et al., 2005; Soltau et al., 2002). This proposal is consistent with the present data showing that IRSp53 (mean axodendritic position 16.9 ± 0.7 nm cytoplasmic to the postsynaptic membrane) lies between PSD-95 (previously reported axodendritic position 11.9 ± 31.2 nm) and Shank (24.1 ± 31.7 nm, (Valtschanoff and Weinberg, 2001)). Interestingly, the Rho protein CDC42, implicated in regulation of spine shape, has been shown to regulate formation of this IRSp53 trimeric complex (Soltau et al., 2004). Accordingly, we suggest that IRSp53 may link postsynaptic signal transduction to actin remodeling.
Regional differences in the distribution of IRSp53 along the synapse
IRSp53 was expressed at high levels in brain regions rich in spiny neurons. Though often presumed to represent a uniform population, dendritic spines from different type of neurons can differ in ultrastructure and protein composition, and may employ distinct signaling pathways (Harris and Weinberg, 2012; O’Rourke et al., 2012; Petralia et al., 1994). For example, proteomic analysis shows important molecular differences between forebrain and cerebellar PSDs (Cheng et al., 2006). The present results show that IRSp53 in the pyramidal cells of neocortex and hippocampus concentrated at the center of the PSD, whereas IRSp53 in the spiny inhibitory neurons of neostriatum and cerebellar cortex distributed uniformly along the synapse. These regional differences in the tangential organization of IRSp53 within the PSD further support the notion that dendritic spines are not uniform across brain regions.
As a modular protein with multiple binding domains, IRSp53 may be involved in a variety of protein complexes participating in distinct signaling pathways. Accordingly, the differences we detected in IRSp53 localization may be related to different synaptic functions. As mentioned above, IRSp53 can bind both PSD-95 and Shank, key elements of the NMDA receptor signaling complex (Dosemeci et al., 2007; Husi et al., 2000). Moreover, the tangential distribution profile of IRSp53 we found in cortex and hippocampus closely resembles that previously reported for NMDA receptors (Kharazia and Weinberg, 1999; Takumi et al., 1999). These data, along with recent evidence that IRSp53 may play a direct role in regulating NMDA receptors and/or their numbers at the PSD, implicate IRSp53 as a component of the NMDAR signaling complex in cortex and hippocampus. In contrast, in Purkinje cells, which contain little NMDA receptor (Cheng et al., 2006; Petralia et al., 1994), IRSp53 was more uniformly distributed. IRSp53 has been shown to bind to the multifunctional actin-bundling protein espin (also enriched in the PSD), a protein only expressed in cerebellar Purkinje cells (Sekerkova et al., 2003). Thus IRSp53 in Purkinje cells may be part of a distinct molecular complex.
In summary, while the functional significance of IRSp53 in the adult brain remains unclear, the present evidence suggests that it acts mainly at the PSD, that it may play a role in the insulin signaling system, and that it may play different roles in different synapses.
Acknowledgments
We thank Kristen Phend and Susan Burette for histological assistance; Vladimir Ghukasyan for assistance with acquiring mosaic images; and Scott Soderling and Bence Racz for comments on the manuscript. Imaging was supported by the Confocal and Multiphoton Imaging Core of NINDS Center (Grant P30 NS045892) and by the Michael Hooker Microscopy Facility.
Grant support: R01 NS039444 (RJW)
Footnotes
Conflict of interest statement
The authors verify that they have no known or potential conflict of interest including any financial, personal, or other relationships with other people or organizations within 3 years of beginning the submitted work that could inappropriately influence, or be perceived to influence, this work.
Role of authors
All authors had full access to all the data in the study and take responsibility for the integrity of the data and the accuracy of the data analysis. Study concept and design: AB, RJW. Acquisition of data: AB. Analysis and interpretation of data: AB. Antibody characterization: HP. Drafting of the manuscript: AB. Critical revision of the manuscript for intellectual content: AB, RJW. Obtained funding: RJW.
References
- Abbott MA, Wells DG, Fallon JR. The insulin receptor tyrosine kinase substrate p58/53 and the insulin receptor are components of CNS synapses. The Journal of neuroscience: the official journal of the Society for Neuroscience. 1999;19(17):7300–7308. doi: 10.1523/JNEUROSCI.19-17-07300.1999. [DOI] [PMC free article] [PubMed] [Google Scholar]
- Ahmed S, Goh WI, Bu W. I-BAR domains, IRSp53 and filopodium formation. Seminars in cell & developmental biology. 2010;21(4):350–356. doi: 10.1016/j.semcdb.2009.11.008. [DOI] [PubMed] [Google Scholar]
- Banks WA, Owen JB, Erickson MA. Insulin in the brain: there and back again. Pharmacology & therapeutics. 2012;136(1):82–93. doi: 10.1016/j.pharmthera.2012.07.006. [DOI] [PMC free article] [PubMed] [Google Scholar]
- Beattie EC, Carroll RC, Yu X, Morishita W, Yasuda H, von Zastrow M, Malenka RC. Regulation of AMPA receptor endocytosis by a signaling mechanism shared with LTD. Nature neuroscience. 2000;3(12):1291–1300. doi: 10.1038/81823. [DOI] [PubMed] [Google Scholar]
- Bockmann J, Kreutz MR, Gundelfinger ED, Bockers TM. ProSAP/Shank postsynaptic density proteins interact with insulin receptor tyrosine kinase substrate IRSp53. Journal of neurochemistry. 2002;83(4):1013–1017. doi: 10.1046/j.1471-4159.2002.01204.x. [DOI] [PubMed] [Google Scholar]
- Cheng D, Hoogenraad CC, Rush J, Ramm E, Schlager MA, Duong DM, Xu P, Wijayawardana SR, Hanfelt J, Nakagawa T, Sheng M, Peng J. Relative and absolute quantification of postsynaptic density proteome isolated from rat forebrain and cerebellum. Molecular & cellular proteomics: MCP. 2006;5(6):1158–1170. doi: 10.1074/mcp.D500009-MCP200. [DOI] [PubMed] [Google Scholar]
- Chiu SL, Chen CM, Cline HT. Insulin receptor signaling regulates synapse number, dendritic plasticity, and circuit function in vivo. Neuron. 2008;58(5):708–719. doi: 10.1016/j.neuron.2008.04.014. [DOI] [PMC free article] [PubMed] [Google Scholar]
- Chiu SL, Cline HT. Insulin receptor signaling in the development of neuronal structure and function. Neural development. 2010;5:7. doi: 10.1186/1749-8104-5-7. [DOI] [PMC free article] [PubMed] [Google Scholar]
- Choi J, Ko J, Racz B, Burette A, Lee JR, Kim S, Na M, Lee HW, Kim K, Weinberg RJ, Kim E. Regulation of dendritic spine morphogenesis by insulin receptor substrate 53, a downstream effector of Rac1 and Cdc42 small GTPases. The Journal of neuroscience: the official journal of the Society for Neuroscience. 2005;25(4):869–879. doi: 10.1523/JNEUROSCI.3212-04.2005. [DOI] [PMC free article] [PubMed] [Google Scholar]
- Dosemeci A, Makusky AJ, Jankowska-Stephens E, Yang X, Slotta DJ, Markey SP. Composition of the synaptic PSD-95 complex. Molecular & cellular proteomics: MCP. 2007;6(10):1749–1760. doi: 10.1074/mcp.M700040-MCP200. [DOI] [PMC free article] [PubMed] [Google Scholar]
- Dou JT, Chen M, Dufour F, Alkon DL, Zhao WQ. Insulin receptor signaling in long-term memory consolidation following spatial learning. Learn Mem. 2005;12(6):646–655. doi: 10.1101/lm.88005. [DOI] [PMC free article] [PubMed] [Google Scholar]
- Ghasemi R, Haeri A, Dargahi L, Mohamed Z, Ahmadiani A. Insulin in the brain: sources, localization and functions. Molecular neurobiology. 2013;47(1):145–171. doi: 10.1007/s12035-012-8339-9. [DOI] [PubMed] [Google Scholar]
- Govind S, Kozma R, Monfries C, Lim L, Ahmed S. Cdc42Hs facilitates cytoskeletal reorganization and neurite outgrowth by localizing the 58-kD insulin receptor substrate to filamentous actin. The Journal of cell biology. 2001;152(3):579–594. doi: 10.1083/jcb.152.3.579. [DOI] [PMC free article] [PubMed] [Google Scholar]
- Harris KM, Weinberg RJ. Ultrastructure of synapses in the mammalian brain. Cold Spring Harbor perspectives in biology. 2012;4(5) doi: 10.1101/cshperspect.a005587. [DOI] [PMC free article] [PubMed] [Google Scholar]
- Havrankova J, Roth J, Brownstein M. Insulin receptors are widely distributed in the central nervous system of the rat. Nature. 1978;272(5656):827–829. doi: 10.1038/272827a0. [DOI] [PubMed] [Google Scholar]
- Hori K, Yasuda H, Konno D, Maruoka H, Tsumoto T, Sobue K. NMDA receptor-dependent synaptic translocation of insulin receptor substrate p53 via protein kinase C signaling. The Journal of neuroscience: the official journal of the Society for Neuroscience. 2005;25(10):2670–2681. doi: 10.1523/JNEUROSCI.3638-04.2005. [DOI] [PMC free article] [PubMed] [Google Scholar]
- Huang CC, Lee CC, Hsu KS. An investigation into signal transduction mechanisms involved in insulin-induced long-term depression in the CA1 region of the hippocampus. Journal of neurochemistry. 2004;89(1):217–231. doi: 10.1111/j.1471-4159.2003.02307.x. [DOI] [PubMed] [Google Scholar]
- Huang CC, You JL, Lee CC, Hsu KS. Insulin induces a novel form of postsynaptic mossy fiber long-term depression in the hippocampus. Molecular and cellular neurosciences. 2003;24(3):831–841. doi: 10.1016/s1044-7431(03)00238-0. [DOI] [PubMed] [Google Scholar]
- Husi H, Ward MA, Choudhary JS, Blackstock WP, Grant SG. Proteomic analysis of NMDA receptor-adhesion protein signaling complexes. Nature neuroscience. 2000;3(7):661–669. doi: 10.1038/76615. [DOI] [PubMed] [Google Scholar]
- Kharazia VN, Weinberg RJ. Immunogold localization of AMPA and NMDA receptors in somatic sensory cortex of albino rat. The Journal of comparative neurology. 1999;412(2):292–302. doi: 10.1002/(sici)1096-9861(19990920)412:2<292::aid-cne8>3.0.co;2-g. [DOI] [PubMed] [Google Scholar]
- Kim MH, Choi J, Yang J, Chung W, Kim JH, Paik SK, Kim K, Han S, Won H, Bae YS, Cho SH, Seo J, Bae YC, Choi SY, Kim E. Enhanced NMDA receptor-mediated synaptic transmission, enhanced long-term potentiation, and impaired learning and memory in mice lacking IRSp53. The Journal of neuroscience: the official journal of the Society for Neuroscience. 2009;29(5):1586–1595. doi: 10.1523/JNEUROSCI.4306-08.2009. [DOI] [PMC free article] [PubMed] [Google Scholar]
- Krugmann S, Jordens I, Gevaert K, Driessens M, Vandekerckhove J, Hall A. Cdc42 induces filopodia by promoting the formation of an IRSp53:Mena complex. Current biology: CB. 2001;11(21):1645–1655. doi: 10.1016/s0960-9822(01)00506-1. [DOI] [PubMed] [Google Scholar]
- Lee CC, Huang CC, Hsu KS. Insulin promotes dendritic spine and synapse formation by the PI3K/Akt/mTOR and Rac1 signaling pathways. Neuropharmacology. 2011;61(4):867–879. doi: 10.1016/j.neuropharm.2011.06.003. [DOI] [PubMed] [Google Scholar]
- Liao GY, Leonard JP. Insulin modulation of cloned mouse NMDA receptor currents in Xenopus oocytes. Journal of neurochemistry. 1999;73(4):1510–1519. doi: 10.1046/j.1471-4159.1999.0731510.x. [DOI] [PubMed] [Google Scholar]
- Lim KB, Bu W, Goh WI, Koh E, Ong SH, Pawson T, Sudhaharan T, Ahmed S. The Cdc42 effector IRSp53 generates filopodia by coupling membrane protrusion with actin dynamics. The Journal of biological chemistry. 2008;283(29):20454–20472. doi: 10.1074/jbc.M710185200. [DOI] [PubMed] [Google Scholar]
- Man HY, Lin JW, Ju WH, Ahmadian G, Liu L, Becker LE, Sheng M, Wang YT. Regulation of AMPA receptor-mediated synaptic transmission by clathrin-dependent receptor internalization. Neuron. 2000;25(3):649–662. doi: 10.1016/s0896-6273(00)81067-3. [DOI] [PubMed] [Google Scholar]
- Marks JL, Porte D, Jr, Stahl WL, Baskin DG. Localization of insulin receptor mRNA in rat brain by in situ hybridization. Endocrinology. 1990;127(6):3234–3236. doi: 10.1210/endo-127-6-3234. [DOI] [PubMed] [Google Scholar]
- Miki H, Yamaguchi H, Suetsugu S, Takenawa T. IRSp53 is an essential intermediate between Rac and WAVE in the regulation of membrane ruffling. Nature. 2000;408(6813):732–735. doi: 10.1038/35047107. [DOI] [PubMed] [Google Scholar]
- Nakagawa H, Miki H, Nozumi M, Takenawa T, Miyamoto S, Wehland J, Small JV. IRSp53 is colocalised with WAVE2 at the tips of protruding lamellipodia and filopodia independently of Mena. Journal of cell science. 2003;116(Pt 12):2577–2583. doi: 10.1242/jcs.00462. [DOI] [PubMed] [Google Scholar]
- O’Rourke NA, Weiler NC, Micheva KD, Smith SJ. Deep molecular diversity of mammalian synapses: why it matters and how to measure it. Nature reviews Neuroscience. 2012;13(6):365–379. doi: 10.1038/nrn3170. [DOI] [PMC free article] [PubMed] [Google Scholar]
- Oda K, Shiratsuchi T, Nishimori H, Inazawa J, Yoshikawa H, Taketani Y, Nakamura Y, Tokino T. Identification of BAIAP2 (BAI-associated protein 2), a novel human homologue of hamster IRSp53, whose SH3 domain interacts with the cytoplasmic domain of BAI1. Cytogenetics and cell genetics. 1999;84(1–2):75–82. doi: 10.1159/000015219. [DOI] [PubMed] [Google Scholar]
- Paschou P, Feng Y, Pakstis AJ, Speed WC, DeMille MM, Kidd JR, Jaghori B, Kurlan R, Pauls DL, Sandor P, Barr CL, Kidd KK. Indications of linkage and association of Gilles de la Tourette syndrome in two independent family samples: 17q25 is a putative susceptibility region. American journal of human genetics. 2004;75(4):545–560. doi: 10.1086/424389. [DOI] [PMC free article] [PubMed] [Google Scholar]
- Passafaro M, Piech V, Sheng M. Subunit-specific temporal and spatial patterns of AMPA receptor exocytosis in hippocampal neurons. Nature neuroscience. 2001;4(9):917–926. doi: 10.1038/nn0901-917. [DOI] [PubMed] [Google Scholar]
- Petralia RS, Wang YX, Wenthold RJ. The NMDA receptor subunits NR2A and NR2B show histological and ultrastructural localization patterns similar to those of NR1. The Journal of neuroscience: the official journal of the Society for Neuroscience. 1994;14(10):6102–6120. doi: 10.1523/JNEUROSCI.14-10-06102.1994. [DOI] [PMC free article] [PubMed] [Google Scholar]
- Ribases M, Bosch R, Hervas A, Ramos-Quiroga JA, Sanchez-Mora C, Bielsa A, Gastaminza X, Guijarro-Domingo S, Nogueira M, Gomez-Barros N, Kreiker S, Gross-Lesch S, Jacob CP, Lesch KP, Reif A, Johansson S, Plessen KJ, Knappskog PM, Haavik J, Estivill X, Casas M, Bayes M, Cormand B. Case-control study of six genes asymmetrically expressed in the two cerebral hemispheres: association of BAIAP2 with attention-deficit/hyperactivity disorder. Biological psychiatry. 2009;66(10):926–934. doi: 10.1016/j.biopsych.2009.06.024. [DOI] [PubMed] [Google Scholar]
- Sawallisch C, Berhorster K, Disanza A, Mantoani S, Kintscher M, Stoenica L, Dityatev A, Sieber S, Kindler S, Morellini F, Schweizer M, Boeckers TM, Korte M, Scita G, Kreienkamp HJ. The insulin receptor substrate of 53 kDa (IRSp53) limits hippocampal synaptic plasticity. The Journal of biological chemistry. 2009;284(14):9225–9236. doi: 10.1074/jbc.M808425200. [DOI] [PMC free article] [PubMed] [Google Scholar]
- Schneider CA, Rasband WS, Eliceiri KW. NIH Image to ImageJ: 25 years of image analysis. Nature methods. 2012;9(7):671–675. doi: 10.1038/nmeth.2089. [DOI] [PMC free article] [PubMed] [Google Scholar]
- Scita G, Confalonieri S, Lappalainen P, Suetsugu S. IRSp53: crossing the road of membrane and actin dynamics in the formation of membrane protrusions. Trends in cell biology. 2008;18(2):52–60. doi: 10.1016/j.tcb.2007.12.002. [DOI] [PubMed] [Google Scholar]
- Sekerkova G, Loomis PA, Changyaleket B, Zheng L, Eytan R, Chen B, Mugnaini E, Bartles JR. Novel espin actin-bundling proteins are localized to Purkinje cell dendritic spines and bind the Src homology 3 adapter protein insulin receptor substrate p53. The Journal of neuroscience: the official journal of the Society for Neuroscience. 2003;23(4):1310–1319. doi: 10.1523/JNEUROSCI.23-04-01310.2003. [DOI] [PMC free article] [PubMed] [Google Scholar]
- Shu SY, Ju G, Fan LZ. The glucose oxidase-DAB-nickel method in peroxidase histochemistry of the nervous system. Neuroscience letters. 1988;85(2):169–171. doi: 10.1016/0304-3940(88)90346-1. [DOI] [PubMed] [Google Scholar]
- Skeberdis VA, Lan J, Zheng X, Zukin RS, Bennett MV. Insulin promotes rapid delivery of N-methyl-D- aspartate receptors to the cell surface by exocytosis. Proceedings of the National Academy of Sciences of the United States of America. 2001;98(6):3561–3566. doi: 10.1073/pnas.051634698. [DOI] [PMC free article] [PubMed] [Google Scholar]
- Soltau M, Berhorster K, Kindler S, Buck F, Richter D, Kreienkamp HJ. Insulin receptor substrate of 53 kDa links postsynaptic shank to PSD-95. Journal of neurochemistry. 2004;90(3):659–665. doi: 10.1111/j.1471-4159.2004.02523.x. [DOI] [PubMed] [Google Scholar]
- Soltau M, Richter D, Kreienkamp HJ. The insulin receptor substrate IRSp53 links postsynaptic shank1 to the small G-protein cdc42. Molecular and cellular neurosciences. 2002;21(4):575–583. doi: 10.1006/mcne.2002.1201. [DOI] [PubMed] [Google Scholar]
- Takumi Y, Ramirez-Leon V, Laake P, Rinvik E, Ottersen OP. Different modes of expression of AMPA and NMDA receptors in hippocampal synapses. Nature neuroscience. 1999;2(7):618–624. doi: 10.1038/10172. [DOI] [PubMed] [Google Scholar]
- Toma C, Hervas A, Balmana N, Vilella E, Aguilera F, Cusco I, del Campo M, Caballero R, De Diego-Otero Y, Ribases M, Cormand B, Bayes M. Association study of six candidate genes asymmetrically expressed in the two cerebral hemispheres suggests the involvement of BAIAP2 in autism. Journal of psychiatric research. 2011;45(2):280–282. doi: 10.1016/j.jpsychires.2010.09.001. [DOI] [PubMed] [Google Scholar]
- Valtschanoff JG, Weinberg RJ. Laminar organization of the NMDA receptor complex within the postsynaptic density. The Journal of neuroscience: the official journal of the Society for Neuroscience. 2001;21(4):1211–1217. doi: 10.1523/JNEUROSCI.21-04-01211.2001. [DOI] [PMC free article] [PubMed] [Google Scholar]
- Wan Q, Xiong ZG, Man HY, Ackerley CA, Braunton J, Lu WY, Becker LE, MacDonald JF, Wang YT. Recruitment of functional GABA(A) receptors to postsynaptic domains by insulin. Nature. 1997;388(6643):686–690. doi: 10.1038/41792. [DOI] [PubMed] [Google Scholar]
- Wang YT, Linden DJ. Expression of cerebellar long-term depression requires postsynaptic clathrin-mediated endocytosis. Neuron. 2000;25(3):635–647. doi: 10.1016/s0896-6273(00)81066-1. [DOI] [PubMed] [Google Scholar]
- Werther GA, Hogg A, Oldfield BJ, McKinley MJ, Figdor R, Allen AM, Mendelsohn FA. Localization and characterization of insulin receptors in rat brain and pituitary gland using in vitro autoradiography and computerized densitometry. Endocrinology. 1987;121(4):1562–1570. doi: 10.1210/endo-121-4-1562. [DOI] [PubMed] [Google Scholar]
- Yamagishi A, Masuda M, Ohki T, Onishi H, Mochizuki N. A novel actin bundling/filopodium-forming domain conserved in insulin receptor tyrosine kinase substrate p53 and missing in metastasis protein. The Journal of biological chemistry. 2004;279(15):14929–14936. doi: 10.1074/jbc.M309408200. [DOI] [PubMed] [Google Scholar]
- Yeh TC, Ogawa W, Danielsen AG, Roth RA. Characterization and cloning of a 58/53-kDa substrate of the insulin receptor tyrosine kinase. The Journal of biological chemistry. 1996;271(6):2921–2928. doi: 10.1074/jbc.271.6.2921. [DOI] [PubMed] [Google Scholar]
- Zhao H, Pykalainen A, Lappalainen P. I-BAR domain proteins: linking actin and plasma membrane dynamics. Current opinion in cell biology. 2011;23(1):14–21. doi: 10.1016/j.ceb.2010.10.005. [DOI] [PubMed] [Google Scholar]
- Zhao W, Chen H, Xu H, Moore E, Meiri N, Quon MJ, Alkon DL. Brain insulin receptors and spatial memory. Correlated changes in gene expression, tyrosine phosphorylation, and signaling molecules in the hippocampus of water maze trained rats. The Journal of biological chemistry. 1999;274(49):34893–34902. doi: 10.1074/jbc.274.49.34893. [DOI] [PubMed] [Google Scholar]
- Zhou J, Jones DR, Duong DM, Levey AI, Lah JJ, Peng J. Proteomic analysis of postsynaptic density in Alzheimer’s Disease. Clinica chimica acta; international journal of clinical chemistry. 2013 doi: 10.1016/j.cca.2013.03.016. [DOI] [PMC free article] [PubMed] [Google Scholar]


