

Abstract
Homer is a postsynaptic density (PSD) scaffold protein that is involved in synaptic plasticity, calcium signaling and neurological disorders. Here, we use pre-embedding immunogold electron microscopy to illustrate the differential localization of three Homer gene products (Homer 1, 2, and 3) in different regions of the mouse brain. In cross-sectioned PSDs, Homer occupies a layer ~30–100 nm from the postsynaptic membrane lying just beyond the dense material that defines the PSD core (~30 nm thick). Homer is evenly distributed within the PSD area along the lateral axis, but not at the peri-PSD locations within 60 nm from the edge of the PSD, where mGluR1 and 5 are concentrated. This distribution of Homer matches that of Shank, another major PSD scaffold protein, but differs from those of other two major binding partners of Homer, type I mGluR and IP3 receptors.
Many PSD proteins rapidly redistribute upon acute (2 min) stimulation. To determine whether Homer distribution is affected by acute stimulation, we examined its distribution in dissociated hippocampal cultures under different conditions. Both the pattern and density of label for Homer 1, the isoform that is ubiquitous in hippocampus, remained unchanged under high K+ depolarization (90 mM for 2–5 min), NMDA treatment (50 μM for 2 min), and calcium-free conditions (EGTA at 1 mM for 2 min). In contrast, Shank and CaMKII accumulate at the PSD upon NMDA treatment, and CaMKII is excluded from the PSD complex under low calcium conditions.
Keywords: synapse, Shanks, CaMKII, electron microscopy, PSD, mGluR
INTRODUCTION
Homer is a scaffold protein at the postsynaptic density (PSD) with isoforms belonging to three gene families, Homer 1, 2, and 3; each includes long and short forms (reviewed in Ehrengruber et al., 2004; Shiraishi-Yamaguchi and Furuichi, 2007; Foa and Gasperini, 2009). The long forms are localized at the PSD and are constitutively expressed, while the short forms are cytosolic with low expression under basal conditions, and are transcriptionally induced upon neuronal stimulation. Homer binds to type I-metabotropic glutamate receptors (mGluR1 & 5) (Soloviev et al., 2000), inositol 1,4,5-trisphosphate receptors (IP3R) (Tu et al., 1998) and Shank (Hayashi et al., 2009), and is thought to be involved in glutamate receptor trafficking (Xiao et al., 2000; Shiraishi-Yamaguchi and Furuichi, 2007) and calcium signaling (Worley et al., 2007). Homer is also implicated in neurological disorders (Szumlinski et al., 2006; Luo et al., 2013).
Homer 1, 2, and 3 are differentially localized to different regions of the brain as demonstrated by in situ hybridization and Western blotting (Xiao et al., 1998), and by immunolabeling at the light microscopy level (Shiraishi et al., 2004). However, studies of Homer at the EM level have been scarce (Xiao et al., 1998; Tu et al., 1999; Petralia et al., 2001; 2005), and none of these studies specified the activity state of the synapses. Here, we label different parts of the mouse brain by immunogold under validated resting conditions (Tao-Cheng et al., 2007), and compare immunolocalization of different isoforms of Homer. The detailed distribution of Homer is also compared with the known patterns of distribution of its binding partners.
The PSD is a dynamic complex that undergoes activity-dependent structural changes (Tao-Cheng, 2012). Many PSD proteins such as CaMKII (calcium/calmodulin-dependent kinase II; Dosemeci et al., 2001, 2002), Shank (a PSD scaffold protein which binds to Homer; Tao-Cheng et al., 2010) and CYLD (a cylindromatosis tumor suppressor that functions as a deubiquitinase; Dosemeci et al., 2013) rapidly redistribute and accumulate at the PSD upon acute (2 min) stimulation. Furthermore, AMPA receptors (GluR2) become more concentrated at the PSD upon depolarization (Tao-Cheng et al., 2011), while SynGAP (a Ras GTPase activating protein; Yang et al., 2011; 2013) moves out of the PSD core upon excitation. To determine whether Homer distribution similarly is affected under these acute synaptic stimulation protocols, its distribution was compared under resting conditions, high K+ depolarization, acute NMDA treatment, and calcium-free conditions. Dissociated hippocampal cultures were used to allow easy manipulation of the stimulation conditions (Tao-Cheng, 2012).
EXPERIMENTAL PROCEDURES
1.1 Materials and antibodies
Mouse monoclonal antibody against Homer 1 (pan Homer 1, clone 2G8), rabbit polyclonal antibodies against Homer 1b/c (raised against aa 152–354 of human Homer 1b), Homer 2 (raised against aa 1–176 of rat Homer 2), Homer 3 (raised against aa 1–177 of rat Homer 3), pan Homer 1/2/3 (raised against N-terminal parts of Homer 1, 2 and 3) were from Synaptic Systems (Göttingen, Germany); goat polyclonal antibody against Homer 1a (raised against M-13, a peptide at the C-terminus) was from Santa Cruz Biotechnology (Dallas, TX); mouse monoclonal antibody against pan Shank (clone N23B/49) was from NeuroMab (Davis, CA); α-CaMKII [clone 6G9(2)] was from Millipore (Billerica, MA); N-methyl-D-asparic acid (NMDA) and APV were from Tocris (Ellisville, MO).
1.2 Subcellular fractionation, electrophoresis and immunoblotting
Synaptosome and PSD fractions were prepared as described previously (Dosemeci et al., 2000) using brains from adult Sprague Dawley rats collected and frozen in liquid nitrogen within 2 min of decapitation by Pel-Freeze Biologicals (Rogers, AR). The frozen brains were thawed for 1 min in 0.32 M sucrose solution, and cerebral cortices were immediately dissected and homogenized for further processing.
Samples were separated by SDS-PAGE on 4–12% gradient Bis-Tris gels from Life Technologies (Carlsbad, CA), and transferred to PVDF membranes, blocked, incubated with specified primary antibodies and then with horseradish peroxidase-conjugated secondary antibodies (1:50,000 dilution), and the signal was finally visualized by chemiluminescence (SuperSignal West Pico, Thermo Scientific, Waltham, MA).
1.3 Perfusion-fixed mouse brains
The animal protocol was approved by the NIH Animal Use and Care Committee and conforms to NIH guidelines. The criteria for “fast” and “delayed” perfusion fixation were as defined in Tao-Cheng et al., 2007. Briefly, adult mice were deeply anesthetized with isoflurane, and perfusion fixed through the heart with 4% paraformaldehyde in PBS. Perfusion pressure was maintained at 150 mm Hg with a Perfusion-One System (MyNeurolab, Maryland Heights, MO). Approximately 100 ml of fixative was used per mouse over the course of 10 min. The perfusion-fixed brains were dissected from the skull and vibratomed into 100 μm thick coronal slices and stored in PBS at 4°C. To avoid over-fixing the tissues, total fixation time was closely monitored to be between 40 and 60 min from the flow of the fixative into the heart to the time the brain slices were vibratomed into the fixative-free PBS solution.
1.4 Dissociated hippocampal neuronal cultures and treatments
Hippocampal cells from 21-day embryonic Sprague-Dawley rats were dissociated and grown on a feeder layer of glial cells for 19 – 21 days. During experiments, culture dishes were placed on a floating platform in a water bath maintained at 37°C. Control incubation medium was: 124 mM NaCl, 2mM KCl, 1.24 mM KH2PO4, 1.3 mM MgCl2, 2.5 mM CaCl2, 30 mM glucose in 25 mM HEPES at pH 7.4. Whenever indicated, control medium was modified to include 50 μM NMDA, 50 μM APV, 90 mM KCl (compensated by reducing the concentration of NaCl), or calcium-free (EGTA, 1 mM). Cell cultures were washed with control medium and treated for indicated intervals with experimental media - Control, NMDA, APV, high K+, or calcium-free media. For recovery experiments, samples were processed as above and then washed with control medium (5 times within 2 min), then left in control medium for 30 min. Cells were fixed with 4% paraformaldehyde (EMS, Fort Washington, PA) in PBS for 30–45 min, and thoroughly washed before immunolabeling.
1.5 Pre-embedding immunogold labeling and electron microscopy
Fixed samples (perfusion-fixed brain vibratomed into 100 μm slices, or immersion-fixed monolayer of dissociated hippocampal cultures) were washed, and then blocked and made permeable with 5% normal goat serum and 0.1% saponin for 40–60 min. Samples were incubated with primary and secondary antibodies (Nanogold, Nanoprobes, Yaphand, NY) for 1–2 hr, fixed with 2% glutaraldehyde in PBS for 30 min- overnight, silver enhanced (HQ kit, Nanoprobes), en block stained with 0.25–0.5% uranyl acetate in acetate buffer at pH 5.0 for 1 hr, treated with 0.2% osmium tetroxide in 0.1M phosphate buffer at pH 7.4 for 30 min, dehydrated in graded ethanols, and embedded in epoxy resin. The primary antibody was omitted in some experiments to control for nonspecific labeling by the secondary antibody.
1.6. Sampling of synapses and morphometry
For perfusion-fixed brains, specific areas of the brains were mapped for sampling (cf. Tao-Cheng et al., 2007). Once an area was identified (e. g., the CA1 or CA3 regions), all asymmetric synapses within the superficial 2 μm of the brain slices with adequate penetration of the immunolabeling reagents were photographed with a bottom-mounted digital CCD camera which collects 2.6 K × 2.6 K pixels (AMT XR-100, Danvers, MA, USA). For dissociated cells, every synaptic profile encountered within randomly selected grid openings were photographed for morphometry.
Synaptic profiles were identified by the rigidly apposed pre- and post-synaptic membranes forming the synaptic cleft, by clusters of synaptic vesicles on the presynaptic side, and by the dense materials on the postsynaptic side. Only cross-sectioned synaptic profiles with clearly delineated postsynaptic membranes were included for measurement. The postsynaptic density (PSD) complex is subdivided into two layers (cf. Yang et al., 2011), a PSD core that contains a ~30 nm thick of dense material immediately adjacent to the postsynaptic membrane (bracket in Fig. 4B), and a second deeper layer ~ 30–100 nm deep from the postsynaptic membrane. For the present study, both the labeling intensity within the PSD complex and the vertical distance of label from the postsynaptic membrane were measured: To measure labeling intensity, every particle that lay within the PSD complex as outlined by the postsynaptic membrane, two parallel lines perpendicular to the postsynaptic membrane, and an arbitrary border 120 nm deep to the postsynaptic membrane (cf. Tao-Cheng 2010) was counted. This border was set at 120 nm in order not to undercount PSD-associated label as the thickened PSD under excitatory conditions can sometimes extend up to 120 nm (cf. Tao-Cheng 2010). Total amount of label within this designated PSD complex was then divided by the length of the PSD for an index of labeling intensity expressed as number of label/μm length of PSD. A second zone with the same depth as the PSD complex, but further away (120–240 nm) from the postsynaptic membrane was outlined to represent a cytoplasmic area outside of the PSD complex (cf. Fig. 1 in Tao-Cheng et al., 2010). Statistical analysis was carried out with ANOVA with Tukey post test. To measure the vertical distribution of labels, every particle within the PSD complex was measured from the center of the particle to the outer edge of the postsynaptic membrane and the distance measurements were plotted into histograms. Because the vertical distribution of label for Homer is skewed, statistical analysis was carried out with a non-parametric comparison of the median values, Kruskal-Wallis - rank sum test (KaleidaGraph, Synergy Software, Reading, PA).
Fig. 4. Quantification of labeling intensity of different Homer isoforms in different regions of the mouse brain.
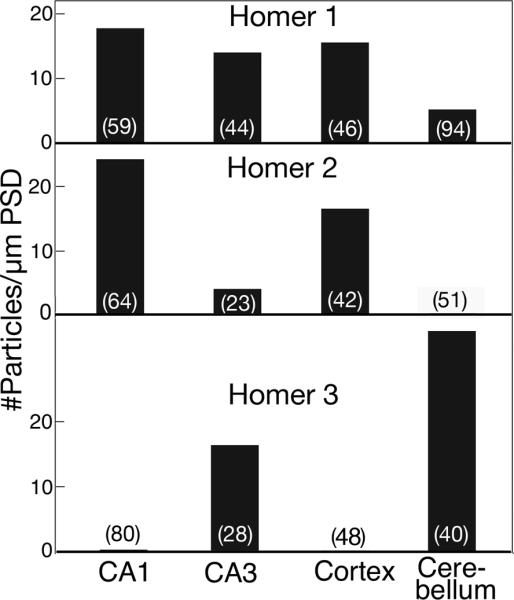
Number of synapses sampled is marked at the bottom of each bar. Statistical analysis was carried out with ANOVA (Tukey post test). For Homer 1, cerebellum vs. CA1, CA3 or cerebral cortex, P<0.0001; CA1 vs. CA3, P<0.05. For Homer 2, CA1 vs. CA3 or cerebellum, P<0.0001; CA1 vs. cortex, P<0. 01; cortex vs. cerebellum, P<0.0001; cortex vs. CA3, P<0.001. For Homer 3, significantly different among all comparisons.
Fig. 1. Western immunoblots comparing Homer isoforms in homogenate (H), synaptosome (Syn) and postsynaptic density (PSD) fractions.

Equal amounts of protein (20 μg) were loaded in each lane. Antibodies against Homer 1, 2, and 3 revealed an enrichment of the Homer isoforms at the PSD fractions relative to the parent fractions. Comparison of the two isoforms of Homer 1 indicates that the long isoform, Homer 1b/c, is enriched in PSD fractions while the short isoform, Homer 1a, is not.
RESULTS
2.1 Homer concentrates at the PSD
Western analysis was carried out to verify the various antibodies against different Homer isoforms (Fig. 1). Consistent with previous biochemical data (Sun et al., 1998; Xiao et al., 1998; Shiraishi et al., 1999), Homer 1, 2 and 3 were enriched at PSDs (Fig. 1 top row) isolated from rat brains. Antibodies against the long and short forms of the Homer 1 demonstrate that the long form (Homer 1b/c) was enriched at the PSD (Fig. 1, bottom row, left), in contrast to the short form (Homer 1a) (Fig. 1 bottom row, right).
Consistent with results from Western blots (Fig. 1) as well as light microscopy immunolabeling (Shiraishi-Yamaguchi and Furuichi, 2007), immunogold labeling of all Homer antibodies tested here, with the exception of Homer 1a, was concentrated at the PSDs of asymmetric synapses. The pan Homer 1 antibody labeled the PSDs (arrows in Fig. 2A) located on a neuronal soma, while the plasma membrane was negative and the cytoplasm contained little label (Fig. 2A). In contrast, Homer 1a label was dispersed in neuronal somal and dendritic cytoplasm with no affiliation with PSD (arrows in Fig. 2B), consistent with previous light microscopic observations (Inoue et al., 2004).
Fig. 2. Long and short forms of Homer 1 show different distributions.
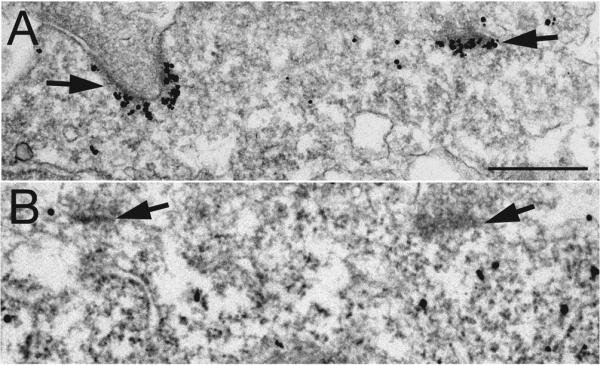
Label for Homer 1b/c (long form) in neuronal soma is localized at PSDs (arrows in A) while label in surrounding cytoplasm is sparse (A). In contrast, label for Homer 1a (short form) is dispersed in the cytoplasm of the soma (B) while PSDs (arrows in B) are not labeled. Scale bar = 0.5 μm.
2.2 PSD labeling of Homer isoforms in different regions of the mouse brain
Homer isoforms are differentially localized in different parts of the brain as elegantly illustrated by Shiraishi et al., 2004, reviewed in Shiraishi-Yamaguchi and Furuichi, 2007. Here we confirm these findings with immunogold EM in perfusion-fixed adult mouse brains where synapses were fixed in their basal states (cf. Tao-Cheng et al., 2007).
In order to compare the patterns and intensities of the labeling for different Homer isoforms, samples representative of different regions of the brain from the same perfusion-fixed animal were processed in parallel for pre-embedding immunogold EM. Since detection sensitivity varies widely among antibodies, comparison of their labeling intensity does not necessarily reflect the relative amount of different proteins. However, when using the same antibody in the same processing run, comparison of the relative labeling intensity among different parts of the brain provides a credible indication of its relative concentration in each location.
Homer 1 (Fig. 3, left column) was detected at PSDs in all four regions of the brain examined, although at different intensities. PSDs were clearly labeled in stratum radiatum of the CA1 area (Fig. 3A, 17.8 ± 1.1 particles/μm PSD), the mossy fiber synapses in the CA3 region of the hippocampus (Fig. 3D, 14.0 ± 0.9 particles/μm PSD), cerebral cortex (Fig. 3G, 15.9 ± 1.3 particles/μm PSD), and weakly labeled in Purkinje spines in the molecular layer of the cerebellum (Fig. 3J, 5.5 ± 0.8 particles/μm PSD). Virtually no label was detected on neuronal plasma membrane.
Fig. 3. Distribution of label for Homer 1, 2 and 3 in different regions of the mouse brain.

Homer 1 (left column) is localized at PSDs in the stratum radiatum of the CA1 (A) and mossy fiber synapses in CA3 (D) regions of the hippocampus, as well as in the cerebral cortex (G). However, label for Homer 1 is less intense at PSDs of Purkinje spines of the cerebellum (J). Label for Homer 2 (middle column) is localized at PSDs in the CA1 region of the hippocampus (B) and cerebral cortex (H), but is weak at mossy fiber synapses in CA3 (E), and is negative at Purkinje spines in cerebellum (K). Homer 3 (right column) is absent at PSDs in CA1 (C) and cerebral cortex (I), but is present at mossy fiber synapses in CA3 (F) and in Purkinje spines in cerebellum (L). Neuronal plasma membrane is typically not labeled for Homer, with the exception of plasma membrane of Purkinje spines (arrows in L). Scale bar = 0.5 μm.
Homer 2 antibody (Fig. 3, middle column) strongly labeled the PSDs in the stratum radiatum of the CA1 area (Fig. 3B, 24.9 ± 2.3 particles/μm PSD) and the cerebral cortex (Fig. 3H, 16.9 ± 1.9 particles/μm PSD), but only weakly labeled mossy fiber synapses in the CA3 region of the hippocampus (Fig. 3E, 4.1 ± 0.8 particles/μm PSD), and did not label PSDs in Purkinje spines (Fig. 3K). Again, no specific label was detected on neuronal plasma membrane.
Labeling for Homer 3 (Fig. 3, right column) was virtually negative for PSDs in the stratum radiatum of the CA1 area (Fig. 3C, 0.02 ± 0.01 particles/μm PSD) and the cerebral cortex (Fig. 3I), but Homer 3 antibody clearly labeled the PSDs of mossy fiber synapses in the CA3 region of the hippocampus (Fig. 3F, 16.5 ± 2.1 particles/μm PSD), and intensely labeled the synapses on Purkinje spines (Fig. 3L, 34.4 ± 2.3 particles/μm PSD). The plasma membrane of the Purkinje spines was sometimes labeled (small arrows in Fig. 3L) at a lower intensity than that of the PSD (not measured). Quantification and statistical analysis of labeling intensity for different Homer isoforms are shown in Fig. 4
2.3 Distribution of different Homer isoforms within PSD
The PSD complex contains various proteins distributed in different lamina (Valtschanoff and Weinberg, 2001; Tao-Cheng, 2012). Here, we examined the distribution of different Homer isoforms within the PSD complex, in both the vertical (perpendicular to post-synaptic membrane) and lateral dimensions. Among positively labeled PSDs, regardless whether the synapses were sampled from intact brains (Fig. 5A, B, C) or in dissociated cultures (Fig. 5D, E, F), label was basically concentrated within the PSD for Homer 1 (Fig. 5A), Homer 1b/c (Fig. 5D), Homer 2 (Fig. 5B, 5E), and Homer 3 (Fig. 5C, 5F). Furthermore, consistent with differential localization of Homer isoforms in different parts of the hippocampus, virtually all PSDs in dissociated hippocampal cultures labeled for Homer 1 and 1b/c, but the percentages of PSDs labeled for Homer 2 and 3 were variable and lower than 70 and 40%, respectively.
Fig. 5. Homer labeling at postsynaptic density (PSD).

Pre-embedding immunogold labeling of perfusion-fixed brain (A, B, C) and dissociated hippocampal cultures (D, E, F) show that four different antibodies distinguishing Homer isoforms are all concentrated at the PSD. Asymmetric synapses were sampled from different regions of the perfusion-fixed brain: (A) Homer 1 labeling from hippocampus, (B) Homer 2 labeling from cerebral cortex, (C) Homer 3 labeling of Purkinje spines in the outer molecular layer of cerebellum. Asymmetric synapses sampled from dissociated hippocampal cultures also show concentrated labeling at the PSD for Homer 1b/c (D), Homer 2 (E) and Homer 3 (F). Bracket in B marks the depth (~30 nm) of the inner layer of dense material at the PSD. Virtually no labeling was detected at the peri-PSD locations (parenthesis in E), or around the periphery of PSD (arrows in F). Scale bar = 0.1 μm.
In the vertical axis of the PSD, measurement of the distance from the center of each particle to the postsynaptic membrane in dissociated hippocampal cultures was plotted as histograms (Fig. 6). Since the distribution is skewed, a non-parametric test was used to compare the median values. Homer 3 was not included because only a low percentage of PSDs in dissociated cultures were labeled. None of the antibodies measured showed any significant differences in their vertical distribution at PSDs. The bulk of label for Homer and Shank was typically located between ~30–100 nm from the postsynaptic membrane, with medians between 52 and 56 nm, which is well outside of the ~ 30 nm thick PSD core (bracket in Fig. 5B to the left of the PSD).
Fig. 6. Histograms of vertical distribution of Homer and Shank at the PSD.
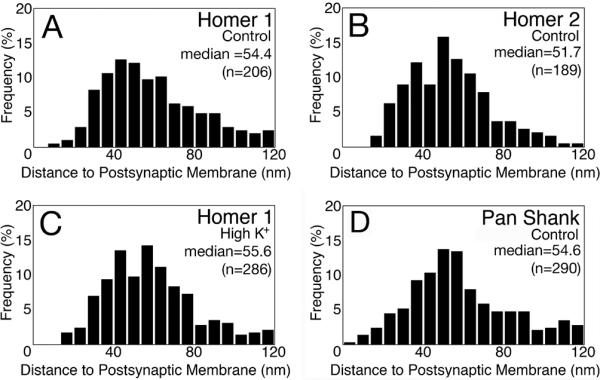
The distances of labels to the postsynaptic membrane were plotted as histograms. Under control conditions, the vertical distribution within the PSD complex is similar for Homer 1 (A), Homer 2 (B), and pan Shank (D). Upon high K+ depolarization, the distribution of Homer 1 did not change within the PSD complex (C). Statistical analysis was carried out with Kruskal-Wallis rank sum test (KaleidaGraph, Synergy Software, Reading, PA) with significance level set at P<0.05. None of the histograms was significantly different from each other.
Along a lateral axis, label for Homer was located within the PSD area (area between two arrows in Fig. 5F), and virtually no label was detected at the peri-PSD locations (area ~60 nm immediately outside of the PSD edge, parenthesis in Fig. 5E). For example, only 3 out of 45 peri-PSD locations in a control sample, and 3 out of 59 peri-PSD locations in the matching high K+ sample, showed any label for Homer 1. Our conclusion that label for Homer is confined to the PSD complex, and largely excluded from peri-PSD locations is consistent with previous EM (Xiao et al., 1998; Tu et al., 1999; Petralia et al., 2001; 2005) and superresolution light microscopy (Dani et al., 2010) observations.
2.4 The distribution of Homer 1 at the PSD complex is unaffected by acute synaptic stimulation
We have previously shown that delayed perfusion fixation of mouse brain produces ultrastructural changes, including thickening and increases in the curvature of PSDs (Tao-Cheng et al., 2007), changes similar to those produced by high K+ depolarization (Dosemeci et al., 2001) and NMDA stimulation (Dosemeci et al., 2002) of cultured hippocampal cells. A fast perfusion fixation yields synapses preserved near their basal state, while a delayed perfusion appears to yield synapses in active states (Tao-Cheng et al., 2007). The dynamic changes at the PSD after stimulation also include redistribution of various proteins at the synapses (Tao-Cheng, 2012). We noticed while examining the distribution of Homer that its labeling pattern did not appear to change whether the mouse was prepared by fast (Fig. 7A) or delayed perfusion (Fig. 7B), suggesting that synaptic Homer might not redistribute during acute synaptic stimulation.
Fig. 7. Distribution of Homer 1 at PSDs does not change after acute synaptic activity.

Intensity of label for Homer 1 at PSDs of mouse cerebral cortex did not appear to change after fast (A) and delayed (B) perfusion fixation. Similarly, in dissociated hippocampal cultures, label for Homer 1 within the PSD complex are the same in the control (C) vs. NMDA treatment (50 μM for 2 min; D; quantified in Fig. 8). PSDs have a thicker appearance after stimulation (B, cf. Tao-Cheng et al., 2007; D, cf. Dosemeci et al., 2001). Scale bar = 0.1 μm
We next tested in the dissociated hippocampal cultures whether Homer at the PSD redistributes upon excitation and measured the immunolabeling intensity of Homer 1 at the PSD. Cultures were used because the activity at synapses can be more precisely manipulated than in mouse brains during perfusion fixation. We concentrated on Homer 1 labeling because, unlike Homer 2 or 3, the Homer 1 isoform is ubiquitous at PSDs throughout the hippocampus. Following 2 min of NMDA (Fig. 7D) or high K+ treatment (Fig. 10E), label for Homer 1 occupied a layer ~30–100 nm from the postsynaptic membrane, as it does in the brain. The vertical distribution of Homer 1 label did not change after high K+ depolarization (Fig. 6C vs. 6A). Furthermore, labeling concentration in the sampling area (within 120 nm of the postsynaptic membrane, see methods) of the PSD complex remained unchanged (Fig. 8, top row; 96.8 ± 4.8% of control value, 5 experiments of high K+; 96.3 ± 1.9% of control value, 4 experiments of NMDA). Thus, Homer 1 does not redistribute at the PSD after 2 minutes of stimulation.
Fig. 10. CaMKII but not Homer is excluded from the PSD complex after EGTA treatment.

CaMKII label (top row) is typically dispersed in the postsynaptic compartment under basal control conditions (A), but aggregates at the PSD complex after high K+ depolarization (B; 90 mM for 2 min). Concentration of CaMKII label decreased in the PSD complex (area up to 120 nm from the postsynaptic membrane) under calcium-free conditions (C; 1 mM EGTA for 2 min). In contrast, the density and distribution of label for Homer 1 (bottom row) remain unchanged in control (D), high K+ (E) or EGTA (F). Scale bar =0.1 μm.
Fig. 8. Amount of label for Homer 1, pan Shank and CaMKII at the PSD complex under different experimental conditions.

Values are normalized to control for each experiment. Number of experiments is indicated at the bottom of each bar. Statistical analysis was carried out with ANOVA (Tukey post test) within each experiment. For Homer 1, not significantly different from control among all cases in all experiments (even at P<0.1). For Shank, control vs. NMDA is significant (P<0.005), as is NMDA vs. recovery (P<0.001). For CaMKII, control vs. high K+ or NMDA are significant (P<0.0001); control vs. EGTA or APV, significant in 2 out of 3 experiments (P< 0.05, 1 exp; P< 0.1, 1 exp).
To determine the effects of stimulation on the long (1b/c) and short (1a) form of Homer 1, experiments using high K+ depolarization were repeated using antibodies to differentiate these forms. PSDs were labeled for the Homer 1b/c antibody (Fig. 5D), and labeling intensity remained unchanged upon high K+ depolarization (95.3 ± 4.4% of control; 2 experiments at 5 min and 1 experiment at 2 min of high K+ treatment). In contrast, no PSD labeling was detected with the Homer 1a antibody, either under control or high K+ conditions (cf. Fig. 2B).
2.5 Homer and Shank at the PSD are differentially affected by acute stimulation
Shank, a Homer binding partner, is another PSD scaffold protein (Tu et al., 1999; Hayashi et al., 2009). We have previously shown that Shank is present at the PSD complex under basal conditions and accumulates at the PSD complex upon high K+ depolarization (~163% of control value; Tao-Cheng et al., 2010). Here, we tested whether Shank also transiently moves toward PSDs upon NMDA treatment. Upon acute NMDA treatment (50 μM for 2 min), label for Shank at the PSD increased to 167 ± 11 % of control value (Fig. 8, middle row; Fig. 9B vs. 9A), and returned to 109 ± 8 % of control after a 30 min washout. Thus, in dissociated hippocampal cultures under identical excitatory conditions (both high K+ depolarization and NMDA treatment), the amount of Shank at the PSD increased while the amount of Homer remained unchanged.
Fig. 9. Shank but not Homer 1 accumulates at the PSD after acute NMDA treatment.

Pan Shank antibody labels the PSD complex as well as nearby cytoplasm (small arrows in A) under control conditions (A), while the density of Shank label at the PSD markedly increases after NMDA treatment (B). In contrast, density of label for Homer 1 (C & D) does not change, either at the PSD or in the nearby cytoplasm (small arrows), upon treatment with NMDA (D). Scale bar = 0.1 μm.
We have also previously shown that the increase in Shank at the PSD upon stimulation likely comes from movement out of nearby cytoplasm (Tao-Cheng et al., 2010; arrows in Fig. 9A). Homer label was also occasionally detected near synapses but outside of the PSD complex (between 120–240 nm from the postsynaptic membrane; arrows in Fig. 9C & D). For example, 15–25% of all PSD sampled had such cytoplasmic label for Homer 1. The occurrence of synapses containing cytosolic label did not change upon stimulation (21.2 ± 1.8% in control vs. 20.0 ± 1.2% in stimulated samples, 5 experiments). Furthermore, no difference in labeling intensity for Homer 1 in this cytoplasmic area outside of the PSD complex was detected (NMDA values were 110 ± 7% of control, 3 experiments) regardless whether the samples were under basal (Fig. 9C) or stimulated (Fig. 9D) conditions. Thus, Shank but not Homer, translocates from nearby cytoplasm to PSD upon acute stimulation.
2.6 Distribution of Homer 1 at the PSD complex is not dependent on calcium concentration
We have previously shown that label for CaMKII rapidly redistributes upon high K+ depolarization (Dosemeci et al., 2001), or NMDA treatment (Dosemeci et al., 2002), and that the distribution of CaMKII label at the PSD complex is a reliable indicator of the activity state of the glutamatergic excitatory synapses. For example, a dispersed distribution of CaMKII label is indicative of synapses at rest (Fig. 10A), and an aggregated distribution of CaMKII label at the PSD is indicative of excited synapses (Fig. 10B; cf. Tao-Cheng et al., 2013). We were surprised to find yet another distribution of CaMKII label when ambient calcium is chelated with EGTA (1 mM for 2 min; Fig. 10C). Approximately one third of the synapses under calcium-free conditions had very little CaMKII label in the PSD complex. The percent of synapses with this local exclusion of CaMKII was significantly higher in EGTA-treated samples (33.5 ± 6.4%; 5 experiments) than in the control (7.1 ± 3.2%; 4 experiments; P<0.005, ANOVA) or in the high K+ samples (0%). While there was a significant increase in density of CaMKII label at the PSD complex upon high K+ depolarization (Fig. 10B vs. 10A; Fig. 8, bottom row; 211 ± 23% of control values), there was a consistent decrease after EGTA treatment (Fig. 10C vs. 10A; Fig. 8, bottom row; 75 ± 9% of control values).
Likewise, the density of CaMKII label significantly increased after NMDA treatment (Fig. 8, bottom row; 204 ± 34% of control values), but consistently decreased after APV treatment to block calcium entry via NMDA receptors (Fig. 11A; Fig. 8, bottom row; 65 ± 13% of control values). Cumulative frequency graphs from one matching experiment where sister cultures were labeled for CaMKII (Fig. 11B) or Homer 1 (Fig. 11D) under control, NMDA and APV treatments further demonstrate the differential distribution of Homer and CaMKII at the PSD. EGTA treatment yielded similar cumulative frequency graphs as APV (graphs not shown). These results demonstrate that the distribution of CaMKII at the PSD complex is dynamically regulated by calcium, and that blocking calcium entry induced CaMKII to be excluded from the PSD complex. In contrast, Homer 1 distribution at the PSD complex did not change either after EGTA treatment (Fig. 10F vs. 10D; Fig. 8, top row; 106 ± 4% of control values), or after APV treatment (Fig. 11C, D; Fig. 8, top row; 101 ± 2% of control values).
Fig. 11. CaMKII but not Homer is excluded from the PSD complex after APV treatment.

After APV treatment (50 mM, 2 min), the amount of CaMKII decreases, and sometimes it is absent from the PSD complex (A), while label for Homer 1 is consistently concentrated at the PSD (C). Cumulative frequency distributions (B, D) show significant differences in the density of label for CaMKII at PSDs between control, NMDA and APV treatment (B; P< 0.005 between control vs. NMDA, and control vs. APV, respectively). In contrast, the density of Homer 1 labeling does not differ significantly under the same experimental conditions (D).
DISCUSSION
The present study uses pre-embedding immunogold to localize Homer in whole mouse brain and in disassociated hippocampal cultures. Our observations yield new insights about the actual distribution of Homer with respect to that of its predicted binding partners. The present study also addresses the question whether Homer, like many other PSD proteins (Tao-Cheng et al., 2012), translocates into or away from the PSD upon acute synaptic activity. Our finding that Homer does not redistribute relative to other PSD proteins may provide insight regarding Homer's potential role as an essential scaffold protein within the PSD.
The long form of Homer occupies a layer ~30–100 nm from the postsynaptic membrane, thereby lying beneath the dense material at the PSD core (within 30 nm to the postsynaptic membrane) where the bulk of label for PSD95 lies (Yang et al. 2011). One of Homer's binding partners, Shank (Tu et al., 1999), occupies the same layer as Homer (Petralia et al., 2005), consistent with the finding that Homer and Shank form a polymeric network (Hayashi et al., 2009) within the PSD. Our finding that label for Homer and Shank peak at ~55 nm from the postsynaptic membrane differs from another study which reported a peak value of Shank label at ~25 nm (Valtschanoff and Weinberg, 2001). This discrepancy could be attributed to different antibodies used as well as different sample preparation and immunolabeling methods.
Other in vitro binding partners of Homer, such as type I mGluR or IP3R, do not closely co-localize with Homer. While many neuronal somal/dendritic plasma membranes label for type I mGluRs (Baude et al., 1993; Luján et al., 1997; Petralia et al., 1998; Kuwajima et al., 2004; 2007), label for Homer spares most plasma membranes, with the exception of Purkinje cell spines. With respect to the lateral distribution of Homer at the PSD, it is virtually absent at peri-PSD locations where type I mGluRs are concentrated (Enz, 2012). If Homer and type I mGluR interact in vivo, these interactions may be limited to the plasma membrane of Purkinje spines or to the very edges of PSDs.
Another major binding partner of Homer, IP3R, is concentrated in smooth endoplasmic reticulum (ER) throughout the cerebellar Purkinje cell, including the spines. Homer at PSDs in these spines lies in close proximity to smooth ER rich in IP3R (Petralia et al., 2001), providing structural evidence of possible interaction sites. However, IP3R and Homer do not precisely co-localize in Purkinje soma by light microscopy (Sandona et al., 2003). Thus, despite the fact that Homer is a binding partner with type I mGluR and IP3R in vitro, our results suggest that there may only be a limited number of special locations within cells where Homer is in position to interact with type I mGluR or IP3R in vivo.
Four prominent PSD proteins–CaMKII, Shank, SynGAP and Homer–occupy a layer of the PSD complex ~30–100 nm from the postsynaptic membrane. Indeed, it is this layer that shows the most structural changes under different excitatory conditions (Tao-Cheng, 2012). The present study demonstrated that unlike CaMKII (Dosemeci et al., 2001) and Shanks (Tao-Cheng et al., 2010) whose concentration at the PSD increases upon synaptic activity and whose distribution is calcium-dependent, the concentration of Homer at the PSD does not change upon acute (2 min) stimulation, and its distribution is independent of calcium concentration. Furthermore, in contrast to SynGAP, which moves out of the PSD core upon acute stimulation (Yang et al., 2011; 2013), the layering and vertical distribution of Homer at PSD remains unchanged.
Our finding that neither the distribution nor amount of label for Homer at the PSD changes upon stimulation is in conflict with other studies that reported changes in Homer distribution (Okabe et al, 2001; Kuriu et al., 2006). One possible explanation for this apparent discrepancy is that the present study only assessed acute (2 min) stimulation, but not longer-term synaptic activation. The latter is required to activate transcription of the short form of Homer proteins (such as Homer 1a), which in turn, can lead to competition with the long form of Homer proteins, and thus, alter their distribution (Shiraishi-Yamaguchi and Furuichi, 2007). For example, distribution of Homer 1c (a long form of Homer 1) undergoes changes within hours of manipulating synaptic activity (Inoue et al., 2007).
The number of Homer puncta (Okabe et al., 2001) and their area (Shiraishi et al., 2003) have been reported to decrease after 10 min of glutamate treatment. We cannot directly compare our findings with these two studies because different stimulation protocols were used. However, these light level observations may not be contradictory with our EM results because the LM studies measured the number and size of Homer puncta, some of which may not be at PSDs, but not the intensity of the label at the puncta. In contrast, EM allows the intensity of the label for Homer within morphologically defined individual PSDs to be measured, but does not assess the total number of Homer puncta, or sort out whether those seen by LM are actually PSDs. Thus, an apparent change in the number and size of Homer puncta seen at the LM level could be consistent with the EM observation that the concentration of Homer at PSDs did not change.
Fluorescence recovery after photobleaching (FRAP) studies (Okabe et al, 2001; Kuriu et al., 2006) of Homer puncta, presumably at synaptic sites, show that Homer enters and leaves puncta, and that in the resting state at least, the frequency of movements to and from these puncta is equal. While it is unknown whether Homer flux occurs at the PSDs, the average amount of Homer label at PSDs did not change under acute stimulation. Thus, although Homer may apparently be in flux at puncta, the total amount of Homer in the PSDs is maintained at stable levels after two minutes of intense synaptic stimulation.
Although other studies have shown that distribution of Homer at synapses can change in response to activity-induced protein synthesis (Shiraishi-Yamaguchi and Furuichi, 2007), the present study illustrates that, in contrast to other PSD proteins, such as CaMKII, Shank, CYLD and SynGAP, the distribution and concentration of Homer at hippocampal postsynaptic densities is not affected by acute changes in calcium levels, depolarization or synaptic stimulation.
Long forms of Homer 1, 2, and 3 are concentrated at the PSD.
Homer occupies domains in synapses different from those of type I mGluRs.
Homer and Shank are co-localized at the PSD, and both lie deep to the dense material.
Homer at the PSD does not redistribute upon acute (2 min) stimulation.
Homer distribution at the PSD is not dependent on calcium concentration.
Acknowledgements
We thank Christine A. Winters for hippocampal neuronal cultures, Virginia Crocker and Rita Azzam for expert EM technical support, Dr. Ayse Dosemeci for helpful discussions and critical reading of the manuscript. Supported by the Intramural Research Program of the NIH, NINDS.
Footnotes
Publisher's Disclaimer: This is a PDF file of an unedited manuscript that has been accepted for publication. As a service to our customers we are providing this early version of the manuscript. The manuscript will undergo copyediting, typesetting, and review of the resulting proof before it is published in its final citable form. Please note that during the production process errors may be discovered which could affect the content, and all legal disclaimers that apply to the journal pertain.
REFERENCES
- Baude A, Nusser Z, Roberts JD, Mulvihill E, McIlhinney RA, Somogyi P. The metabotropic glutamate receptor (mGluR1 alpha) is concentrated at perisynaptic membrane of neuronal subpopulations as detected by immunogold reaction. Neuron. 1993;11:771–787. doi: 10.1016/0896-6273(93)90086-7. [DOI] [PubMed] [Google Scholar]
- Dani A, Huang B, Bergan J, Dulac C, Zhuang X. Superresolution imaging of chemical synapses in the brain. Neuron. 2010;68:843–856. doi: 10.1016/j.neuron.2010.11.021. [DOI] [PMC free article] [PubMed] [Google Scholar]
- Dosemeci A, Reese TS, Petersen J, Tao-Cheng J-H. A novel particulate form of Ca(2+)/calmodulin-dependent protein kinase II in neurons. J Neurosci. 2000;20:3076–3084. doi: 10.1523/JNEUROSCI.20-09-03076.2000. [DOI] [PMC free article] [PubMed] [Google Scholar]
- Dosemeci A, Tao-Cheng J-H, Vinade L, Winters CA, Pozzo-Miller L, Reese TS. Glutamate-induced transient modification of the postsynaptic density. Proc Natl Acad Sci USA. 2001;98:10428–10432. doi: 10.1073/pnas.181336998. [DOI] [PMC free article] [PubMed] [Google Scholar]
- Dosemeci A, Vinade L, Winters CA, Reese TS, Tao-Cheng J-H. Inhibition of phosphatase activity prolongs NMDA-induced modification of the postsynaptic density. J Neurocytol. 2002;31:605–612. doi: 10.1023/a:1025735410738. [DOI] [PubMed] [Google Scholar]
- Dosemeci A, Thein S, Yang Y, Reese TS, Tao-Cheng J-H. CYLD, a deubiquitinase specific for lysine63-linked polyubiquitins, accumulates at the postsynaptic density in an activity-dependent manner. Biochem Biophys Res Commun. 2013;430:245–249. doi: 10.1016/j.bbrc.2012.10.131. [DOI] [PMC free article] [PubMed] [Google Scholar]
- Ehrengruber MU, Kato A, Inokuchi K, Hennou S. Homer/Vesl proteins and their roles in CNS neurons. Mol Neurobiol. 2004;29:213–227. doi: 10.1385/MN:29:3:213. [DOI] [PubMed] [Google Scholar]
- Enz R. Metabotropic glutamate receptors and interacting proteins: evolving drug targets. Curr Drug Targets. 2012;13:145–156. doi: 10.2174/138945012798868452. [DOI] [PubMed] [Google Scholar]
- Foa L, Gasperini R. Developmental roles for Homer: more than just a pretty scaffold. J Neurochem. 2009;108:1–10. doi: 10.1111/j.1471-4159.2008.05726.x. [DOI] [PubMed] [Google Scholar]
- Hayashi MK, Tang C, Verpelli C, Narayanan R, Stearns MH, Xu RM, Li H, Sala C, Hayashi Y. The postsynaptic density proteins Homer and Shank form a polymeric network structure. Cell. 2009;137:159–171. doi: 10.1016/j.cell.2009.01.050. [DOI] [PMC free article] [PubMed] [Google Scholar]
- Inoue Y, Honkura N, Kato A, Ogawa S, Udo H, Inokuchi K, Sugiyama H. Activity-inducible protein Homer1a/Vesl-1S promotes redistribution of postsynaptic protein Homer1c/Vesl-1L in cultured rat hippocampal neurons. Neurosci Lett. 2004;354:143–7. doi: 10.1016/j.neulet.2003.09.082. Erratum in: Neurosci Lett 358:143–147. [DOI] [PubMed] [Google Scholar]
- Inoue Y, Udo H, Inokuchi K, Sugiyama H. Homer1a regulates the activity-induced remodeling of synaptic structures in cultured hippocampal neurons. Neuroscience. 2007;150:841–852. doi: 10.1016/j.neuroscience.2007.09.081. [DOI] [PubMed] [Google Scholar]
- Kuriu T, Inoue A, Bito H, Sobue K, Okabe S. Differential control of postsynaptic density scaffolds via actin-dependent and -independent mechanisms. J Neurosci. 2006;26:7693–7706. doi: 10.1523/JNEUROSCI.0522-06.2006. [DOI] [PMC free article] [PubMed] [Google Scholar]
- Kuwajima M, Hall RA, Aiba A, Smith Y. Subcellular and subsynaptic localization of group I metabotropic glutamate receptors in the monkey subthalamic nucleus. J Comp Neurol. 2004;474:589–602. doi: 10.1002/cne.20158. [DOI] [PubMed] [Google Scholar]
- Kuwajima M, Dehoff MH, Furuichi T, Worley PF, Hall RA, Smith Y. Localization and expression of group I metabotropic glutamate receptors in the mouse striatum, globus pallidus, and subthalamic nucleus: regulatory effects of MPTP treatment and constitutive Homer deletion. J Neurosci. 2007;27:6249–6260. doi: 10.1523/JNEUROSCI.3819-06.2007. [DOI] [PMC free article] [PubMed] [Google Scholar]
- Luján R, Roberts JD, Shigemoto R, Ohishi H, Somogyi P. Differential plasma membrane distribution of metabotropic glutamate receptors mGluR1 alpha, mGluR2 and mGluR5, relative to neurotransmitter release sites. J Chem Neuroanat. 1997;13:219–241. doi: 10.1016/s0891-0618(97)00051-3. [DOI] [PubMed] [Google Scholar]
- Luo P, Li X, Fei Z, Poon W. Scaffold protein Homer 1: implications for neurological diseases. Neurochem Int. 2012;61:731–738. doi: 10.1016/j.neuint.2012.06.014. [DOI] [PubMed] [Google Scholar]
- Okabe S, Urushido T, Konno D, Okado H, Sobue K. Rapid redistribution of the postsynaptic density protein PSD-Zip45 (Homer 1c) and its differential regulation by NMDA receptors and calcium channels. J Neurosci. 2001;21:9561–9571. doi: 10.1523/JNEUROSCI.21-24-09561.2001. [DOI] [PMC free article] [PubMed] [Google Scholar]
- Petralia RS, Zhao HM, Wang YX, Wenthold RJ. Variations in the tangential distribution of postsynaptic glutamate receptors in Purkinje cell parallel and climbing fiber synapses during development. Neuropharmacology. 1998;37:1321–134. doi: 10.1016/s0028-3908(98)00118-x. [DOI] [PubMed] [Google Scholar]
- Petralia RS, Wang YX, Sans N, Worley PF, Hammer JA, 3rd, Wenthold RJ. Glutamate receptor targeting in the postsynaptic spine involves mechanisms that are independent of myosin Va. Eur J Neurosci. 2001;13:1722–1732. doi: 10.1046/j.0953-816x.2001.01553.x. [DOI] [PubMed] [Google Scholar]
- Petralia RS, Sans N, Wang YX, Wenthold RJ. Ontogeny of postsynaptic density proteins at glutamatergic synapses. Mol Cell Neurosci. 2005;29:436–452. doi: 10.1016/j.mcn.2005.03.013. [DOI] [PMC free article] [PubMed] [Google Scholar]
- Sandonà D, Scolari A, Mikoshiba K, Volpe P. Subcellular distribution of Homer 1b/c in relation to endoplasmic reticulum and plasma membrane proteins in Purkinje neurons. Neurochem Res. 2003;28:1151–1158. doi: 10.1023/a:1024264025401. [DOI] [PubMed] [Google Scholar]
- Shiraishi Y, Mizutani A, Bito H, Fujisawa K, Narumiya S, Mikoshiba K, Furuichi T. Cupidin, an isoform of Homer/Vesl, interacts with the actin cytoskeleton and activated rho family small GTPases and is expressed in developing mouse cerebellar granule cells. J Neurosci. 1999;19:8389–8400. doi: 10.1523/JNEUROSCI.19-19-08389.1999. [DOI] [PMC free article] [PubMed] [Google Scholar]
- Shiraishi Y, Mizutani A, Yuasa S, Mikoshiba K, Furuichi T. Glutamate-induced declustering of post-synaptic adaptor protein Cupidin (Homer 2/vesl-2) in cultured cerebellar granule cells. J Neurochem. 2003;87:364–376. doi: 10.1046/j.1471-4159.2003.02003.x. [DOI] [PubMed] [Google Scholar]
- Shiraishi Y, Mizutani A, Yuasa S, Mikoshiba K, Furuichi T. Differential expression of Homer family proteins in the developing mouse brain. J Comp Neurol. 2004;473:582–599. doi: 10.1002/cne.20116. [DOI] [PubMed] [Google Scholar]
- Shiraishi-Yamaguchi Y, Furuichi T. The Homer family proteins. Genome Biol. 2007;8:206. doi: 10.1186/gb-2007-8-2-206. [DOI] [PMC free article] [PubMed] [Google Scholar]
- Soloviev MM, Ciruela F, Chan WY, McIlhinney RA. Molecular characterization of two structurally distinct groups of human homers, generated by extensive alternative splicing. J Mol Biol. 2000;295:1185–1200. doi: 10.1006/jmbi.1999.3436. [DOI] [PubMed] [Google Scholar]
- Sun J, Tadokoro S, Imanaka T, Murakami SD, Nakamura M, Kashiwada K, Ko J, Nishida W, Sobue K. Isolation of PSD-Zip45, a novel Homer/vesl family protein containing leucine zipper motifs, from rat brain. FEBS Lett. 1998;437:304–308. doi: 10.1016/s0014-5793(98)01256-3. [DOI] [PubMed] [Google Scholar]
- Szumlinski KK, Kalivas PW, Worley PF. Homer proteins: implications for neuropsychiatric disorders. Curr Opin Neurobiol. 2006;16:251–257. doi: 10.1016/j.conb.2006.05.002. [DOI] [PubMed] [Google Scholar]
- Tao-Cheng J-H. Activity-Induced Fine Structural Changes of Synapses in Mammalian Central Nervous System. In: Pickel V, Segal M, editors. “Structure and Function of the Synapse”. Neuroscience-net, Elsevier; 2012. [Google Scholar]
- Tao-Cheng J-H, Gallant PE, Brightman MW, Dosemeci A, Reese TS. Structural changes at synapses after delayed perfusion fixation in different regions of the mouse brain. J Comp Neurol. 2007;501:731–740. doi: 10.1002/cne.21276. [DOI] [PubMed] [Google Scholar]
- Tao-Cheng J-H, Dosemeci A, Gallant PE, Smith C, Reese TS. Activity induced changes in the distribution of Shanks at hippocampal synapses. Neuroscience. 2010;168:11–17. doi: 10.1016/j.neuroscience.2010.03.041. [DOI] [PMC free article] [PubMed] [Google Scholar]
- Tao-Cheng J-H, Crocker VT, Winters CA, Azzam R, Chludzinski J, Reese TS. Trafficking of AMPA receptors at plasma membranes of hippocampal neurons. J Neurosci. 2011;31:4834–4843. doi: 10.1523/JNEUROSCI.4745-10.2011. [DOI] [PMC free article] [PubMed] [Google Scholar]
- Tao-Cheng J-H, Yang Y, Bayer KU, Reese TS, Dosemeci A. Effects of CaMKII inhibitor tatCN21 on activity-dependent redistribution of CaMKII in hippocampal neurons. Neuroscience. 2013;244:188–196. doi: 10.1016/j.neuroscience.2013.03.063. [DOI] [PMC free article] [PubMed] [Google Scholar]
- Tu JC, Xiao B, Yuan JP, Lanahan AA, Leoffert K, Li M, Linden DJ, Worley PF. Homer binds a novel proline-rich motif and links group 1 metabotropic glutamate receptors with IP3 receptors. Neuron. 1998;21:717–726. doi: 10.1016/s0896-6273(00)80589-9. [DOI] [PubMed] [Google Scholar]
- Tu JC, Xiao B, Naisbitt S, Yuan JP, Petralia RS, Brakeman P, Doan A, Aakalu VK, Lanahan AA, Sheng M, Worley PF. Coupling of mGluR/Homer and PSD-95 complexes by the Shank family of postsynaptic density proteins. Neuron. 1999;23:583–592. doi: 10.1016/s0896-6273(00)80810-7. [DOI] [PubMed] [Google Scholar]
- Valtschanoff JG, Weinberg RJ. Laminar organization of the NMDA receptor complex within the postsynaptic density. J Neurosci. 2001;21:1211–1217. doi: 10.1523/JNEUROSCI.21-04-01211.2001. [DOI] [PMC free article] [PubMed] [Google Scholar]
- Worley PF, Zeng W, Huang G, Kim JY, Shin DM, Kim MS, Yuan JP, Kiselyov K, Muallem S. Homer proteins in Ca2+ signaling by excitable and non-excitable cells. Cell Calcium. 2007;42:363–371. doi: 10.1016/j.ceca.2007.05.007. [DOI] [PMC free article] [PubMed] [Google Scholar]
- Xiao B, Tu JC, Petralia RS, Yuan JP, Doan A, Breder CD, Ruggiero A, Lanahan AA, Wenthold RJ, Worley PF. Homer regulates the association of group 1 metabotropic glutamate receptors with multivalent complexes of homer-related, synaptic proteins. Neuron. 1998;21:707–716. doi: 10.1016/s0896-6273(00)80588-7. [DOI] [PubMed] [Google Scholar]
- Xiao B, Tu JC, Worley PF. Homer: a link between neural activity and glutamate receptor function. Curr Opin Neurobiol. 2000;10:370–374. doi: 10.1016/s0959-4388(00)00087-8. [DOI] [PubMed] [Google Scholar]
- Yang Y, Tao-Cheng J-H, Reese TS, Dosemeci A. SynGAP moves out of the core of the postsynaptic density upon depolarization. Neuroscience. 2011;192:132–139. doi: 10.1016/j.neuroscience.2011.06.061. Erratum in: Neuroscience 223:487. [DOI] [PMC free article] [PubMed] [Google Scholar]
- Yang Y, Tao-Cheng J-H, Bayer KU, Reese TS, Dosemeci A. CaMKII-mediated phosphorylation regulates distribution of SynGAP α1 and α2 at the postsynaptic density. PLOS ONE. 2013;8:e71795. doi: 10.1371/journal.pone.0071795. [DOI] [PMC free article] [PubMed] [Google Scholar]