

Abstract
Summary: We present a significantly improved version of the flowType and RchyOptimyx BioConductor-based pipeline that is both 14 times faster and can accommodate multiple levels of biomarker expression for up to 96 markers. With these improvements, the pipeline is positioned to be an integral part of data analysis for high-throughput experiments on high-dimensional single-cell assay platforms, including flow cytometry, mass cytometry and single-cell RT-qPCR.
Availability: FlowType and RchyOptimyx are distributed under the Artistic 2.0 license through Bioconductor.
Contact: rbrinkman@bccrc.ca
1 INTRODUCTION
Flow cytometry has undergone a ‘chromatic explosion’ over the past decade and can now measure 17 markers at once for each of hundreds of thousands of individual cells (Chattopadhyay et al., 2008). Since then, mass cytometry has enabled measurement of 30–45 markers/cell (Bendall et al., 2012), whereas single-cell multiplexed RT-qPCR can measure 50–96 messenger RNAs/cell (White et al., 2011). The growth in high-throughput single-cell data continues to outpace development of corresponding bioinformatics techniques (Chattopadhyay et al., 2008). To answer this challenge, we previously developed flowType (Aghaeepour et al., 2012a) and RchyOptimyx (Aghaeepour et al., 2012b). FlowType uses partitioning of cells, either manually or by clustering, into positive or negative for each marker to enumerate all cell types in a sample, e.g. Aghaeepour et al. (2013). RchyOptimyx measures the importance of these cell types by correlating their abundance to external outcomes, such as disease state or patient survival, and distills the identified phenotypes to their simplest possible form. These packages have been used to identify several novel cell populations correlated with HIV outcome (Aghaeepour et al., 2012a). More recently, this pipeline has been used to evaluate standardized immunological panels (Villanova et al., 2013), to optimize lymphoma diagnosis (Craig et al., 2013) and to analyze a range of other clinical data (unpublished data).
However, the higher dimensionality of data produced by mass cytometry generates up to  possible cell types, with an even greater number (up to
  ) for single-cell qPCR; these magnitudes are beyond the capabilities of flowType and RchyOptimyx. Furthermore, flowType and RchyOptimyx have thus far only treated cells as being either positive or negative for a marker. In practice, many biomarkers can have a range of expression levels such as ‘dim’ and ‘bright’. In this application note, we detail architectural improvements to flowType and RchyOptimyx to overcome these limitations.
2 APPROACH
Our primary challenge was to enable flowType to generate a number of cell types tractable on most common workstations (e.g. those with 4–12 GB of RAM). We hereafter denote the original flowType implementation as flowType-BF (brute force) and the new version as flowType-DP (dynamic programming). Whereas flowType-BF completely enumerates all cell types over all  markers, we opted in flowType-DP to use a breadth-first strategy of enumerating all cell types defined over a subset of
  markers. We provide a memory use estimation function to assist users in finding a k that fits within the limits of their hardware. To improve computation time in flowType-DP, we implemented a dynamic programming approach, which exploits the fact that cell types can be arranged into a hierarchy, and membership of any given cell type over n markers is equal to the intersection of one of its parent types (over n−1 markers) with a single-marker cell type. FlowType-DP first enumerates all cell types involving only one marker by simple partitioning and then iterates over
  markers, computing all cell types for each level n by set intersections between corresponding cell types in levels n−1 and 1.
For example, membership of the cell type  CD34− is computed as follows:
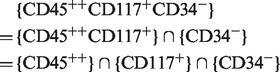 |
To allow partitioning into levels other than positive and negative, we used a string representation for cell types. The string has one integer character for every marker, denoting the partition, or zero if the marker is not used. Values  denote partitions 1 to n. For example, if the set of markers were
  CD3, CD45, CD13, CD117, CD34
 , the cell type
  would be represented by 03021. RchyOptimyx uses a dynamic programing algorithm for efficiently constructing k-shortest paths (Eppstein, 1998). We modified RchyOptimyx’ graph construction component to be able to handle more than one partition per marker.
3 RESULTS AND DISCUSSION
We evaluated flowType-DP against flowType-BF on a 10-marker dataset available from Flow Repository (ID FR-FCM-ZZZK) (Aghaeepour et al., 2012a). FlowType-DP showed a substantial speedup over flowType-BF, which increases exponentially with the number of cells and markers. For example, at 106 cells and 10 markers, flowType-DP is 14 times faster (see Fig. 1a and b). Comparison on larger datasets was not possible due to the limitations of flowType-BF.
Fig. 1.

(a and b) Run time comparison of flowType-DP to flowType-BF in terms of number of cells (a) and number of markers (b). (c and d) Possible thresholds for marker combinations using flowType-DP for typical mass cytometry data (c) and polychromatic flow cytometry data (d). (e and f) Three/four partition flowType-generated RchyOptimyx-visualized cell type hierarchy on a bone marrow sample from a patient with AML. Cell population identification strategy used for SSC and CD45, with the CD34-enriched subset highlighted (e). RchyOptimyx analysis showing CD34 enrichment (f)
We also computed the limits for k on a hypothetical machine with 12 GB of RAM for samples representative of mass cytometry (Fig. 1c) and polychromatic flow cytometry (Fig. 1d), both of which would be intractable for flowType-BF. FlowType and RchyOptimyx are now able, within the memory of a common workstation (12 GB), to analyze 34-marker data.
Finally, to demonstrate the importance of several partitions per marker, we applied flowType and RchyOptimyx to an acute myeloid leukemia (AML) sample from Flow Repository (ID FR-FCM-ZZYA) (Fig. 1e and f). CD34 is a stem cell marker typically expressed on AML blast cells. These blasts are also known to have dimly positive CD45 expression and low side scatter (SSC) (Vial and Lacombe, 2001). By partitioning CD45 and SSC into four and three partitions and naively running flowType and RchyOptimyx to search for CD34-enriched cell types, we were able to find that the SSClowCD45dim cell type had a high proportion of  cells, as expected. This would not have been possible with only two partitions for each of CD45 and SSC.
Funding: ISAC scholar program, CIHR/MSFHR scholarship for strategic training in bioinformatics, UBC 4YF scholarship, NIH/NIBIB (EB008400), Canadian Cancer Society (700374), the Terry Fox Research Institute and the Terry Fox Foundation.
Conflict of Interest: none declared.
REFERENCES
- Aghaeepour N, et al. Early immunologic correlates of HIV protection can be identified from computational analysis of complex multivariate T-cell flow cytometry assays. Bioinformatics. 2012a;28:1009–1016. doi: 10.1093/bioinformatics/bts082. [DOI] [PMC free article] [PubMed] [Google Scholar]
- Aghaeepour N, et al. RchyOptimyx: cellular hierarchy optimization for flow cytometry. Cytometry A. 2012b;81:1022–1030. doi: 10.1002/cyto.a.22209. [DOI] [PMC free article] [PubMed] [Google Scholar]
- Aghaeepour N, et al. Critical assessment of automated flow cytometry data analysis techniques. Nat. Methods. 2013;10:228–238. doi: 10.1038/nmeth.2365. [DOI] [PMC free article] [PubMed] [Google Scholar]
- Bendall SC, et al. A deep profiler’s guide to cytometry. Trends Immunol. 2012;33:323–332. doi: 10.1016/j.it.2012.02.010. [DOI] [PMC free article] [PubMed] [Google Scholar]
- Chattopadhyay PK, et al. A chromatic explosion: the development and future of multiparameter flow cytometry. Immunology. 2008;125:441. doi: 10.1111/j.1365-2567.2008.02989.x. [DOI] [PMC free article] [PubMed] [Google Scholar]
- Craig F, et al. Computational analysis optimizes the flow cytometric evaluation for lymphoma. Cytometry B Clin. Cytom. 2013 doi: 10.1002/cytob.21115. [Epub ahead of print, doi: 10.1002/cytob.21115] [DOI] [PubMed] [Google Scholar]
- Eppstein D. Finding the k shortest paths. SIAM J. Comput. 1998;28:652–673. [Google Scholar]
- Vial JP, Lacombe F. Immunophenotyping of acute leukemia: utility of CD45 for blast cell identification. Methods Cell Biol. 2001;64:343–358. doi: 10.1016/s0091-679x(01)64021-4. [DOI] [PubMed] [Google Scholar]
- Villanova F, et al. Integration of lyoplate based flow cytometry and computational analysis for standardized immunological biomarker discovery. PLoS One. 2013;8 doi: 10.1371/journal.pone.0065485. [DOI] [PMC free article] [PubMed] [Google Scholar]
- White AK, et al. High-throughput microfluidic single-cell RT-qPCR. Proc. Natl Acad. Sci. USA. 2011;108 doi: 10.1073/pnas.1019446108. [DOI] [PMC free article] [PubMed] [Google Scholar]