Abstract
Background
We set out to determine functional white matter (WM) connections passing through the canine corpus callosum useful for subsequent studies of canine brains that serve as models for human WM pathway disease. Based on prior studies, we anticipated that the anterior corpus callosum would send projections to the anterior cerebral cortex while progressively posterior segments would send projections to more posterior cortex.
Methods
A post mortem canine brain was imaged using a 7T MRI producing 100 micron isotropic resolution DTI analyzed by tractography. Using ROIs within cortical locations, which were confirmed by a Nissl stain that identified distinct cortical architecture, we successfully identified 6 important WM pathways. We also compared fractional anisotropy (FA), apparent diffusion coefficient (ADC), radial diffusivity (RD), and axial diffusivity (AD) in tracts passing through the genu and splenium.
Results
Callosal fibers were organized based upon cortical destination, i.e. fibers from the genu project to the frontal cortex. Histologic results identified the motor cortex based on cytoarchitectonic criteria that allowed placement of ROIs to discriminate between frontal and parietal lobes. We also identified cytoarchitecture typical of the orbital frontal, anterior frontal, and occipital regions and placed ROIs accordingly. FA, ADC, RD and AD values were all higher in posterior corpus callosum fiber tracts.
Conclusions
Using 6 cortical ROIs, we identified 6 major white matter tracts that reflect major functional divisions of the cerebral hemispheres and we derived quantitative values that can be used for study of canine models of human WM pathological states.
1. INTRODUCTION
Diffusion tensor imaging (DTI) is an advanced MR imaging method that allows quantitative measurement of the magnitude and direction of microscopic water diffusion. From these measurements, one can make determinations regarding the integrity of brain structures, most notably of brain white matter (WM). DTI has become an important tool in studying the human brain especially for understanding the development of WM and diseases that either cause failure of development, or deterioration, of WM [1–3]. The major DTI indices that are routinely measured include apparent diffusion coefficient (ADC, a measure of rate of water motion), fractional anisotropy (FA, a measure of tendency of water motion to predominantly diffuse in a non-random manner), radial diffusivity (RD, a measure of microscopic water motion perpendicular to the axons generally considered to be a measure of myelination), and axial diffusivity (AD, a measure of microscopic water motion parallel to axons). Tractography is a method by which white matter (WM) tracts can be depicted based on the magnitude and direction of diffusion anisotropy [4]. Analysis of tracts depicted by this technique can provide information regarding normal WM structure as well as the impact of neurological diseases on WM integrity and track position.
Use of DTI to study the canine brain has been under-explored. However, understanding of canine WM has a number of potential advantages for understanding the human brain due to inherent similarities. For instance, the aging canine brain is characterized by the frequent development of amyloid plaques and amyloid angiopathy, similar to the aging human brain [5]. Dogs naturally experience many of the same brain diseases that affect the human brain, such as stroke, gliomas, trauma and encephalitis [6–9]. Many canine leukodystrophy populations exist including disease models for mucopolysaccharidosis type[10], Krabbe disease [11], and GM1 gangliosidosis [12]. Importantly, these models can be used to test novel therapies for central nervous system diseases in a relatively accessible population that simulates human disease, thereby facilitating introduction of such therapies for treatment of humans [2].
The canine brain is a very good model to study white matter pathology because the anatomic structure is that of a gyrencephalic brain and has similar topography to the human brain. A number of investigators have used MR imaging to effectively analyze the pathologic canine brain [13–17]. Recently a canine model of dysmyelination, the shaking pup, was studied using a combination of conventional diffusion tensor imaging and high b-value diffusion-weighted imaging methods and demonstrated that DTI may be used to study myelin abnormalities and brain development in canines [18]. In this study we analyze high-resolution normal ex vivo canine DTI by segmenting the corpus callosum, a large white matter structure, based upon cortical tract destination using fiber tractography. Our study of normal canine tractography provides control data for future studies of canine CNS diseases using DTI.
2. METHODS
2.1 SPECIMEN PREPARATION
One normal post mortem adult canine brain was received from the University of Georgia following an unrelated experiment. The protocol was approved and performed under the guidelines of the university animal welfare board (IACUC). The dog was previously assessed to be normal based on clinical neurological examination, routine hematology and serum chemistry following by standard 3T MR imaging and CSF analysis. Prior to sacrifice, the canine was deeply anesthetized with Nembutal (200 mg/kg) and monitored until corneal reflexes were absent, respiration had stopped, and cardiac rhythms were interrupted. The canine was first exsanguinated by transcardial perfusion with 0.9% sodium chloride in 0.1 M sodium phosphate buffer, pH 7.4, with 0.5% sucrose, then submitted to transcardial perfusion first with 4% paraformaldehyde and finally with 10% sucrose buffered in 0.1 M sodium phosphate buffer. The brain was removed and placed in 10% sucrose buffered in 0.1 M sodium phosphate buffer. During the two weeks prior to imaging the brain was soaked in 1% MR contrast material (gadoteridol; Bracco pharmaceuticals) in 0.1 M phosphate-buffered saline. This process allows the contrast material to diffuse into brain tissue, which shortens the T1 relaxation time of tissue, allowing one to scan with a shorter TR and thus decrease scan time.
2.2 IMAGING
All canine imaging experiments were performed on a 7T small animal MRI system (Magnex Scientific, Yarnton, Oxford, England) equipped with 670 mT/m Resonance Research gradient coils (Resonance Research, Inc., Billerica, MA, USA), and controlled with a General Electric Signa console (GE Medical Systems, Milwaukee, WI, USA). RF transmission and reception was achieved using a 6 cm diameter quadrature RF coil (M2M Imaging, Cleveland, OH).
Diffusion-weighted images were acquired using a custom-designed spin-echo diffusion-weighted pulse sequence (TR = 100 ms, TE = 16.2 ms, NEX = 1). The acquisition matrix was 800 × 500 × 500 over an 80 × 50 × 50 mm field of view (FOV) for a Nyquist limited isotropic voxel size of 100 μm. Diffusion preparation was accomplished using a modified Tanner-Stejskal diffusion-encoding scheme with a pair of unipolar, half-sine diffusion gradient waveforms (width [d] = 3 ms, separation [D] = 8.5 ms, gradient amplitude = 600 mT/m). Two b0 images and 6 high b-value images (b=1492 s/mm2) were acquired with diffusion sensitization along each of 6 non-collinear diffusion gradient vectors: [1, 1, 0], [1, 0, 1], [0, 1, 1], [−1, 1, 0], [1, 0, −1], and [0, −1, 1]. Total acquisition time was approximately 40 hours. A spin-echo sequence using solely six directions was employed because it provides high SNR and is also less prone to artifacts and distortions due to magnetic field inhomogeneity than multi-shot EPI. Additionally, the use of gadoteridol to prepare our brain specimen for imaging reduces T2* to the extent that multi-shot approaches such as EPI are no longer feasible.
2.3 DATA PROCESSING
Following imaging, we smoothed the data using the SUSAN denoising algorithm implemented in FSL with a 3 voxel kernel radius. Although the entire brain was imaged intact, we chose to focus our analysis on the left hemisphere to simplify tensor calculations. FA, ADC, Eigenvalue, and Eigenvector maps were reconstructed using Diffusion Toolkit (DTK) version 0.6.1. DTK was also used to calculate fiber tracts using a FACT algorithm, FA greater than 0.2, and a turning angle of 60 degrees. Fiber tracts were visualized using Trackvis version 0.5.1. Separate tracts were identified by drawing three dimensional regions of interest on a b0 or FA image in Avizo version 6.3.0 and importing these ROIs into Trackvis. Fiber tracts determined to be part of adjacent structures, such as the cingulum or fornix were removed from subsequent analysis. All included and excluded fibers were verified by a neuroscientist with substantial neuroanatomy experience (LW). Quantitative fiber tract measures including mean FA, ADC, AD and RD values were recorded using Trackvis.
2.4 ROI PLACEMENT AND TRACT GENERATION
In a manner similar to studies in humans, the fiber tracts traversing the corpus callosum were identified by first drawing a large ROI around the entire corpus callosum and then drawing ROIs on six cortical regions [19]. The primary ROI covered the corpus callosum drawn on 19 contiguous sagittal b0 images directly to the left of midline. Six secondary ROIs were drawn and labelled orbital frontal (OF), anterior frontal (AF), superior frontal (SF), parietal (Par), occipital (Occ), and temporal (Tem) as detailed below (figure 1). This was done to identify white matter tracts that projected to functionally distinct domains of the canine cerebral cortex.
Figure 1. Relative ROI positions.
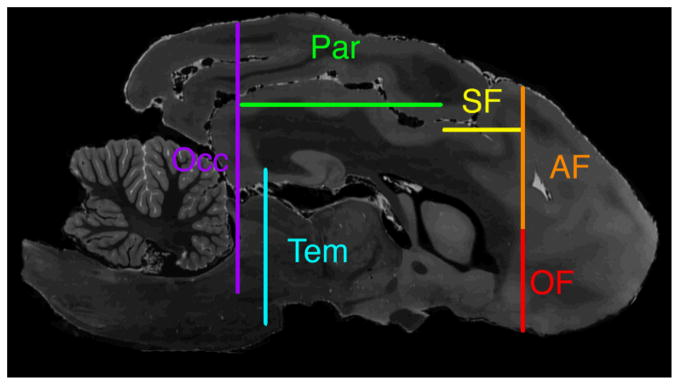
Sagittal T2-weighted MR image shows relative positions of cross sections of all ROIs. Orbital frontal ROI (OF) is shown in red, anterior frontal ROI (AF) in orange, superior frontal ROI (SF) in yellow, parietal ROI (Par) in green, occipital ROI (Occ) in purple, and temporal ROI (Tem) in blue.
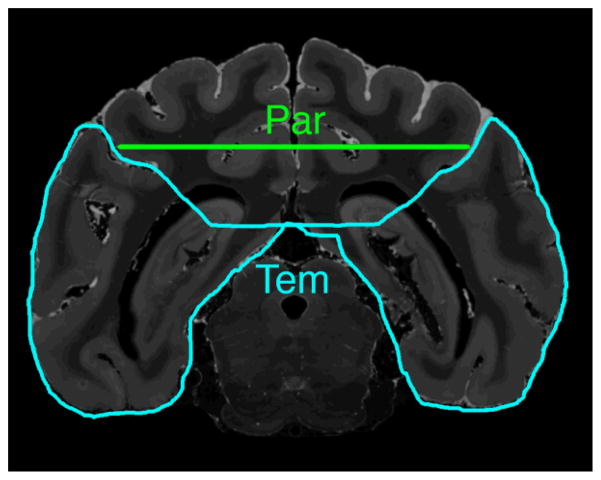
On a coronal plane one quarter of the way from the anterior genu to the most anterior part of the brain, the AF and OF ROIs were drawn separated at the level of the most inferior portion of the pre-Sylvian sulcus (figure 2). The post-Sylvian sulcus was identified on an axial image at the level of the inferior splenium. A coronal image at the level of the post-Sylvian sulcus was used to draw the Occ ROI (figure 3). The Tem ROI was drawn on a coronal image at the level of the posterior splenium (figure 4). Medially the ROI was below an axial plane at the level of the inferior splenium and laterally the ROI included cerebral cortex superiorly to the suprasylvian sulcus. The SF ROI was drawn on the axial image at the dorsal aspect of the lateral ventricles (figure 5). The posterior boundary was at the posterior margin of the post-cruciate sulcus, the lateral boundary was the coronal sulcus, and the anterior boundary was the AF ROI. The Par ROI was drawn on the axial image superior to cingulate white matter from the Occ ROI posteriorly to the SF ROI anteriorly excluding cortex lateral to the suprasylvian sulcus (figure 5).
Figure 2. Images showing use of histological sections to validate site for placement of anterior frontal (AF) and orbital frontal (OF) ROIs.
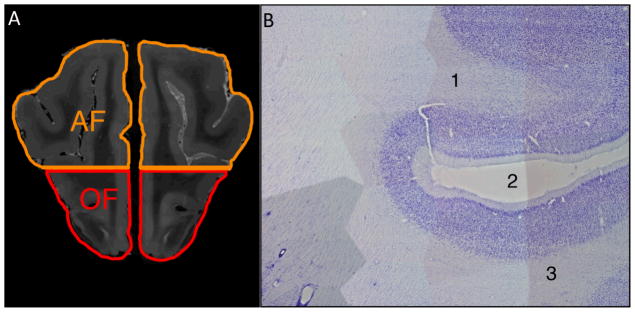
A) Coronal T2-weighted MR image located one-fourth of the distance from the genu to the anterior frontal cortex shows the AF and OF ROIs separated at the level of the inferior border of the pre-Sylvian sulcus, through which the horizontal line passes.
B) Parasagittal 50 micron Nissl-stained section of the canine brain that underwent MR imaging used to confirm ROI placement shows the characteristic features of the (1) AF region, (2) the pre-Sylvian sulcus, and (3) the OF region. Both the AF and OF typically have the prominent staining of layer II, poorly defined layer IV, and a thin layer V, with medium sized pyramidal neurons shown in this image. Identification of the pre-Sylvian sulcus and adjacent AF and OF regions confirmed proper placement of the ROIs shown in A.
Figure 3. Use of histological sections to validate site for placement of occipital ROI.
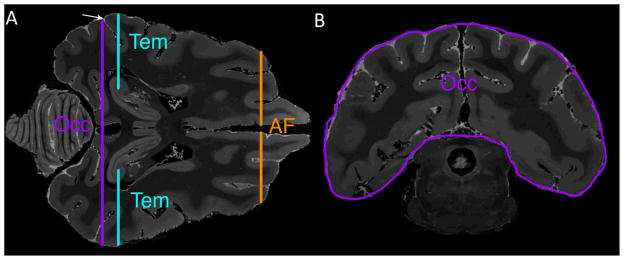
A) Axial T2-weighted image at the level of the inferior splenium is used to identify the post-Sylvian sulcus marked by an arrow. The occipital lobe (Occ), temporal lobe (Tem), and anterior frontal (AF) ROIs are shown in cross section.
B) Coronal T2-weighted MR image at the level of the post-Sylvian sulcus shows the occipital lobe ROI (Occ).
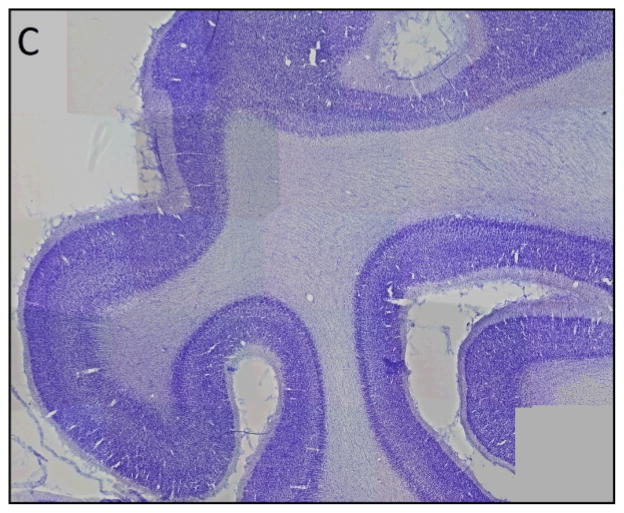
C) Parasagittal 50 micron Nissl-stained section corresponding to MR images in A and B shows the characteristic appearance of the occipital cortex (i.e., prominent staining of layer IV), thus validating placement of the ROIs shown in A and B.
Figure 4. Temporal lobe ROI placement.
Coronal T2-weighted MR image at the level of the posterior splenium shows the temporal lobe ROI (Tem) outlined in blue and a cross section of the parietal lobe ROI (Par) in green.
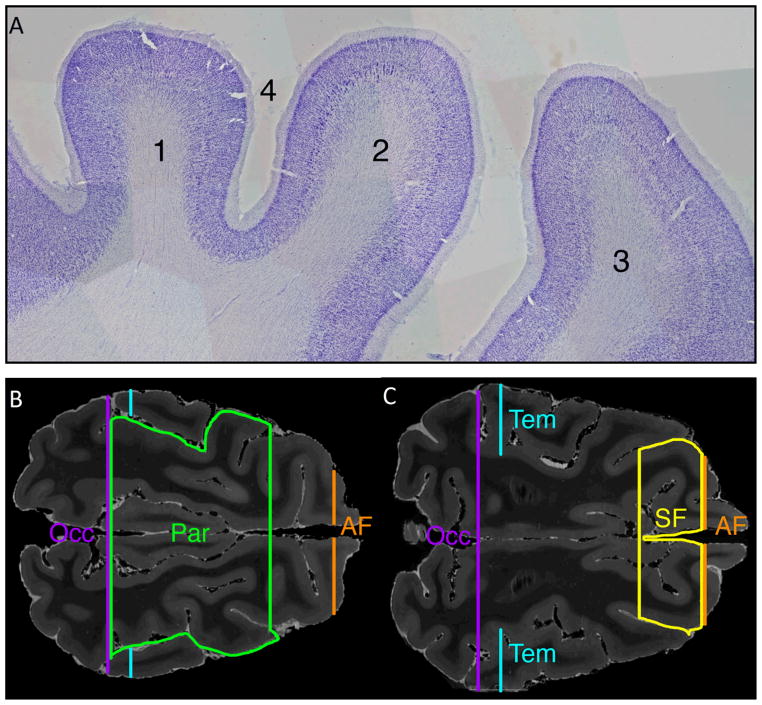
Figure 5. Images showing use of histological sections to validate site for placement of superior frontal (SF) and parietal lobe (Par) ROI placement.
A) Parasagittal 50 micron Nissl-stained section showing (1) parietal cortex with characteristic absence of large layer V pyramidal cells and Betz cells, (2) primary motor cortex (characterized by presence of large layer V pyramidal cells and Betz cells), (3) premotor cortex, and (4) post-cruciate sulcus. The sulcus separating the primary motor cortex and parietal cortex regions was used to delineate the SF and Par ROIs.
B) T2-weighted axial MR image at the level of the superior cingulate white matter shows the Par ROI in green. The histological features in A, demarcating the parietal cortex and frontal cortex, were used to confirm placement of the Par ROI, which is bounded posteriorly by the occipital (Occ) ROI, laterally by the supra-Sylvian sulcus, and anteriorly by the post-cruciate sulcus. Also shown in cross section are the Occ ROI (in purple), temporal ROI (Tem, in blue) and anterior frontal ROI (AF, in orange).
C) T2-weighted axial MR image at the superior border of the lateral ventricles shows the SF ROI in yellow. The SF ROI is bounded anteriorly by the AF ROI, laterally by the coronal sulcus, and posteriorly by the post-cruciate sulcus. Also shown in cross section are the Occ ROI (purple), Tem ROI (blue) and AF ROI (orange).
Aberrant fibers were manually removed based on known white matter anatomy common to all mammalian brains [20]. As expected from use of this technique, peripheral fibers were not adequately depicted [19].
2.5 HISTOLOGY
Following imaging, the left half of the canine brain was sectioned into 50 micron thick frozen sections in the sagittal plane. Sections were mounted on glass slides, defatted, and stained with thionine. Magnified images were taken using the 4× objective from a Nikon eclipse E400 microscope fitted with a 2 megapixel Optronics microfire camera run by Optronics Pictureframe software. These images were smoothed with a bandpass filter in ImageJ in order to facilitate the construction of figures 2b, 3c, and 5a using the photomerge tool in Adobe Photoshop CS6.
3. RESULTS
3.1 CANINE CORPUS CALLOSUM TRACTOGRAPHY
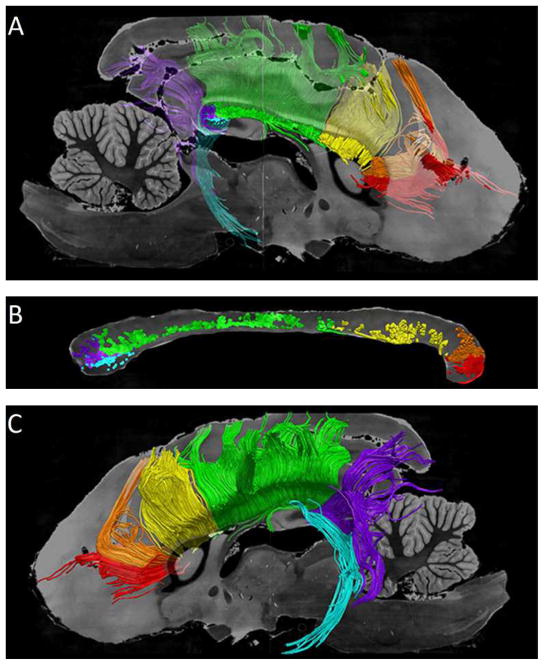
The canine tractography results are shown in figure 6. The frontal projections are divided into orbital frontal, anterior frontal, and superior frontal which are labeled in red, orange and yellow respectively. One ROI is used to identify the parietal projections which are labeled in green. The occipital and temporal projections are shaded in purple and light blue respectively. Figure 6 shows the three dimensional path of the callosal projections which follow previously described white matter pathways. Figure 6B shows the location to which cortical fibers project in the midsagittal corpus callosum. This organization follows a similar anterior to posterior pattern as prior human studies however the relative volume each cortical destination occupies does differ [19, 21, 22]. Most notably, the human frontal projections occupy a greater proportion of the corpus callosum than in the canine specimen. This reflects the smaller and less developed frontal cortex of the canine as compared to a human.
Figure 6. Segmented tracts of the canine corpus callosum in the left hemisphere.
The following six callosal projections are shown: orbital frontal (OF) in red, anterior frontal (AF) in orange, superior frontal (SF) in yellow, parietal (Par) in green, occipital (Occ) in purple, and temporal (Tem) in blue.
A) The medial side of the six segmented tracts of the corpus callosum is shown superimposed on a semi-translucent parasagittal T2 weighted MR image.
B) Sagittal T2 weighted MR image of the canine corpus callosum is color-coded based upon the cortical destination of fiber tracts within the corpus callosum.
C) Lateral aspect of the six segmented tracts superimposed on a parasagittal T2-weighted MR image.
3.2 DIFFUSION TENSOR IMAGING METRICS
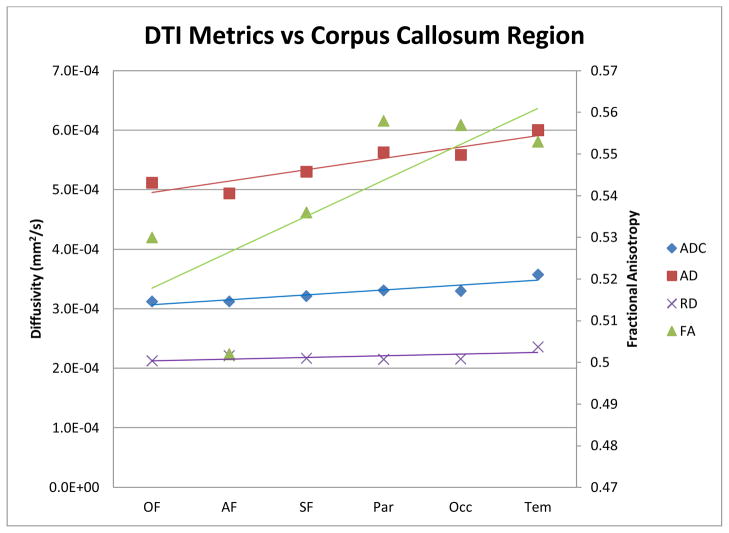
The FA, ADC, AD, and RD values in the canine fiber tracts subserving the OF, AF, SF, Par, Occ, and Tem regions are shown in figure 7. These canine results were similar to prior human studies, FA was found to be higher in the human posterior callosal projections compared with the anterior projections [19, 21], although this was not found in rhesus monkeys [23]. Interestingly, ADC was higher in the posterior WM tracts even though FA was also higher; typically high FA values are associated with low ADC values [24]. RD and AD were also both found to increase moving from anterior to posterior however, the increase in AD was much greater.
Figure 7. DTI metrics versus segmented region of the canine corpus callosum.
FA, ADC, RD and AD are plotted for each segmented region of the corpus callosum. A line of best fit is plotted for each measure. The posterior callosal regions have a higher FA, ADC, RD, and AD as compared to the anterior regions of the corpus callosum.
3.3 HISTOLOGY
Utilizing the Nissl-stained brain sections, we were able to identify important cytoarchictetural landmarks that assisted in the development of the ROIs. Figure 5 shows features characteristic of motor cortex, i.e., an absent layer IV and the presence of Betz cells, large pyramidal cell bodies in layer V [25–27]. Posterior to this is the parietal cortex which demonstrates a well-defined layer IV but lacks Betz cells [25, 27]. These findings guided the placement of the Par and SF ROIs. The anterior cortex near the pre-Sylvian sulcus shows a characteristic prominent staining of layer II, a poorly defined layer IV and a thin layer V with medium sized pyramidal neurons (figure 2) [28, 29]. The prominent layer IV of the visual cortex is depicted in figure 3 [25]. While previously described surface landmarks were important in formulating the Occ, AF, and OF ROIs, these cytoarchitectural findings delineating functional cortical areas confirmed our ROI placement [30–33].
4. DISCUSSION
The corpus callosum has been studied and segmented in the human brain in order to better understand its function [19, 21, 22, 34, 35]. In various MR imaging studies, the human corpus callosum has been divided in various ways, including division based upon fixed-ratios [34, 35], gross morphologic components (based on identification of major structures such as the genu and splenium) [24, 36], and functional partitioning based upon tractography designed using target regions in the cerebral cortex [19, 21, 22]. The fixed-ratio method partitions the corpus callosum into segments based on lines drawn from external reference points through the corpus callosum [34]. This method is difficult to adapt to canine brains because generally the homology between species is insufficient to allow reliable comparisons. Similarly, division of the corpus callosum based on morphological criteria is made difficult by the presence of differences in size and shape of corpus callosum components in various species. Tractography-based segmentation offers a reasonable alternative to the previously-mentioned methods. It allows partitioning of the corpus callosum based on the destination of traversing fibers with respect to functional divisions of the cerebral cortex, which is more comparable between species. For this reason, we chose to employ that method in our study. However, proper use of this method required correct identification of target regions in the corpus callosum, which is difficult for MR images of the canine brain, given the relative paucity of MR studies of the canine brain. We overcame this difficulty by relying on histological sections of the same canine brain that underwent MR imaging. Utilizing cytoarchitectonic methods, we were able to validate the ROI placement which was fundamental to the segmentation of the corpus callosum. We were thus able to validate our ROI placements on the anterior frontal, orbital frontal, superior frontal, superior parietal and occipito-temporal regions by histological features. Nissl-stained tissue sections, depicting key cytoarchitectural landmarks (such as Betz cells in the motor cortex), provided detailed anatomic information to ensure the accuracy of the segmented tracts, thereby allowing us to adapt human corpus callosum segmentation procedures to the canine brain.
The methods used in our study to segment the corpus callosum have also been used in non-human primates. For instance, the corpus callosum of the chimpanzee [37]and rhesus monkey [23] have been segmented based upon fiber destination using tractography. The secondary ROIs in these studies were placed using surface anatomy landmarks based upon prior histological studies in similar species [38, 39]. The study in chimpanzees also found a predilection for fibers in the posterior portion of the corpus callosum, projecting to the parietal, temporal and occipital cortices, to be higher than in the remainder of the corpus callosum, similar to our study [37]. However, the study of rhesus monkeys found the parietal and temporal fibers to have slightly lower FA values than in the frontal regions and the occipital region [23].
Many white matter diseases can be studied using DTI and tractography. One of particular interest is mucopolysaccharidosis type I, a genetic disorder due to a deficiency of alpha-L iduronidase and characterized by accumulation of glycosaminoglycans in multiple organ systems [40]. A result is impaired myelin formation. A canine model of this human disease exists and is currently used to study possible therapies, such as enzyme replacement therapy [10, 13]. Tractography-based analysis is a potential means for assessment of the efficacy of interventions in this disease. Because the disease impairs myelination, one might expect to see untreated animals with elevated RD and reduced FA within the corpus callosum [41, 42]. Because degree of myelination can vary within the corpus callosum, disease severity may be more pronounced in certain regions [43]. A positive treatment response would be expected to show decreased RD and increased FA compared to pre-treatment baseline values. This approach is potentially beneficial for mucopolysaccharidosis type I, other canine leukodystrophy models, and any studies evaluating the canine corpus callosum.
We took a number of precautions to optimize the image and tractography quality in our experiment. It is known that DTI tractography can be impaired by noise and artifacts [20, 44]. Because we imaged a postmortem brain, we were able to use imaging parameters and imaging times not available for in vivo imaging. Imaging an ex vivo specimen in our study eliminated specimen motion artifact due to pulsation reducing the need for more than six imaging directions. Furthermore, it is well-recognized that the quality of DTI tractography can be diminished by the presence of crossing fibers and tract-splitting [19, 20, 44]. We minimized the effects of these factors by a prolonged imaging time (approximately 40 hours) on a very high field-strength (7T) magnet. These imaging parameters provided very high spatial resolution (i.e., 100 microns), which is much higher than in previous canine DTI studies. We immersed the specimen in an MR contrast agent for a period of two weeks prior to imaging, which produced a shorter T1 relaxation time, allowing a shorter TR and a higher spatial resolution for our scan time. The higher isotropic spatial resolution minimized the likelihood of multiple different, and possibly orthogonal, fiber directions in a single voxel [4, 45, 46].
4.1 LIMITATIONS
Like any study, ours is subject to a number of limitations. The first limitation is that we performed imaging on solely a single specimen. Thus, the reproducibility of our results has yet to be determined. However, we will assess this limitation by scanning additional specimens in the near future. A second limitation is that of the tractography process that we utilized, which inhibits adequate depiction of peripheral tracts due to truncation of peripheral fibers (a known limitation of the simple tensor model)[19]. Third, tract propagating algorithms are known to accumulate error during the tract generation procedure [47]. Future comparison of scans of canines using identical tractography procedures will minimize these biases. A final limitation is our use of DTI-based tractography rather than other imaging techniques that are currently being developed to provide more accurate tractography. Variations of DTI such as high angular resolution diffusion imaging (HARDI), Q-Ball imaging, and diffusion spectrum imaging (DSI) offer potential advantages over the simple single tensor model we used because they are more capable of resolving complex WM regions. However, some of the gains offered by these techniques are partially offset by sacrifice of spatial resolution. In addition, the HARDI and DSI techniques require complex probabilistic tractography, which produces an increase in computational demand [18, 44, 47–49]. While there is potential that HARDI and DSI may prove superior to high resolution DTI for tractography, we currently prefer DTI due to the ease of use as well as its already widespread clinical use making these results more widely applicable [49, 50].
4.2 CONCLUSIONS
The canine corpus callosum can be segmented into 6 major white matter tracts, using high resolution DTI-based fiber tractography, which reflects major functional divisions of the cerebral hemispheres. This procedure may be beneficial for the future study of white matter pathology in canine models of human diseases.
References
- 1.Guo AC, Petrella JR, Kurtzberg J, Provenzale JM. Evaluation of white matter anisotropy in Krabbe disease with diffusion tensor MR imaging: initial experience. Radiology. 2001;218:809–815. doi: 10.1148/radiology.218.3.r01mr14809. [DOI] [PubMed] [Google Scholar]
- 2.Dickson PI, Pariser AR, Groft SC, et al. Research challenges in central nervous system manifestations of inborn errors of metabolism. Molecular genetics and metabolism. 2011;102:326–338. doi: 10.1016/j.ymgme.2010.11.164. [DOI] [PMC free article] [PubMed] [Google Scholar]
- 3.McGraw P, Liang L, Escolar M, Mukundan S, Kurtzberg J, Provenzale JM. Krabbe disease treated with hematopoietic stem cell transplantation: serial assessment of anisotropy measurements--initial experience. Radiology. 2005;236:221–230. doi: 10.1148/radiol.2353040716. [DOI] [PubMed] [Google Scholar]
- 4.Nucifora PG, Verma R, Lee SK, Melhem ER. Diffusion-tensor MR imaging and tractography: exploring brain microstructure and connectivity. Radiology. 2007;245:367–384. doi: 10.1148/radiol.2452060445. [DOI] [PubMed] [Google Scholar]
- 5.Czasch S, Paul S, Baumgartner W. A comparison of immunohistochemical and silver staining methods for the detection of diffuse plaques in the aged canine brain. Neurobiology of aging. 2006;27:293–305. doi: 10.1016/j.neurobiolaging.2005.02.017. [DOI] [PubMed] [Google Scholar]
- 6.Garosi LS, McConnell JF. Ischaemic stroke in dogs and humans: a comparative review. The Journal of small animal practice. 2005;46:521–529. doi: 10.1111/j.1748-5827.2005.tb00281.x. [DOI] [PubMed] [Google Scholar]
- 7.Wisner ER, Dickinson PJ, Higgins RJ. Magnetic resonance imaging features of canine intracranial neoplasia. Veterinary radiology & ultrasound: the official journal of the American College of Veterinary Radiology and the International Veterinary Radiology Association. 2011;52:S52–61. doi: 10.1111/j.1740-8261.2010.01785.x. [DOI] [PubMed] [Google Scholar]
- 8.Schaudien D, Polizopoulou Z, Koutinas A, et al. Leukoencephalopathy associated with parvovirus infection in Cretan hound puppies. Journal of clinical microbiology. 2010;48:3169–3175. doi: 10.1128/JCM.01582-09. [DOI] [PMC free article] [PubMed] [Google Scholar]
- 9.Pettigrew R, Fyfe JC, Gregory BL, et al. CNS hypomyelination in Rat Terrier dogs with congenital goiter and a mutation in the thyroid peroxidase gene. Veterinary pathology. 2007;44:50–56. doi: 10.1354/vp.44-1-50. [DOI] [PubMed] [Google Scholar]
- 10.Dickson P, McEntee M, Vogler C, et al. Intrathecal enzyme replacement therapy: successful treatment of brain disease via the cerebrospinal fluid. Molecular genetics and metabolism. 2007;91:61–68. doi: 10.1016/j.ymgme.2006.12.012. [DOI] [PMC free article] [PubMed] [Google Scholar]
- 11.Victoria T, Rafi MA, Wenger DA. Cloning of the canine GALC cDNA and identification of the mutation causing globoid cell leukodystrophy in West Highland White and Cairn terriers. Genomics. 1996;33:457–462. doi: 10.1006/geno.1996.0220. [DOI] [PubMed] [Google Scholar]
- 12.Kondagari GS, Ramanathan P, Taylor R. Canine fucosidosis: a neuroprogressive disorder. Neuro-degenerative diseases. 2011;8:240–251. doi: 10.1159/000322541. [DOI] [PubMed] [Google Scholar]
- 13.Kakkis E, McEntee M, Vogler C, et al. Intrathecal enzyme replacement therapy reduces lysosomal storage in the brain and meninges of the canine model of MPS I. Molecular genetics and metabolism. 2004;83:163–174. doi: 10.1016/j.ymgme.2004.07.003. [DOI] [PubMed] [Google Scholar]
- 14.Kaye EM, Alroy J, Raghavan SS, et al. Dysmyelinogenesis in animal model of GM1 gangliosidosis. Pediatric neurology. 1992;8:255–261. doi: 10.1016/0887-8994(92)90361-2. [DOI] [PubMed] [Google Scholar]
- 15.Kondagari GS, King BM, Thomson PC, et al. Treatment of canine fucosidosis by intracisternal enzyme infusion. Experimental neurology. 2011;230:218–226. doi: 10.1016/j.expneurol.2011.04.019. [DOI] [PubMed] [Google Scholar]
- 16.McGowan JC, Haskins M, Wenger DA, Vite C. Investigating demyelination in the brain in a canine model of globoid cell leukodystrophy (Krabbe disease) using magnetization transfer contrast: preliminary results. Journal of computer assisted tomography. 2000;24:316–321. doi: 10.1097/00004728-200003000-00025. [DOI] [PubMed] [Google Scholar]
- 17.Sacre BJ, Cummings JF, De Lahunta A. Neuroaxonal dystrophy in a Jack Russell terrier pup resembling human infantile neuroaxonal dystrophy. The Cornell veterinarian. 1993;83:133–142. [PubMed] [Google Scholar]
- 18.Wu YC, Field AS, Duncan ID, et al. High b-value and diffusion tensor imaging in a canine model of dysmyelination and brain maturation. NeuroImage. 2011;58:829–837. doi: 10.1016/j.neuroimage.2011.06.067. [DOI] [PMC free article] [PubMed] [Google Scholar]
- 19.Lebel C, Caverhill-Godkewitsch S, Beaulieu C. Age-related regional variations of the corpus callosum identified by diffusion tensor tractography. NeuroImage. 2010;52:20–31. doi: 10.1016/j.neuroimage.2010.03.072. [DOI] [PubMed] [Google Scholar]
- 20.Mori S, van Zijl PC. Fiber tracking: principles and strategies - a technical review. NMR in biomedicine. 2002;15:468–480. doi: 10.1002/nbm.781. [DOI] [PubMed] [Google Scholar]
- 21.Hofer S, Frahm J. Topography of the human corpus callosum revisited--comprehensive fiber tractography using diffusion tensor magnetic resonance imaging. NeuroImage. 2006;32:989–994. doi: 10.1016/j.neuroimage.2006.05.044. [DOI] [PubMed] [Google Scholar]
- 22.Huang H, Zhang J, Jiang H, et al. DTI tractography based parcellation of white matter: application to the mid-sagittal morphology of corpus callosum. NeuroImage. 2005;26:195–205. doi: 10.1016/j.neuroimage.2005.01.019. [DOI] [PubMed] [Google Scholar]
- 23.Hofer S, Merboldt KD, Tammer R, Frahm J. Rhesus monkey and human share a similar topography of the corpus callosum as revealed by diffusion tensor MRI in vivo. Cereb Cortex. 2008;18:1079–1084. doi: 10.1093/cercor/bhm141. [DOI] [PubMed] [Google Scholar]
- 24.Provenzale JM, Isaacson J, Chen S. Progression of corpus callosum diffusion-tensor imaging values during a period of signal changes consistent with myelination. AJR American journal of roentgenology. 2012;198:1403–1408. doi: 10.2214/AJR.11.7849. [DOI] [PubMed] [Google Scholar]
- 25.Brodmann K, Gary LJ. Brodmann’s localization in the cerebral cortex: the principles of comparative localisation in the cerebral cortex based on cytoarchitectonics. New York, NY: Springer; 2006. p. xv.p. 298. [Google Scholar]
- 26.Rajkowska G, Kosmal A. Intrinsic connections and cytoarchitectonic data of the frontal association cortex in the dog. Acta neurobiologiae experimentalis. 1988;48:169–192. [PubMed] [Google Scholar]
- 27.Tanaka D, Jr, Gorska T, Dutkiewicz K. Corticostriate projections from the primary motor cortex in the dog. Brain research. 1981;209:287–303. doi: 10.1016/0006-8993(81)90154-2. [DOI] [PubMed] [Google Scholar]
- 28.Kreiner J. The myeloarchitectonics of the frontal cortex of the dog. The Journal of comparative neurology. 1961;116:117–133. doi: 10.1002/cne.901160203. [DOI] [PubMed] [Google Scholar]
- 29.Tanaka D., Jr Neostriatal projections from cytoarchitectonically defined gyri in the prefrontal cortex of the dog. The Journal of comparative neurology. 1987;261:48–73. doi: 10.1002/cne.902610105. [DOI] [PubMed] [Google Scholar]
- 30.Dua-Sharma S, Jacobs HL, Sharma KN. The canine brain in stereotaxic coordinates; full sections in frontal, sagittal, and horizontal planes. Cambridge, Mass: MIT Press; 1970. p. xv.p. 211. (chiefly illus.) [Google Scholar]
- 31.Schmahmann JD, Pandya DN. Fiber pathways of the brain. Oxford; New York: Oxford University Press; 2006. p. xviii.p. 654. [Google Scholar]
- 32.Langley JN. The Structure of the Dog’s Brain. The Journal of physiology. 1883;4:248–326. 243. doi: 10.1113/jphysiol.1883.sp000130. [DOI] [PMC free article] [PubMed] [Google Scholar]
- 33.Leigh EJ, Mackillop E, Robertson ID, Hudson LC. Clinical anatomy of the canine brain using magnetic resonance imaging. Veterinary radiology & ultrasound: the official journal of the American College of Veterinary Radiology and the International Veterinary Radiology Association. 2008;49:113–121. doi: 10.1111/j.1740-8261.2008.00336.x. [DOI] [PubMed] [Google Scholar]
- 34.Rajapakse JC, Giedd JN, Rumsey JM, Vaituzis AC, Hamburger SD, Rapoport JL. Regional MRI measurements of the corpus callosum: a methodological and developmental study. Brain & development. 1996;18:379–388. doi: 10.1016/0387-7604(96)00034-4. [DOI] [PubMed] [Google Scholar]
- 35.Witelson SF. Hand and sex differences in the isthmus and genu of the human corpus callosum. A postmortem morphological study. Brain: a journal of neurology. 1989;112 (Pt 3):799–835. doi: 10.1093/brain/112.3.799. [DOI] [PubMed] [Google Scholar]
- 36.Moon WJ, Provenzale JM, Sarikaya B, et al. Diffusion-tensor imaging assessment of white matter maturation in childhood and adolescence. AJR American journal of roentgenology. 2011;197:704–712. doi: 10.2214/AJR.10.6382. [DOI] [PMC free article] [PubMed] [Google Scholar]
- 37.Phillips KA, Hopkins WD. Topography of the chimpanzee corpus callosum. PloS one. 2012;7:e31941. doi: 10.1371/journal.pone.0031941. [DOI] [PMC free article] [PubMed] [Google Scholar]
- 38.Petrides M, Pandya DN. Comparative cytoarchitectonic analysis of the human and the macaque ventrolateral prefrontal cortex and corticocortical connection patterns in the monkey. The European journal of neuroscience. 2002;16:291–310. doi: 10.1046/j.1460-9568.2001.02090.x. [DOI] [PubMed] [Google Scholar]
- 39.Ramnani N, Behrens TE, Johansen-Berg H, et al. The evolution of prefrontal inputs to the cortico-pontine system: diffusion imaging evidence from Macaque monkeys and humans. Cereb Cortex. 2006;16:811–818. doi: 10.1093/cercor/bhj024. [DOI] [PubMed] [Google Scholar]
- 40.Muenzer J. Overview of the mucopolysaccharidoses. Rheumatology (Oxford) 2011;50 (Suppl 5):v4–12. doi: 10.1093/rheumatology/ker394. [DOI] [PubMed] [Google Scholar]
- 41.Phelan JA, Lowe LH, Glasier CM. Pediatric neurodegenerative white matter processes: leukodystrophies and beyond. Pediatric radiology. 2008;38:729–749. doi: 10.1007/s00247-008-0817-x. [DOI] [PubMed] [Google Scholar]
- 42.Provenzale JM, Escolar M, Kurtzberg J. Quantitative analysis of diffusion tensor imaging data in serial assessment of Krabbe disease. Annals of the New York Academy of Sciences. 2005;1064:220–229. doi: 10.1196/annals.1340.040. [DOI] [PubMed] [Google Scholar]
- 43.Aboitiz F, Scheibel AB, Fisher RS, Zaidel E. Fiber composition of the human corpus callosum. Brain research. 1992;598:143–153. doi: 10.1016/0006-8993(92)90178-c. [DOI] [PubMed] [Google Scholar]
- 44.Tournier JD, Mori S, Leemans A. Diffusion tensor imaging and beyond. Magnetic resonance in medicine: official journal of the Society of Magnetic Resonance in Medicine / Society of Magnetic Resonance in Medicine. 2011;65:1532–1556. doi: 10.1002/mrm.22924. [DOI] [PMC free article] [PubMed] [Google Scholar]
- 45.Oouchi H, Yamada K, Sakai K, et al. Diffusion anisotropy measurement of brain white matter is affected by voxel size: underestimation occurs in areas with crossing fibers. AJNR American journal of neuroradiology. 2007;28:1102–1106. doi: 10.3174/ajnr.A0488. [DOI] [PMC free article] [PubMed] [Google Scholar]
- 46.Roebroeck A, Galuske R, Formisano E, et al. High-resolution diffusion tensor imaging and tractography of the human optic chiasm at 9. 4 T. NeuroImage. 2008;39:157–168. doi: 10.1016/j.neuroimage.2007.08.015. [DOI] [PubMed] [Google Scholar]
- 47.Chung HW, Chou MC, Chen CY. Principles and limitations of computational algorithms in clinical diffusion tensor MR tractography. AJNR American journal of neuroradiology. 2011;32:3–13. doi: 10.3174/ajnr.A2041. [DOI] [PMC free article] [PubMed] [Google Scholar]
- 48.Wedeen VJ, Wang RP, Schmahmann JD, et al. Diffusion spectrum magnetic resonance imaging (DSI) tractography of crossing fibers. NeuroImage. 2008;41:1267–1277. doi: 10.1016/j.neuroimage.2008.03.036. [DOI] [PubMed] [Google Scholar]
- 49.Alexander DC. In: An Introduction to Computational Diffusion MRI: the Diffusion Tensor and Beyond Visualization and Processing of Tensor Fields. Weickert J, Hagen H, editors. Springer; Berlin Heidelberg: 2006. pp. 83–106. [Google Scholar]
- 50.Zhan L, Jahanshad N, Ennis DB, et al. Angular versus spatial resolution trade-offs for diffusion imaging under time constraints. Human brain mapping. 2012 doi: 10.1002/hbm.22094. [DOI] [PMC free article] [PubMed] [Google Scholar]


