Abstract
The phase changes that occur during discharge of an electrode comprised of LiFePO4, carbon, and PTFE binder have been studied in lithium half cells by using X-ray diffraction measurements in reflection geometry. Differences in the state of charge between the front and the back of LiFePO4 electrodes have been visualized. By modifying the X-ray incident angle the depth of penetration of the X-ray beam into the electrode was altered, allowing for the examination of any concentration gradients that were present within the electrode. At high rates of discharge the electrode side facing the current collector underwent limited lithium insertion while the electrode as a whole underwent greater than 50% of discharge. This behavior is consistent with depletion at high rate of the lithium content of the electrolyte contained in the electrode pores. Increases in the diffraction peak widths indicated a breakdown of crystallinity within the active material during cycling even during the relatively short duration of these experiments, which can also be linked to cycling at high rate.
1. Introduction
Lithium ion batteries are the power source of choice for most mobile electronic devices.1−3 These systems generally work using the insertion and removal of lithium ions into host materials, resulting in redox and structural changes during the electrochemical cycling. LiFePO4 adopts the olivine structure type ((Mg,Fe)2SiO4, orthorhombic),4−12with FeO6 corner-linked octahedra in the bc plane and LiO6 octahedra forming edge-sharing chains on the b axis. Hence the Li+ ions reside within 1D channels, allowing their extraction and insertion during charge and discharge via the reaction shown in Figure 1.
Figure 1.
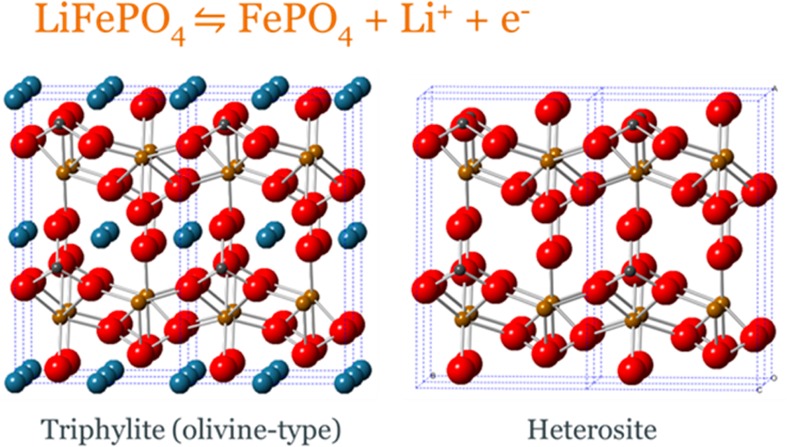
Equation for charge and discharge of LiFePO4 and structural diagrams of the LiFePO4 and FePO4 active materials with iron atoms shown in orange, small gray phosphorus atoms, large blue lithium atoms, and red oxygen atoms. Both structures adopt space group Pnma, with lattice parameters of a = 10.3290(3) Å, b = 6.0065(2) Å, and c = 4.6908(2) Å for LiFePO4 and a = 9.8142(2) Å, b = 5.7893(2) Å, and c = 4.7820(2) Å for FePO4.13
The discharge profile is characterized by a flat plateau at 3.45 V vs Li. This flat potential discharge reaction is characteristic of the coexistence of two phases, LiFePO4 and FePO4, each having a narrow compositional stability range in contrast with nonstoichiometric electrode materials such as LixCoO2 that generally show sloping profiles.
The first in situ X-ray diffraction (XRD) study of LiFePO4 was presented by Andersson et al. using a “coffee bag” type cell.13 This cell can be placed directly in the X-ray beam and diffraction is observed in transmission mode through the coffee bag. The study clearly showed the phase change reaction and monitored the growth of the heterosite (FePO4) phase as the triphylite (LiFePO4) phase diminishes during charge, with the reverse occurring on discharge. The intensities of the peaks were found to be in good agreement with those anticipated from the charge passed during cycling. Several other designs for in situ diffraction studies have since been reported14,15 including a recent study that characterized a meta stable new phase formation at high rates in large particle size LiFePO4.16
Since some of the first commercial uses of LiFePO4 have emerged for high power applications such as power tools,17 many different preparations of LiFePO4 have been explored to improve the material’s performance in order to allow for practical use at high rates. These have focused on control of its particle size, doping on the Li and Fe site, and various coating methodologies.18−39 These strategies have been largely successful on the particle and agglomerate levels, reducing solid state diffusion times, phase boundary strain, and electronic resistance.
Given the above successes in improving the discharge of single particles and agglomerates such that intraparticle equilibration processes are not rate limiting, attention has recently focused on the effects of ion transport restrictions in composite electrodes containing dispersed active material, an electron conducting additive, and electrolyte. In the case where electronic conductivity is not rate limiting, discharge should begin at the electrode/separator interface where ion transport restrictions are at a minimum. With nonstoichiometric electrode materials, where the equilibrium potential decreases continuously with discharge, the progression of discharge from the front to the back of the electrode can be described by ambipolar diffusion of lithium ions and electrons according to the DeLevie description of a porous electrode.40 Here the active material is represented by a series of capacitances distributed along the electrode thickness. These are connected to the bulk electrolyte through the infused electrolyte within the pores, and to the current collector via the electron conducting additive, so that parts of an electrode that are at different states of charge are continuously equilibrated during discharge. The interface between charged and discharged material is diffuse, and further diffusion occurs after the current has been switched off. Importantly, the driving force for ambipolar diffusion is the increase in the potential with the state of charge. This is notably absent in the case of stoichiometric materials such as FePO4/LiFePO4 where the potential is constant for most of the composition range, as shown by a long plateau in the discharge curve. Ambipolar (ion-electron) diffusion should not occur in these materials; instead, the interface between charged and discharged parts of the electrode should be linked directly to the passage of charge and should stop moving once the current stops despite the sharp change in the average concentration of lithium. We recently described this phenomenon as the sharp discharge front (SDF) effect,41 and supported our hypothesis with electrochemical discharge data that responded to changes of electrolyte conductivity and salt diffusion as predicted, but previously had no direct evidence for the distribution of discharged material within the electrode.
The above example cites just one case among many where a direct observation of the profile of the extent of discharge with depth into the electrode thickness could provide valuable insight into the discharge process and verification of simulated discharge phase profiles. In situ neutron depth profiling can resolve variations in lithium concentration through the thickness of an electrode via the energy profile of α particles formed as a result of neutron capture by 6Li.42 Cross-sectional imaging by neutron absorption43 or TEM44 can also provide valuable information on variations through the electrode. The use of X-ray diffraction allows direct observation of the phase distribution of the active materials during charge and discharge. This information is different from the lithium distribution, which would include any lithium in the electrolyte, and can be collected rapidly in situ providing the possibility of time resolution. Variation of the incidence angle provides a depth sensitivity as absorption of X-ray photons results in a limited path length so with low incident angles the diffraction signal comes largely from close to the surface. The LiFePO4/FePO4 system provides a model composite electrode, which should provide a sharp and controllable discharge front.
2. Experimental Section
Positive electrodes for in situ cycling were formed by mixing appropriate amounts of carbon-coated LiFePO4 (Hydro-Quebec) and acetylene black conducting additive (Shawinigan Black), then mixing in a polytetrafluoroethylene (PTFE) binder (6C–N, DuPont). The resulting mixture was calendared to a controlled film thickness of 100 μm and punched to produce circular electrodes with a diameter of 8 mm. The electrodes were dried overnight at 120 °C under vacuum, before being transferred to an argon-filled glovebox. Two compositions of LiFePO4 electrodes were used for the testing: (a) 50% LiFePO4, 40% acetylene black, and 10% PTFE by mass and (b) 25% LiFePO4, 60% acetylene black, and 15% PTFE by mass.
Electrochemical cycling used a BioLogic SP-150 potentiostat. Currents were calculated to achieve complete charge or discharge in a fixed time period based on theoretical capacity, e.g. C/2 = complete charge or discharge in 2 h and 2C = 0.5 h. Scanning electron microscopy (SEM) used a Jeol JSM-6500 FEGSEM with 15 kV accelerating voltage and secondary electron imaging—powders or whole electrodes were mounted on conducting carbon tape and imaged without any further coating. Initial XRD patterns were collected with a Bruker D2 Phaser (Cu Kα X-rays) and Rietveld refinement of the data used the GSAS package.45
2.1. In Situ Electrochemical Cell
The electrochemical cell used for the in situ work is based on the commonly used Swagelok cell design and therefore consists largely of cheap, commercially available parts. This cell can be constructed readily in any laboratory and does not require the use of specialized equipment or the use of toxic beryllium metal windows. The few bespoke parts used in its assembly are easily fabricated with use of basic tools. Furthermore, it is simple to assemble and clean after use, and the positive current collector, which doubles as the X-ray window, is disposable and easily replaced. The cell consists of three main sections as shown schematically in Figure 2a and as a photograph in Figure 2b: (1) A 12 μm thick aluminum foil acts as the positive current collector. This was attached to a stainless steel washer with black silicone rubber adhesive (Loctite Type 5910—–this was found to be inert in the environment of an operational cell). The washer was similarly attached to the Swagelok nut used to seal the cell. (2) A 12.7 mm diameter stainless steel piston was used as the negative current collector. This was placed under tension with a steel spring held in place with a 12.7 mm diameter stainless steel rod, the bottom of which was machined to fit into a standard goniometer head for mounting onto the beamline. (3) PTFE sheaths, ferrules, and a nut sealing the bottom of the cell were used to avoid short-circuits, including during handling of the cell.
Figure 2.
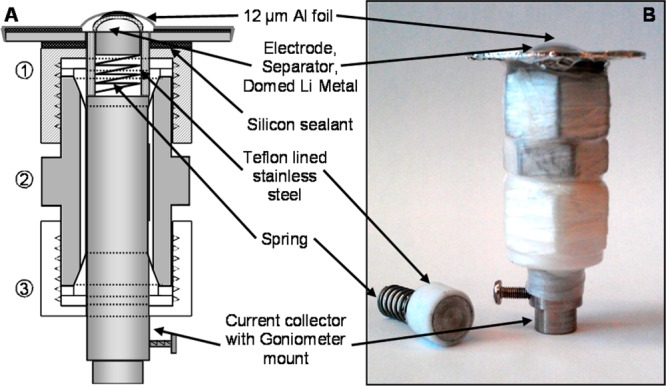
(a) Schematic and (b) image of the electrochemical cell used in the in situ XRD studies.
The cell was loaded in an argon filled glovebox with O2/H2O < 5 ppm. The layered battery assemblies consisted of a composite positive electrode, two electrolyte-soaked 12.7 mm diameter separators (Whatman GF/F grade glass fiber with eight drops of 1.0 mol dm–3 LiPF6 in 1:1 ethylene carbonate/dimethyl carbonate (Novolyte Technologies)) and a lithium metal negative electrode formed by compressing lithium (99.9%, Aldrich) into a hemispherical mold and punching to a diameter of 11 mm. The shaped lithium negative electrode allowed an even pressure to be applied across the diameter of the stack, countering the effect of deformation of the aluminum window under pressure and allowing a similar electrochemical performance to be achieved to that observed with the same electrode material in a standard Swagelok cell with flat electrodes.
2.2. In Situ XRD Methodology
To study the electrode composition as a function of depth and state of charge the diffraction geometry shown schematically in Figure 3 was used. The sample was mounted on the hexapod stage at beamline I07 of the Diamond Light Source with use of an insulating mount and visually centered in the XY plane such that the highest point on the curved surface of the window was aligned with the center of the diffractometer cirles. The X-ray beam height was approximately 80 μm and a scan in the vertical direction monitoring the direct beam intensity was used to position the sample such that the beam center was level with the top of the 100 μm thick positive electrode. Hence 40 μm of the beam passed through the back of the sample with 0° incidence angle and 60% of the electrode (the part facing the separator and negative electrode) was not contributing to the observed XRD pattern. The sample was then tilted to increase the incidence angle and the penetration depth into the electrode. Additional information about sample mounting on the beamline is included in the Supporting Information.
Figure 3.
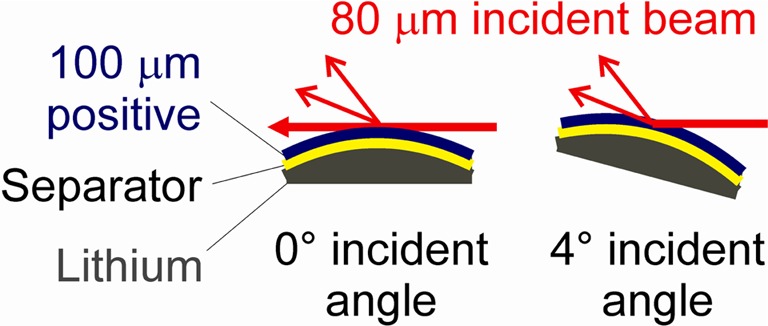
Schematic showing the effect of changing the angle of incidence on the penetration of the 80 μm high X-ray beam into the positive electrode at 0° (left) and 4° (right) angle of incidence.
In situ XRD patterns were collected with 20 keV beam energy (λ = 0.620 Å) and an exposure time of 1 s using a Pilatus 100K area detector at a camera length of 497 mm such that a ∼7° range could be collected in a single frame with high resolution. This restricted the accessible 2θ range but facilitated fast acquisition times so that the phase change reaction could be observed at high rates. Data were continuously collected with a series of different incidence angles between 0 and 6°, although ultimately the analysis focused on data collected at 0 and 4°. Collecting 1 s patterns at 0, 0.5°, 1°, 2°, 3°, 4°, and 6° incidence angles resulted in a 20 s cycle of measurements (patterns could be recorded with acceptable quality in 0.1 s but the sample position adjustment to effect the different angles of incidence was the rate limiting step). The peak width was between 0.05° and 0.06° at both incidence angles hence the variation in peak width with incident angles was not found to be significant. With a battery performing to theoretical capacity at our fastest rate of 20C under these conditions 9 patterns could be collected at each angle during the 3 min discharge. The peak heights of the most intense Bragg reflections for LiFePO4 at 15.7° and FePO4 at 16.3° were then used to provide a measure of the electrode phase composition at each angle of incidence. This structural change was correlated to the state of charge by using time stamps in both the electrochemical and XRD data files. The peak heights were extracted by using a MATLAB macro with a baseline correction. Strictly peak area is proportional to the phase fraction, but since peak widths of the LiFePO4 and FePO4 phases were similar in any given pattern the intensity was taken as a good indication of the relative phase contents.
3. Results and Discussion
Commercially sourced LiFePO4 was used in this work to take advantage of its optimized performance, achieving a capacity of approximately 150 mA h g–1 with a good cycle life and rate capability.39 Powder XRD studies showed it to contain single phase LiFePO4 (Supporting Information, Figure S1). Rietveld refinement by using the standard triphylite model in space group Pnma resulted in a good fit with a = 10.32227(12) Å, b = 6.00341(6) Å, and c = 4.69092(7) Å, similar values to those described in the literature.13 To obtain a good fit it was necessary to employ a preferred orientation parameter allowing for a small increase in intensity along ⟨010⟩ (March–Dollase preferential orientation ratio of 0.9105(12) along ⟨010⟩). The SEM (Figure S1, Supporting Information) showed well-formed crystallites that are slightly elongated along one axis and with an approximate size of 200 nm. Since preferred orientation is only being observed along one axis it is likely that the large flat face observable on some crystallites is becoming aligned with the XRD sample surface during sample preparation and that this face is the {010} plane of the crystallites.
3.1. In Situ XRD with Slow Charge/Discharge
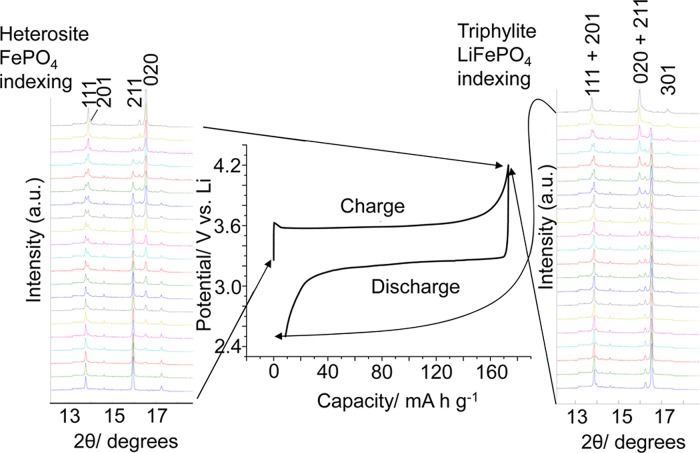
Figure 4 shows XRD patterns obtained during the slow (C/2) charge and discharge of a LiFePO4 half cell. The electrochemical response is characteristic of the coexistence of two phases with a flat plateau observed in the voltage capacity profile during charge and discharge.37,46 In the fully discharged (or as-constructed) state the characteristic triphylite LiFePO4 phase can be clearly identified and as expected after charging (due to the near theoretical capacity extraction) a complete conversion to the heterosite FePO4 phase was observed. In the partially charged or discharged condition we can clearly observe a mixture of these two phases in the diffraction data with the phase contributions to the pattern corresponding to the state of charge (specifically peaks at 16.2° and 13.7° corresponding to LiFePO4 and those at 15.7° and 13.6° pertaining to FePO4). It can be observed that peak overlap is quite limited due to the narrow XRD reflections and the significant differences in lattice parameters between the LiFePO4 and FePO4 phases.
Figure 4.
Charge and discharge curve for LiFePO4 at a rate of C/2 with stacked diffraction patterns (4° incident angle) showing the linked structural changes between the LiFePO4 and FePO4 phases.
A significant enhancement in the 020 reflection relative to the expected intensity distribution based on the literature powder patterns13 is observed in both LiFePO4 and FePO4, a larger elongation of the 020 reflections than observed in the powder pattern of the starting material (Figure S1, Supporting Information). Here the calendaring process used to make the electrodes is likely to have induced this orientational effect. Importantly the degree of 020 preferred orientation was observed to be very similar in LiFePO4 and FePO4 due to the topotactic transformation between them.
3.2. Interpretations of the Discharge Curves at Low and High Discharge Rates
The discharge performance of the batteries constructed for in situ testing using 25% and 50% active material with rates between 2 and 20 C is summarized in Figure 5b,d (a constant charging rate of 2C was used for all experiments irrespective of the discharge rate to ensure the condition of the electrode at the start of discharge was as similar as possible). At relatively slow rates of discharge a characteristic flat discharge plateau was observed around 3.45 V vs Li in both cases.38 As the rate was increased the discharge changes to a negative gradient linear profile as noted in our previous publication41 and explained by an Ohmic potential drop in the electrolyte within the composite electrode to the nearest delithiated particle, increasing with the distance from the separator to the discharge front. Discharges at rates greater than 5 C showed sharp end points at capacities well short of those obtained at low rates, similar to our previous work40 where an explanation was given in terms of severe lithium salt polarization at high rates due to a low lithium ion transference number. For electrodes containing only 25% and 50% LiFePO4 (used in this work to ensure that X-rays could pass from the front to the back of the electrode without total absorption during the penetration path length) the capacity was well maintained up until rates of around 10C (Figure 5a,c), with a slight reduction in capacity easily explained by premature termination of the discharge resulting from an arbitrary choice of potential limit that did not account for the discussed increase in IR drop. At rates greater than 10C we observed that sharp end points are reached which are premature of that anticipated entirely from IR drop and were hence consistent with the electrolyte limitation discussed earlier. The good retention of capacity at high rates observed in these electrodes results from a reduced amount of LiFePO4; we chose relatively dilute amounts of active material to ensure that X-rays could pass from the front to the back of the electrode without total absorption during the penetration path length. If we assume that at the highest rates the electrodes are discharging under the SDF model discussed in our previous work41 then we can calculate effective diffusion coefficients of lithium ions in both electrodes using eq 1.
| 1 |
where DoD is the degree of discharge, f is C rate, [LiX]0 is the concentration of salt ions in the electrode, T– is the transport number (assumed to be 0.3 in this case41), [Li] is the concentration of Li ions stored in the active material within the electrode, D is the diffusion coefficient, and L is the thickness of the electrode.
Figure 5.
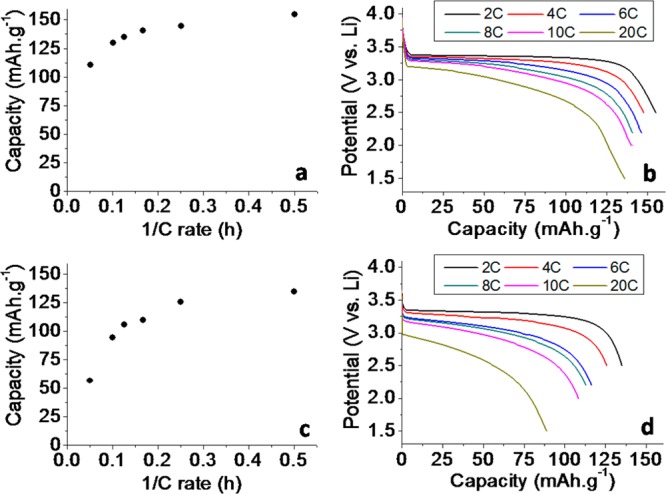
Electrochemical performance of 25% (a, b) and 50% LiFePO4 (c, d) electrodes shown as electrode capacity retention as a function of rate (left) and discharge capacity vs potential (right). Slow charging rates and constant voltage top up periods were used to ensure full charging of the battery.
The effective diffusion coefficients for the salt in these structures were found to be 1.7 × 10⁻¹⁰ and 2.2 × 10⁻¹⁰ m2 s–1 for the 25% and 50% electrodes, respectively. These values are significantly larger than we reported for an electrode with 75% active material in our previous work (∼10–11) and can be explained by increased porosity and a lower tortuosity of the diffusion paths.
Based on the electrochemical performance an almost complete discharge of the cell at all rates is likely for the electrode containing 25% active material and therefore relatively small concentration gradients should be observed. For the 50% active material electrode much larger gradients are likely to be observed, especially at high rates.
3.3. Structural Changes As a Function of Depth in the Electrode
During the electrochemical measurements presented in Figure 5, XRD patterns were collected at a number of incidence angles to probe the structural changes as a function of state of discharge rate. Our analysis focuses on data collected at 0 and 4°. Grazing incidence XRD is widely used to increase the effective sample thickness in the study of thin films.47 Applying this technique to battery electrodes can provide an effective method to profile any differences in phase behavior as a function of depth in the electrode by varying the proportion of the signal that is scattered from the side on which the beam impinges. The absorption of X-ray photons is a significant consideration in this geometry as with a 4° incidence angle the path length through the electrode will be increased from the 100 μm electrode thickness to ∼1400 μm. Based on calculated X-ray absorption characteristics of the electrode components (Supporting Information, Table S1) only about 6% of photons are expected to reach the front face of the electrode so the observed phase concentrations will be significantly biased toward contributions from material close to the current collector. The battery could be assembled the other way up to reverse this bias, but that geometry would also contain a compromise in that the beam would have to pass through the negative electrode and the separator, which would increase the contribution to the diffraction patterns from these components. Importantly the absorption profiles of the two electrode compositions discussed herein are similar (Table S1, Supporting Information) and so direct comparisons between their behavior can be made, while keeping in mind the bias in the data toward the back of the electrodes. The intensity of the 020 reflection of FePO4 is approximately equal to that of the 020 + 211 reflections of LiFePO4 in an equimolar mixture of these phases, hence the intensities of these reflections were used as a semiquantitative measure of the content of the relevant phase. Figure 6 shows the variation in the phase fraction of FePO4 based on the intensity of the 020 reflection during discharge at various rates. As expected the intensity changes occur over shorter time periods as the discharge rate is increased. With 25% active material in the electrode the intensity profile at all rates is similar using a 0 or 4° incidence angle. It is striking, however, that these profiles diverge with 50% active material and that the observed intensity of the FePO4 020 reflection is stronger with 4° incidence angle than it is with 0° incidence angle at all rates above 4C. This divergence shows that the back of the electrode is undergoing less discharge at these rates than the region being sampled closer to the front of the electrode. The divergence is largest at 8C and 10C, and is observed to decrease again at 20C. This indicates that the region of the electrode with the largest variation in composition is moving further from the side of the electrode from which the X-ray is impinging and hence closer to the electrolyte-soaked separator.
Figure 6.
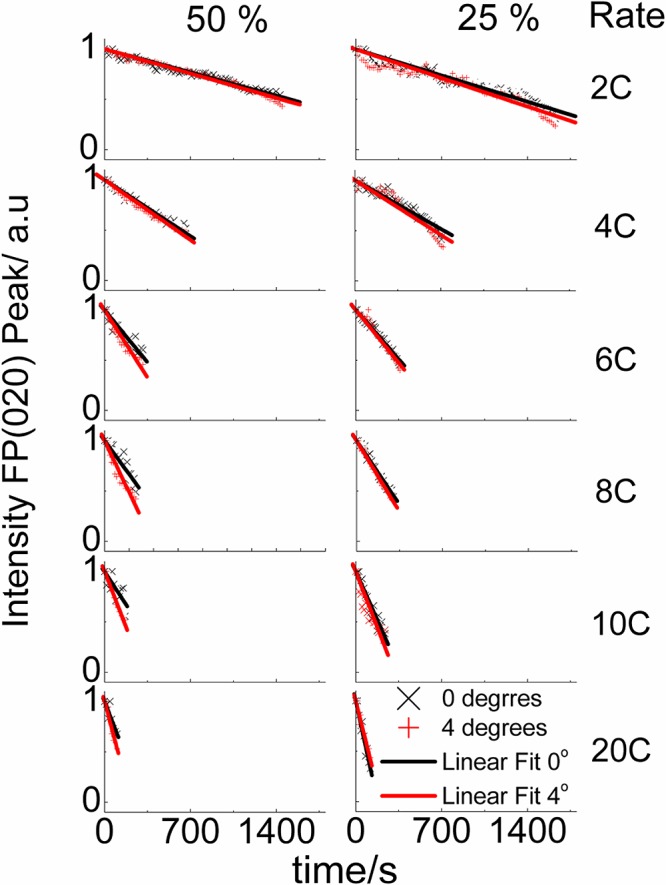
The variation in FePO4 phase fraction expressed as the FePO4 020 peak height (relative to the combined heights of the FePO4 020 and the LiFePO4 020 + 211) with time during cell discharge for electrodes prepared with 50% and 25% LiFePO4 and linear fits to the data.
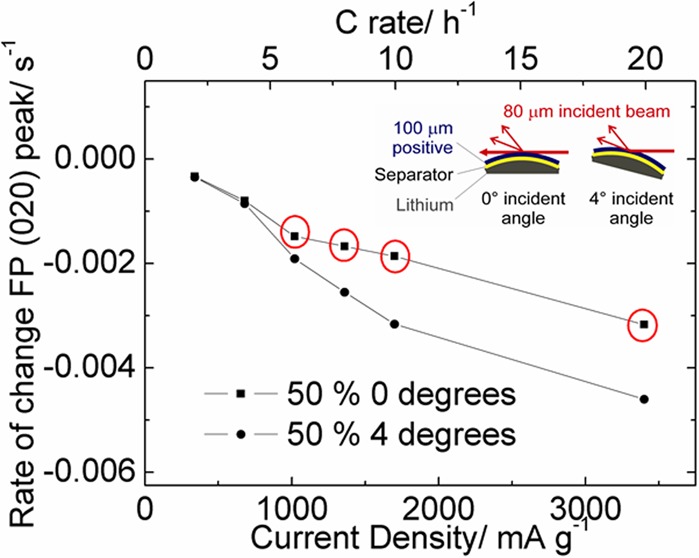
Figure 7a,b shows the gradients of the linear fits to the data in Figure 6 plotted versus current density and C rate for both the 25% and 50% electrodes, respectively. This plot emphasizes the divergence in the observed intensity of the FePO4 020 reflection of the 50% active material electrode during fast discharge. A particular strength of our approach of rapidly collecting a series of incidence angles is that these data were collected on a single electrode so are directly comparable.
Figure 7.
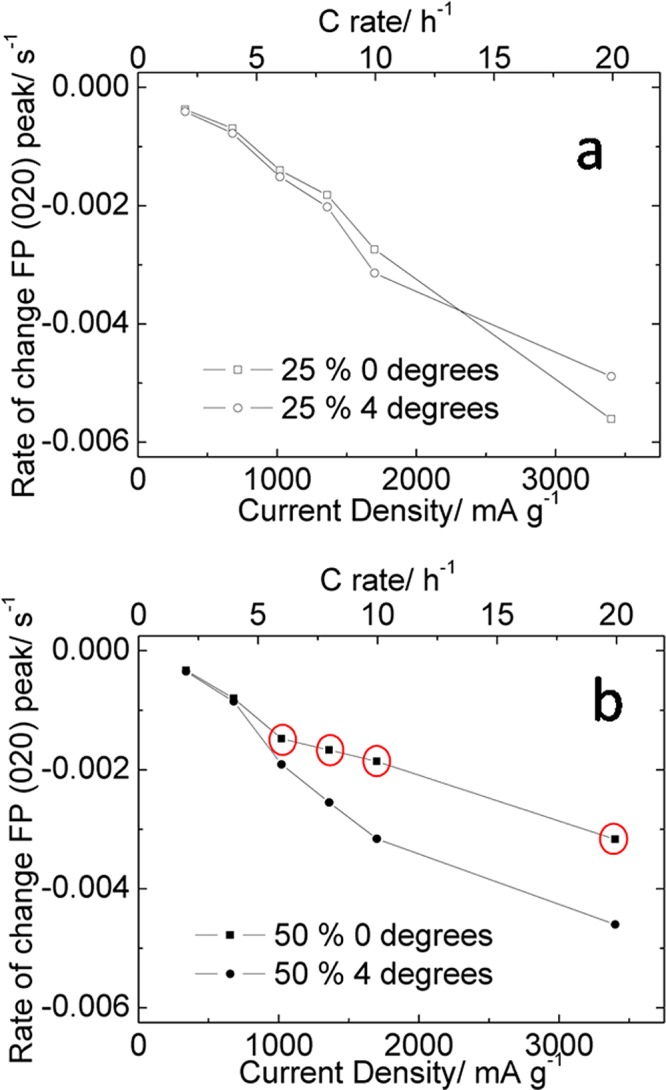
The rate of change of the intensity of the FePO4 020 reflection during discharge as a function of current density and C rate for (a) 25% and (b) 50% LiFePO4-containing electrodes. Data were extracted from the linear fits shown in Figure 6. Points circled in red highlight those which indicate significant concentration gradients within the electrode.
The variations in phase behavior that we have observed during fast discharge are consistent with the effects described earlier based on observations from the electrochemical performance. In the electrode containing 25% active material the electrochemical data show only a slight increase in the negative gradient of the discharge plateau indicating that some small ionic diffusion gradients may exist in the electrode resulting in some preferential discharge of material near the bulk electrolyte as observed in Figure 7a (a notable deviation from this trend is seen at 20C which may be due to a low number of data points increasing the bias from experimental scatter). In the 50% electrode, little or no variation was seen in the gradients at the front and back of the electrode with rates of 4C or slower. However, at elevated rates there is a sharp deviation in the rate of change between the front and back of the electrode suggesting that a significantly different limitation is controlling the electrode composition. This effect is consistent with the salt concentration polarization aspect of our previously reported SDF model,41 and originates from the insufficient concentration of lithium ions in the electrolyte stored within the electrode (see Table 1). During the discharge of the battery lithium ions must be transported from the bulk electrolyte to the active material by migration and diffusion. At slow rates these mass transfer processes are sufficient to allow complete discharge of the battery, but at higher rates they are severely limiting.
Table 1. Projected Concentrations of LiPF6 and Li Ion Vacancies in FePO4 within the Battery Electrodes Used in This Studya.
| % active material in electrode | LiPF6 soaked in electrode void space/mol dm–3 | Li ion vacancies in FePO4/mol dm–3 |
|---|---|---|
| 50 | 0.2 | 6.52 |
| 25 | 0.2 | 2.85 |
Calculated assuming that the solid material is approximately 80% of the volume and that the free space (filled with electrolyte) is 20% (approximated from ref (48)). Densities were taken as 3.6, 2, and 2.2 g cm–3 for LiFePO4, carbon black, and PTFE, respectively. It was also assumed that changes in composition of the active material did not change the packing of the solids and therefore the occupied volume. The concentration of the LiPF6 in the electrolyte solution used was 1 M.
In the flat discharge plateau region of LiFePO4 the discharge reaction can be written as:
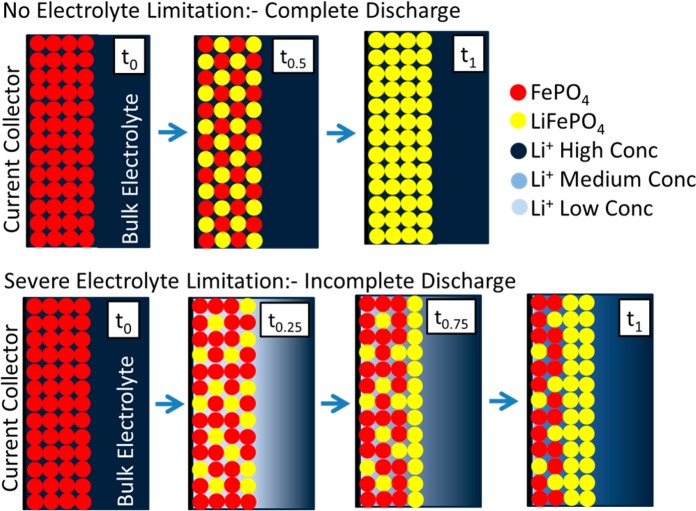
The FePO4 and LiFePO4 phases coexist within the electrode structure, so if one region of the electrode has an insufficient supply of lithium ions then a slower discharge will occur in one region and a faster rate of discharge in another. At high rates of discharge lithium ions are rapidly exhausted in the electrode. This is followed by a mass transport process driven by diffusion from the bulk electrolyte. The lithium ions thus transported will react with the first particles of electrode material encountered which will be in the region of the electrode facing the separator. Hence this region will fully discharge and the electrode region near the current collector will be undercharged (as observed at high rates in the 50% active material electrode). This is shown schematically in Figure 8; when there is no limitation on the electrolyte during discharge, an even concentration in the electrode can be seen and when an electrolyte limitation is in effect, a preferential discharge occurs at the electrode close to the bulk electrolyte and results in an incomplete discharge.
Figure 8.
Schematic showing how the discharge proceeds in an electrode where there are no limitations on the discharge from the electrolyte and also where there is a severe limitation as a result of insufficient transport of Li+ ions (usually resulting from a high ratio of lithium ion vacancies to lithium ions in solution and when the electrode is discharged at high rates). This schematic negates the inclusion of any conductive additive or binder and assumes no electronic limitations.
3.4. Crystallinity Changes during Cycling
During the in situ cycling experiments described above, in which the electrodes were cycled sequentially at rates of 2, 4, 6, 8, 10, and 20 C, a reduction in the crystallinity of the active electrode was observed. Note that the peak widths of LiFePO4 and FePO4 were observed to be similar in any given pattern throughout the study so this broadening does not affect the phase faction calculations presented above. However, XRD patterns recorded at the start of discharge at each rate for the 25% electrode do show a clear increase in peak width (Figure. 9a). To check whether this breakdown could be caused by X-ray beam damage we recorded patterns at the end of a 2C discharge while the battery was under open circuit conditions for 40 min. These results showed no discernible degradation of the active material as a function of time exposed to the beam, and since none of our measurements exceeded 5 h total collection time it seems unlikely that beam damage is a significant factor. We also investigated the behavior using ex situ measurements of cells cycled with the same regime used during this in situ test, and two cells cycled at 10C and 2C for the same number of total cycles. A significant broadening of the FePO4 reflections was observed in the materials which were cycled at a range of different rates (Figure 9b) but very little extra broadening was observed with either of the fixed cycling rates.
Figure 9.
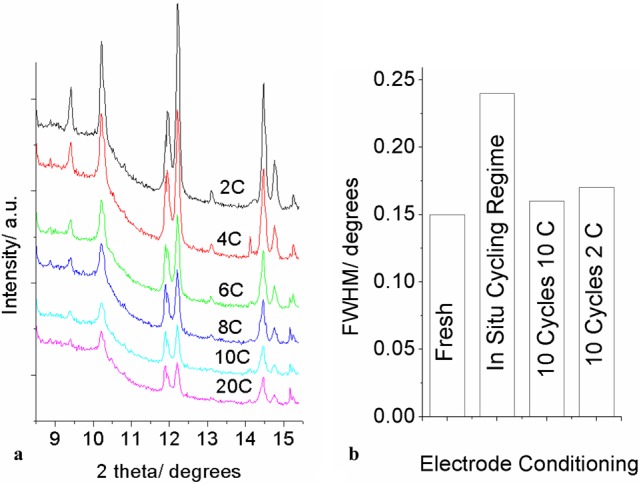
XRD patterns at the start of charge during a sequence of cycles at different rates (2C → 20C), showing the increased peak width (a) and the full width half-maximum value of the FePO4 020 reflection in patterns recorded ex situ with a fresh electrode, an electrode cycled at a number of different rates (as per the left-hand image), an electrode cycled 10 times at 10C, and an electrode cycled 10 times at 2C (b).
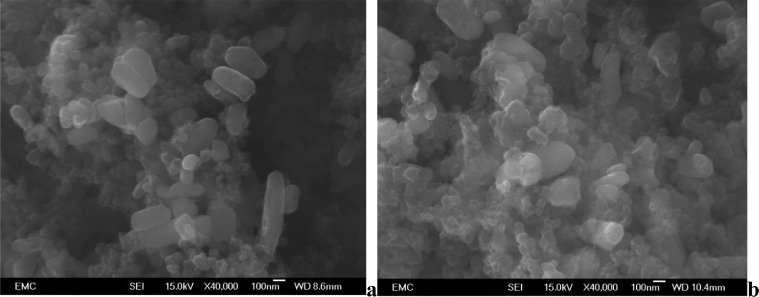
We also examined SEM images of the electrodes before (Figure 10a) and after (Figure 10b) cycling using the multi-rate regime employed for the in situ measurements described above. No obvious breakdown in particle size can be seen in these images and we therefore suggest that the line broadening is a result of increasing disorder within the crystallites. This disordering seems to be limited to cases where multiple cycling rates have been applied.
Figure 10.
SEM images of electrodes containing 25% LiFePO4 before (a) and after (b) cycling under the test regime employed in diamond. Both images have 100 nm scale bars.
3.5. Implications of the above Results for Battery Construction
The results presented above have tracked the formation of concentration gradients within electrodes under high rates of discharge. The limitations seen are consistent with effects corresponding to an insufficient transport of Li ions from the bulk electrolyte through the electrode structure as predicted by SDF theory. This confirms that the rate performance of many modern materials used in battery technologies is not a result of the intrinsic properties of the material itself but rather the matrix in which it is stored. In this study, this effect is observed in electrodes with relatively dilute amounts of active material where the X-ray absorption is not obscuring measurement. However, these gradients should be much more pronounced in electrodes with higher concentrations of active material in the electrode (such as those conventionally used in research laboratories with ≥75% active material) and thus the electrochemical rate performance of these systems will be significantly hindered. The effect should also be far more pronounced in electrode materials which have a much higher volumetric capacity, where the requirement of lithium ions by the material stored in the electrode during discharge will be much larger. This means that to realize the full rate potential of battery materials the following strategies should be considered: (1) dilution of the active material (which reduces the stored energy density); (2) reducing the electrode thickness;1,49−51 (3) increasing the concentration of lithium ions in the electrolyte: the electrolyte concentrations used herein are typical for conventional liquid electrolytes but there are recent reports of more concentrated electrolytes which retain high diffusion rates,52 these would allow an increase in the amount of lithium initially in the pores c.f. values given in Table 1; and (4) increasing the diffusion coefficient of lithium in the electrolyte.
4. Conclusions
A new method for the in situ study of battery materials that allows for the visualization of concentration gradients formed in electrodes during discharge is introduced. A significant difference in the performance of the material dependent on whether it is near the bulk electrolyte or current collector is observed. At higher rates of discharge (>10 C) the electrode material near the current collector changes at a much slower rate compared with the material close to the bulk electrolyte in cells containing a high concentration of lithium ion vacancies. It is believed that this effect is the major limitation in the rate performance of electrodes in conventionally prepared batteries.
In parallel we observed a significant breakdown in crystallinity of the LiFePO4 during the electrochemical measurements. It was shown that the breakdown is far more significant when the battery is cycled at a range of different rates rather than for the same number of cycles at either a high or low rate.
Ideally, to obtain the maximum rate out of a battery material of a given particle size and ionic and electronic conductivity we need an electrolyte that can supply the ions at high rates. In some cases the particles of the electrode material may be significantly large or the ionic or electronic conductivities sufficiently small such that electrolyte is not limiting the discharge rate. Nevertheless, modern synthesis techniques such as sol–gel and hydrothermal routes mean that synthesis of materials on the nanometre scale is routinely achieved which means that commonly the rate limiting step in the discharge of the battery material even with intrinsically poor electronic and ionic conductivities is the Li ion transport through the electrolyte.
Acknowledgments
M.R. would like to thank Kristina Edström and Uppsala University for supporting his participation in this research. A.M. was supported by EPSRC and Qinetiq via an Industrial CASE studentship. Thanks to Diamond Light Source for providing beam time under allocations SI6799-1 and SI7698-1 and Jacob Locke for assisting in the capture of SEM images.
Supporting Information Available
A Rietveld fit and SEM image of the LiFePO4 powder used in this study, a table of path lengths of X-ray photons and the subsequent percentage transmission and some additional information regarding X-ray sample mounting. This material is available free of charge via the Internet at http://pubs.acs.org.
The authors declare no competing financial interest.
Supplementary Material
References
- Roberts M.; Johns P.; Owen J.; Brandell D.; Edstrom K.; El Enany G.; Guery C.; Golodnitsky D.; Lacey M.; Lecoeur C.; Mazor H.; et al. 3D Lithium Ion Batteries-from Fundamentals to Fabrication. J. Mater. Chem. 2011, 21, 9876–9890. [Google Scholar]
- Winter M.; Brodd R. J. What Are Batteries, Fuel Cells, and Supercapacitors?. Chem. Rev. 2004, 104, 4245–4269. [DOI] [PubMed] [Google Scholar]
- Tarascon J. M.; Armand M. Issues and Challenges Facing Rechargeable Lithium Batteries. Nature 2001, 414, 359–367. [DOI] [PubMed] [Google Scholar]
- Padhi A. K.; Nanjundaswamy K. S.; Goodenough J. B. Phospho-olivines as Positive-electrode Materials for Rechargeable Lithium Batteries. J. Electrochem. Soc. 1997, 144, 1188–1194. [Google Scholar]
- Delmas C.; Maccario M.; Croguennec L.; Le Cras F.; Weill F. Lithium Deintercalation in LiFePO4 Nanoparticles via a Domino-cascade Model. Nat. Mater. 2008, 7, 665–671. [DOI] [PubMed] [Google Scholar]
- Meethong N.; Kao Y.; Tang M.; Huang H.; Carter W. C.; Chiang Y. Electrochemically Induced Phase Transformation in Nanoscale Olivines Li1–xMPO4 (M = Fe, Mn). Chem. Mater. 2008, 20, 6189–6198. [Google Scholar]
- Shin H. C.; Chung K. Y.; Min W. S.; Byun D. J.; Jang H.; Cho B. W. Asymmetry Between Charge and Discharge During High Rate Cycling in LiFePO4 – In Situ X-ray Diffraction Study. Electrochem. Commun. 2008, 10, 536–540. [Google Scholar]
- Shin H. C.; Nam K. W.; Chang W. Y.; Cho B. W.; Yoon W.-S.; Yang X.-Q.; Chung K. Y. Comparative Studies on C-coated and Uncoated LiFePO4 Cycling at Various Rates and Temperatures Using Synchrotron Based in Situ X-ray Diffraction. Electrochim. Acta 2011, 56, 1182–1189. [Google Scholar]
- Kao Y.-H.; Tang M.; Meethong N.; Bai J.; Carter W. C.; Chiang Y.-M. Overpotential-Dependent Phase Transformation Pathways in Lithium Iron Phosphate Battery Electrodes. Chem. Mater. 2010, 22, 5845–5855. [Google Scholar]
- Wang X.-J.; Jaye C.; Nam K.-W.; Zhang B.; Chen H.-Y.; Bai J.; Li H.; Huang X.; Fischer D. A.; Yang X.-Q. Investigation of the Structural Changes in Li1–xFePO4 Upon Charging by Synchrotron Radiation Techniques. J. Mater. Chem. 2011, 21, 11406. [Google Scholar]
- Xu F.; He H.; Liu Y.; Dun C.; Ren Y.; Liu Q.; Wang M.; Xie J. Failure Investigation of LiFePO4 Cells Under Overcharge Conditions. J. Electrochem. Soc. 2012, 159, A678. [Google Scholar]
- Suo L.; Han W.; Lu X.; Gu L.; Hu Y.-S.; Li H.; Chen D.; Chen L.; Tsukimoto S.; Ikuhara Y. Highly Ordered Staging Structural Interface Between LiFePO4 and FePO4. Phys. Chem. Chem. Phys. 2012, 14, 5363–5367. [DOI] [PubMed] [Google Scholar]
- Andersson A.; Kalska B.; Häggström L.; Thomas J. Lithium Extraction/insertion in LiFePO4: An X-ray Diffraction and Mössbauer Spectroscopy Study. Solid State Ionics 2000, 130, 41–52. [Google Scholar]
- Reimers J. N.; Dahn J. R. Electrochemical and In Situ X-Ray Diffraction Studies of Lithium Intercalation in LixCoO2. J. Electrochem. Soc. 1992, 139, 2091–2097. [Google Scholar]
- Morcrette M.; Chabre Y.; Vaughan G.; Amatucci G.; Leriche J.-B.; Patoux S.; Masquelier C.; Tarascon J.-M. In Situ X-ray Diffraction Techniques as a Powerful Tool to Study Battery Electrode Materials. Electrochim. Acta 2002, 47, 3137–3149. [Google Scholar]
- Orikasa Y.; Maeda T.; Koyama Y.; Murayama H.; Fukuda K.; Tanida H.; Arai H.; Matsubara E.; Uchimoto Y.; Ogumi Z. Direct Observation of a Metastable Crystal Phase of Li. J. Am. Chem. Soc. 2013, 135, 5497–5500. [DOI] [PubMed] [Google Scholar]
- Recham N.; Chotard J.-N.; Dupont L.; Delacourt C.; Walker W.; Armand M.; Tarascon J.-M. A 3.6 V Lithium-based Fluorosulphate Insertion Positive Electrode for Lithium-ion Batteries. Nat. Mater. 2010, 9, 68–74. [DOI] [PubMed] [Google Scholar]
- Chung S.-Y.; Bloking J. T.; Chiang Y.-M. Electronically Conductive Phospho-olivines as Lithium Storage Electrodes. Nat. Mater. 2002, 1, 123–128. [DOI] [PubMed] [Google Scholar]
- Morgan D.; Van der Ven A.; Ceder G. Li Conductivity in LixMPO4 (M = Mn, Fe, Co, Ni) Olivine Materials. Electrochem. Solid-State Lett. 2004, 7, A30. [Google Scholar]
- Ni J.; Zhou H.; Chen J.; Zhang X. LiFePO4 Doped with Ions Prepared by Co-precipitation Method. Mater. Lett. 2005, 59, 2361–2365. [Google Scholar]
- Gaberscek M.; Dominko R.; Jamnik J. Is Small Particle Size More Important Than Carbon Coating? An Example Study on LiFePO4 Cathodes. Electrochem. Commun. 2007, 9, 2778–2783. [Google Scholar]
- Guo X.; Ding W.; Wang X.; Yan Q. Synthesis of a Novel Mesoporous Iron Phosphate. Chem. Commun. 2001, 709–710. [Google Scholar]
- Julien C. M.; Zaghib K.; Mauger A.; Massot M.; Ait-Salah A.; Selmane M.; Gendron F. Characterization of the Carbon Coating onto LiFePO4 Particles Used in Lithium Batteries. J. Appl. Phys. 2006, 100, 063511. [Google Scholar]
- Mi C.; Zhang X.; Zhao X.; Li H. Effect of Sintering Time on the Physical and Electrochemical Properties of LiFePO4/C Composite Cathodes. J. Alloys Compd. 2006, 424, 327–333. [Google Scholar]
- Wang D.; Li H.; Shi S.; Huang X.; Chen L. Improving the Rate Performance of LiFePO4 by Fe-site Doping. Electrochim. Acta 2005, 50, 2955–2958. [Google Scholar]
- Yang J.; Xu J. J. Synthesis and Characterization of Carbon-Coated Lithium Transition Metal Phosphates LiMPO4 (M = Fe, Mn, Co, Ni) Prepared via a Nonaqueous Sol-Gel Route. J. Electrochem. Soc. 2006, 153, A716. [Google Scholar]
- Wang G. X.; Bewlay S.; Yao J.; Ahn J. H.; Dou S. X.; Liu H. K. Characterization of LiMxFe(1–x)PO4 (M = Mg, Zr, Ti) Cathode Materials Prepared by the Sol-Gel Method. Electrochem. Solid-State Lett. 2004, 7, A503. [Google Scholar]
- Zhuang D.; Zhao X.; Xie J.; Tu J.; Zhu T.; Cao G. One-step Solid-state Synthesis and Electrochemical Performance of Nb-doped LiFePO4/C. Acta Phys.-Chim. Sin. 2006, 22, 840–844. [Google Scholar]
- Xia Y.; Yoshio M.; Noguchi H. Improved Electrochemical Performance of LiFePO4 by Increasing Its Specific Surface Area. Electrochim. Acta 2006, 52, 240–245. [Google Scholar]
- Dominko R.; Bele M.; Gaberscek M.; Remskar M.; Hanzel D.; Pejovnik S.; Jamnik J. Impact of the Carbon Coating Thickness on the Electrochemical Performance of LiFePO4/C Composites. J. Electrochem. Soc. 2005, 152, A607. [Google Scholar]
- Guo Z. P.; Liu H.; Bewlay S.; Liu H. K.; Dou S. X. Start-Fine-Particle Carbon-enriched Li0.98Mg0.02FePO4 Synthesized by A Novel Modified Solid-State Reaction. Synth. Met. 2005, 153, 113–116. [Google Scholar]
- Liu H.; Cao Q.; Fu L. J.; Li C.; Wu Y. P.; Wu H. Q. Doping Effects of Zinc on LiFePO4 Cathode Material for Lithium Ion Batteries. Electrochem. Commun. 2006, 8, 1553–1557. [Google Scholar]
- Shin H.; Cho W.; Jang H. Electrochemical Properties of Carbon-coated LiFePO4 Cathode Using Graphite, Carbon Black, and Acetylene Black. Electrochim. Acta 2006, 52, 1472–1476. [Google Scholar]
- Sides C. R.; Croce F.; Young V. Y.; Martin C. R.; Scrosati B. A High-Rate, Nanocomposite LiFePO4/Carbon Cathode. Electrochem. Solid-State Lett. 2005, 8, A484. [Google Scholar]
- Teng T.; Yang M.; Wu S.; Chiang Y. Electrochemical Properties of LiFe0.9Mg0.1PO4/Carbon Cathode Materials Prepared by Ultrasonic Spray Pyrolysis. Solid State Commun. 2007, 142, 389–392. [Google Scholar]
- Roberts M.; Spong A. D.; Vitins G.; Owen J. High Throughput Screening of the Effect of Carbon Coating in LiFePO4 Electrodes. J. Electrochem. Soc. 2007, 154, A921. [Google Scholar]
- Roberts M.; Vitins G.; Denuault G.; Owen J. High Throughput Electrochemical Observation of Structural Phase Changes in LiFe(1–x)Mn(x)PO4 During Charge and Discharge. J. Electrochem. Soc. 2010, 157, A381. [Google Scholar]
- Roberts M.; Vitins G.; Owen J. High-throughput Studies of Li1–xMgx/2FePO4 and LiFe1–yMgyPO4 and the Effect of Carbon Coating. J. Power Sources 2008, 179, 754–762. [Google Scholar]
- Roberts M.; Huang A. F.; Johns P.; Owen J. Dip–spin Coating of Reticulated Vitreous Carbon with Composite Materials to Act as an Electrode for 3D Microstructured Lithium Ion Batteries. J. Power Sources 2013, 224, 250–259. [Google Scholar]
- Levie R. D. Adv. Electrochem. Electrochem. Eng. 1967, 6, 329. [Google Scholar]
- Johns P.; Roberts M.; Wakizaka Y.; Sanders J. H.; Owen J. How the Electrolyte Limits Fast Discharge in Nanostructured Batteries and Supercapacitors. Electrochem. Commun. 2009, 11, 2089–2092. [Google Scholar]
- Oudenhoven J. F. M.; Labohm F.; Mulder M.; Niessen R. A. H.; Mulder F. M.; Notten P. H. L. In Situ Neutron Depth Profiling: a Powerful Method to Probe Lithium Transport in Micro-batteries. Adv. Mater. 2011, 23, 4103–4106. [DOI] [PubMed] [Google Scholar]
- Van De Krol R.; Goossens A.; Schoonman J. Spatial Extent of Lithium Intercalation in Anatase TiO2. J. Phys. Chem. B 1999, 103, 7151–7159. [Google Scholar]
- Siegel J. B.; Lin X.; Stefanopoulou A. G.; Hussey D. S.; Jacobson D. L.; Gorsich D. Neutron Imaging of Lithium Concentration in LFP Pouch Cell Battery. J. Electrochem. Soc. 2011, 158, A523. [Google Scholar]
- Larson A. C.; Von Dreele R. B. EXPGUI, a graphical user interface for GSAS. J. Appl. Crystallogr. 2001, 34, 210. [Google Scholar]
- Sobkowiak A.; Roberts M. R.; Younesi R.; Ericsson T.; Tai C.; Andersson A. M. For an Enhanced Cathode Functionality. Chem. Mater. 2013, 25, 3020–3029. [Google Scholar]
- Birkholz M.Thin Film Analysis by Xray Scattering; Wiley-VCH: Weinheim, Germany, 2005. [Google Scholar]
- Shearing P. R.; Howard L. E.; Jørgensen P. S.; Brandon N. P.; Harris S. J. Characterization of the 3-dimensional Microstructure of a Graphite Negative Electrode from a Li-ion Battery. Electrochem. Commun. 2010, 12, 374–377. [Google Scholar]
- Asfaw H. D.; Roberts M. R.; Younesi R.; Edstrom K. Emulsion-templated Bicontinuous Carbon Network Electrodes for Use in 3D Microstructured Batteries. J. Mater. Chem. A 2013, 1, 13750–13758. [Google Scholar]
- Valvo M.; Roberts M.; Oltean G.; Sun B.; Rehnlund D.; Brandell D.; Nyholm L.; Gustafsson T.; Edström K. Electrochemical Elaboration of Electrodes and Electrolytes for 3D Structured Batteries. J. Mater. Chem. A 2013, 1, 9281. [Google Scholar]
- Long J. W.; Dunn B.; Rolison D. R.; White H. S. Three-dimensional Battery Architectures. Chem. Rev. 2004, 104, 4463–4492. [DOI] [PubMed] [Google Scholar]
- Suo L.; Hu Y.-S.; Li H.; Armand M.; Chen L. A New Class of Solvent-in-Salt Electrolyte for High-energy Rechargeable Metallic Lithium Batteries. Nat. Commun. 2013, 4, 1481. [DOI] [PubMed] [Google Scholar]
Associated Data
This section collects any data citations, data availability statements, or supplementary materials included in this article.


