

Abstract
Interventions which inhibit TOR activity (including rapamycin and caloric restriction) lead to downstream gene expression changes and increased lifespan in laboratory models. However, the role of mTOR signaling in human aging is unclear.
We tested the expression of mTOR-related transcripts in two independent study cohorts; the InCHIANTI population study of aging and the San Antonio Family Heart Study (SAFHS). Expression of 27/56 (InCHIANTI) and 19/44 (SAFHS) genes were associated with age after correction for multiple testing. 8 genes were robustly associated with age in both cohorts. Genes involved in insulin signaling (PTEN, PI3K, PDK1), ribosomal biogenesis (S6K), lipid metabolism (SREBF1), cellular apoptosis (SGK1), angiogenesis (VEGFB), insulin production and sensitivity (FOXO), cellular stress response (HIF1A) and cytoskeletal remodeling (PKC) were inversely correlated with age, whereas genes relating to inhibition of ribosomal components (4EBP1) and inflammatory mediators (STAT3) were positively associated with age in one or both datasets.
We conclude that the expression of mTOR-related transcripts is associated with advancing age in humans. Changes seen are broadly similar to mTOR inhibition interventions associated with increased lifespan in animals. Work is needed to establish whether these changes are predictive of human longevity and whether further mTOR inhibition would be beneficial in older people.
Keywords: Aging, aging mechanisms, mTOR, human population
1. Introduction
Advancing age confers an increased risk of many chronic diseases including many cancers (Butler et al., 2008). However in humans, aging is a heterogeneous process (Wieser et al., 2011), with some individuals reaching advanced ages without succumbing to common diseases while others appear to age at an increased rate. The mechanisms causing these differences are currently unclear.
Current theories of aging vary, with research mainly focused on animal models. A pathway that is perhaps better understood than most in animal models of aging is the Target of Rapamycin (TOR) signaling pathway (mTOR in mammals) (Avruch et al., 2006). The mTOR pathway is highly conserved and regulates processes including protein synthesis, lipid metabolism, glycolysis, angiogenesis, apoptosis, inflammation and autophagy (Proud, 2011) (Figure 1). Increasing age has been associated with perturbations to most of these factors; decreases in protein synthesis with age are well documented in various tissues in man and animal models (Kennedy and Kaeberlein, 2009), whereas age-related increases to lipid profiles (AbouRjaili et al., 2010; Kolovou et al., 2011) and inflammatory processes (Chung et al., 2011) have also been reported.
Figure 1. Schematic Diagram of the mTOR signaling pathway.

The figure illustrates the mTOR signaling pathway in mammals. Adapted from (Dazert and Hall, 2011).
The mTOR pathway is responsive to changes in energy status, nutrient availability, inflammatory changes and DNA damage (Avruch et al., 2006). Mammalian TOR signaling is mediated through two separate complexes mTORC1 and mTORC2. The complex mTORC1 is activated via the AKT and PI3K pathways whereas mTORC2 signals via the RAS and RAF pathways (Dobashi et al., 2011). It has been shown in animal models (including mammals such as mice and Rhesus monkeys) that caloric restriction increases lifespan and delays the onset of diabetes, cancer, cardiovascular disease and brain atrophy (Colman et al., 2009; Masoro, 2005). Alterations to mTOR signaling, in particular those elements that respond to nutrient availability, are thought to provide a mechanism for this effect. It is also noteworthy that the only pharmacological intervention shown to influence lifespan in rodent animal models is the immunosuppressant rapamycin, which targets mTOR signaling (Cao et al., 2011; Harrison et al., 2009). Rapamycin is an antagonist of the mTORC1 complex and is proposed to down-regulate translation, increase autophagy, alter metabolism and lead to an increased stress response via the mTOR pathway (Bjedov and Partridge, 2011).
The role of mTOR signaling in influencing longevity is well documented in the relatively short-lived animal models (Howell and Manning, 2011; Jia and Levine, 2010; Partridge et al., 2011), however there is currently little data on the relevance of mTOR signaling to human aging and longevity. We hypothesized that differential mTOR signaling will be associated with normal aging in humans, and that alterations to the pathway may influence longevity. In order to determine the role and relevance of mTOR signaling in human aging, we undertook a microarray-based screen of components of the pathway in two large human cross-sectional population-based studies; first we performed an initial discovery analysis in the InCHIANTI study (Ferrucci et al., 2000), and then carried out a complementary analysis in the San Antonio Family Heart Study (SAFHS) (Mitchell et al., 1996). We have used two diverse cross-sectional studies in whole blood or isolated lymphocyte samples, from Italian (whole blood) and Mexican American (lymphocyte) populations in InCHIANTI and SAHFS studies respectively. There are differences in RNA collection and storage techniques, RNA isolation methods and microarray format between the populations. Observation of consistent associations between populations would indicate that significant associations noted between components of the mTOR pathway and human aging are robust, and not due to differences in cell composition or analytical technique.
2. Materials and Methods
2.1 Study cohorts
InCHIANTI (Ferrucci et al., 2000) is a population-based, prospective study in the Chianti area (Tuscany) of Italy. The participants were enrolled in 1998–2000, and were interviewed and examined every three years. Ethical approval was granted by the Instituto Nazionale Riposo e Cura Anziani institutional review board in Italy. Participants gave informed consent to participate. Notable results identified using the InCHIANTI dataset were then validated in publically available expression data from a separate population, the San Antonio Family Heart Study (SAFHS) (Mitchell et al., 1994). Study participant characteristics are shown in table 1.
Table 1.
Characteristics of the study samples
| InCHIANTI | n | % | SAFHS | n | % |
|---|---|---|---|---|---|
| Age (years) | Age (years) | ||||
| 15yrs – 29yrs | 0 | 0 | 15yrs – 29yrs | 433 | 34.92 |
| 30yrs – 49yrs | 86 | 12.32 | 30yrs – 49yrs | 495 | 39.92 |
| 50yrs – 69yrs | 98 | 14.04 | 50yrs – 69yrs | 237 | 19.11 |
| 70yrs – 89yrs | 483 | 69.2 | 70yrs – 89yrs | 71 | 5.73 |
| 90yrs – 104yrs | 31 | 4.44 | 90yrs – 104yrs | 4 | 0.32 |
| Gender | Gender | ||||
| Males | 313 | 45.04 | Males | 506 | 40.87 |
| Females | 382 | 54.96 | Females | 732 | 59.13 |
| Pack years smoked (lifetime) | Smoking-status | ||||
| None | 376 | 54.1 | Non-smoker | 922 | 74.47 |
| <20 | 101 | 14.53 | Smokes | 297 | 23.99 |
| 20–39 | 55 | 7.91 | Missing | 19 | 1.53 |
| 40+ | 153 | 22.01 | |||
| missing | 10 | 1.44 | |||
| Site | |||||
| Greve | 339 | 48.78 | |||
| Bagno a Ripoli | 356 | 51.22 | |||
| Education | |||||
| None | 94 | 13.53 | |||
| Elementary | 319 | 45.9 | |||
| Secondary | 93 | 13.38 | |||
| High school | 87 | 12.52 | |||
| University/Professional | 102 | 14.68 | |||
|
| |||||
| Mean | SD | ||||
|
| |||||
| Waist Circumference (cm) | |||||
| Males | 97.94 | 10.38 | |||
| Females | 93.15 | 12.95 | |||
| Leukocyte fraction (%) | |||||
| Neutrophils | 57.47 | 9.13 | |||
| Lymphocytes | 30.85 | 8.66 | |||
| Monocytes | 7.97 | 2.13 | |||
| Eosinophils | 3.17 | 2.11 | |||
2.2 RNA collection, extraction and the whole transcriptome scan
In the InCHIANTI study, peripheral blood specimens were taken using the PAXgene system (Debey-Pascher et al., 2009), to preserve transcript expression levels as they would be in vivo. Samples were collected in 2008/9 (wave 4) from 733 participants and mRNA was extracted using the PAXgene Blood mRNA kit (Qiagen, Crawley, UK) according to the manufacturer’s instructions. Whole genome expression profiling of the samples was conducted using the Illumina Human HT-12 microarray (Illumina, San Diego, USA) as previously described (Zeller et al., 2010). Data processing was done using the Illumina and Beadstudio software (Illumina, San Diego, USA) as previously described (Zeller et al., 2010). All microarray experiments and analyses complied with MIAME guidelines. Data from 695 individuals and 16,571 probes passed our quality control process; 12 subjects were excluded on the basis that their mean signal intensities across all probes with p = <0.01 were >3 standard deviations from the cohort mean; probes with <5% of subjects giving intensities with p = <0.01 different from background were also excluded, 3 further exclusions were made due to missing leukocyte data. The remaining expression data went forward into our analyses, but was first normalized using natural log transformation and standardized using z-scores.
The San Antonio Family Heart Study (SAFHS) samples consisted of isolated lymphocytes collected on the participant’s first visit to the clinic between 1994 and 1995. RNA was then isolated from the 1,280 samples using a modified procedure of the QIAGEN RNeasy 96 protocol (QIAGEN Inc) and hybridized to the Illumina sentrix human whole genome (WG-6) series I Beadchips (Illumina, San Diego, USA) as described by Goring et al (Goring et al., 2007). Expression profiling of the samples was done by the Illumina Beadarray 500GX reader using Illumina Beadscan image data acquisition software (Illumina, San Diego, USA). Expression data was normalized using natural log and standardized z-scores (see Goring at al 2007 for details).
2.3 mTOR Pathway
The genes of interest were identified using the Gene Ontology (GO) project (www.geneontology.org) and the Kyoto Encyclopedia of Genes and Genomes (KEGG). The search terms used were “mTOR” and “mTOR signaling”. The criteria for inclusion in the analysis were that the transcript had to be present in at least one of the cohorts and be part of the mTOR signaling pathway as indicated by KEGG and gene ontology. 56 genes were identified as being both in a relevant GO pathway and also present in the InCHIANTI cohort array data (our discovery cohort), represented by 94 unique transcripts, with some genes being represented by >1 probe (Supplementary table S1 online). Out these 56 genes, 42 were present in both the SAFHS and InCHIANTI data. This study is powered to detect expression differences of 0.22 and 0.1185 SD when adjusting for confounding factors in the InCHIANTI and SAFHS studies respectively.
2.4 Statistical analysis
The relationship between age at extraction and markers of mTOR signaling (see supplementary table S1 online) was first tested in the InCHIANTI cohort using linear regression models with standardized (z-scores) natural log-transformed gene expression levels as the dependent variable. Separate regression models were fitted for each of the 94 expressed probes, using false discovery rate (FDR) adjusted p-values (q-values) and a cut-off of q≤0.05 we account for multiple testing (Strimmer, 2008). R (statistical computing language) v2.8.1 was used for large-scale analyses and STATA v10.1 for confirmation and additional exploration.
In InCHIANTI, regression models were adjusted for potential confounding factors on gene expression: gender; lifetime pack-years smoked (in five categories: none, less than 20 years, 20 to 39 years, 40 plus years, and missing); waist circumference (as a continuous trait); highest level of education attained (in five categories: none, elementary, secondary, high school, and university/professional); study site (individuals were drawn from a rural village [Greve] and an urban population [Bagno a Ripoli]); and the proportion of leukocyte cell types (neutrophil %, lymphocyte %, monocyte %, eosinophil %). We also controlled for potential hybridization and/or amplification batch effects in all our analyses.
2.5 Principal components analysis
We used a Principal Components Analysis to determine any underlying variance across the 56 mTOR-related genes in the InCHIANTI individuals. Expression data was normalized (natural log) prior to analysis. R package ‘psych’ (Revelle, 2011) was used to perform the analysis, with the orthogonal rotation ‘varimax’ to persuade each component to correlate highly with few variables, rather than with few at a lower level.
2.6 Replication in SAFHS data
To assess the potential for disruption of mTOR signaling in a second, unrelated, population, we then tested mTOR-related genes for associations with age in the San Antonio Family Heart Study (SAHFS) (Mitchell et al., 1994). The data from this population was collected from a different tissue type (Isolated lymphocytes rather than whole blood), and was produced different methodologies. Unsurprisingly, the dataset contained a different, but overlapping, set of transcripts for analysis. In this population, expression data was available for 1,238 individuals. We tested the association between mTOR genes and age using linear regression models with natural log-transformed gene expression levels as the dependent variable. We used the false discovery rate (FDR) to account for multiple testing, with q≤0.05 being taken as statistically significant. R (statistical computing language) v2.8.1 was used for large-scale analyses and STATA v10.1 for confirmation and additional exploration. Regression models were adjusted for potential confounding factors; gender and smoking status (in 3 categories; non-smoker, smoker and missing). For an association between a particular transcript and age to be considered robust, the FDR q-value had to be less than 0.05. For a gene to be considered concordant between studies, the transcript in question had to be present for analysis in both cohorts, and to show ether a significant association in the same direction in both studies, or no association in both.
2.7 Sensitivity analysis
In order to investigate the possibility that our effects might be confounded by concurrent diseases of aging, first we used a subset of our population age ranged 15–55 years from the SAFHS data set, in which rates of age-related diseases are assumed to be much reduced. Linear regression models with natural log transformed gene expression levels as the dependent variable where run for the 1,029 individuals in this subset. False discovery rate (FDR) was used to account for multiple testing with q≤0.05 being taken as statistically significant.
Secondly we excluded 100 individuals with type two diabetes (T2D), identified by high fasting blood-glucose (>126mg/dL) at any wave in the InCHIANTI study, to ensure that the results were not being confounded by diabetes or use of the medication metformin, which acts on components of the mTOR pathway to inhibit gluconeogenesis (Towler and Hardie, 2007). The same linear regression models were used, including a false discovery rate to account for multiple testing.
3. Results
3.1 Study Cohorts
The InCHIANTI study included 695 people ranging in age from 30 to 104 years with a mean age of 72.6 years (SD: 15.3). Nearly 45% of the participants were male and 54% had been non-smokers. The RNA samples were collected at wave 4 (year 9) of the study, from two sites in Italy. The San Antonio Family Heart Study (SAFHS) involved 1,238 individuals with ages ranging from 15 to 94 years (mean age: 39, SD: 16.7). The biggest age group was the 30–49 year olds with 40% of the total cohort. 59% of the cohort was female, and 74% were non-smokers (table 1).
3.2 Analysis of the mTOR Pathway
In an analysis of mTOR-related transcripts in the InCHIANTI cohort, we captured expression data for a total of 27 of 56unique genes (48%) were identified to be significantly associated with age (see figure 2 for flow-chart of study design and results). All significant transcripts reached a false discovery rate (FDR) of q<0.05 after adjustment for major confounders. 7 (agonist and antagonist) genes were found to be up-regulated with age and 20 down regulated with age (supplementary table S2 online). EIF4G3 was the most strongly age associated gene (P=3.19×10⁻⁹, coef=0.001129).
Figure 2. Flow-chart of the analysis and results.
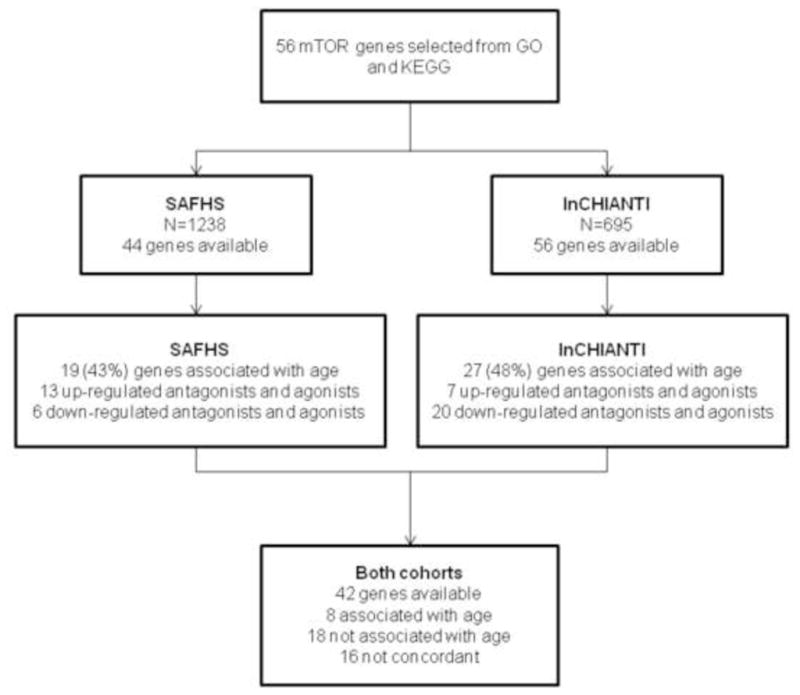
The figure illustrates the work process of the study. KEGG and GO were used to select the relevant genes which were then subsequently tested in both InCHIANTI and SAFHS. Comparisons were then made between the two cohorts. Associated genes had a FDR value of q< 0.05.
Genes that vary in expression over the age range are involved in insulin signaling (PTEN co-eff=−0.01 q=5.30×10⁻⁴, PI3K co-eff=−0.006 q=2.90×10⁻², PDK1 co-eff=−0.01 q=7.90×10⁻⁴), biogenesis of ribosomal subunits (S6K, co-eff=−0.01 q=2.60×10⁻³), lipid metabolism (SREBF1, co-eff=−0.008 q=7.10×10⁻³), cellular apoptosis (SGK1, co-eff=−0.011 q=6.40×10⁻⁴), angiogenesis (VEGFB, co-eff=−0.009 q=6.00×10⁻⁴), insulin production and sensitivity (FOXO1, co-eff=−0.016 q=2.30×10⁻⁷), cellular stress response (HIF1A, co-eff=−0.006 q=1.00×10⁻²) and cytoskeletal remodeling (PKC, co-eff=−0.012 q=3.00×10⁻⁴) were inversely correlated with advancing age, whereas genes relating to inhibition of ribosomal components (4EBP2, co-eff=0.009 q=3.3×10⁻³) and inflammatory mediators (STAT3, co-eff=0.007 q=1.70×10⁻²) were positively associated with age (supplementary table S2 online).
In the SAHFS dataset, expression data was available for 44 unique mTOR-related genes. 19 of the unique genes tested in SAHFS reached study wide significance for association with age after accounting for multiple statistical testing of array data (FDR q≤0.05) (supplementary table S3). There were 42 genes represented in both datasets, 26 (62%) of which showed concordance between the studies; 8 of these genes where robustly associated (FDR q-value < 0.05) with age in both cohorts, whilst 18 genes were not associated with age in both cohorts (figure 3; table 2); the PRKAA1 component of the AMPK complex was associated with age in both, as was RHEB (activates the protein kinase activity of mTORC1), but with different directions of effect.
Figure 3. Venn diagram.
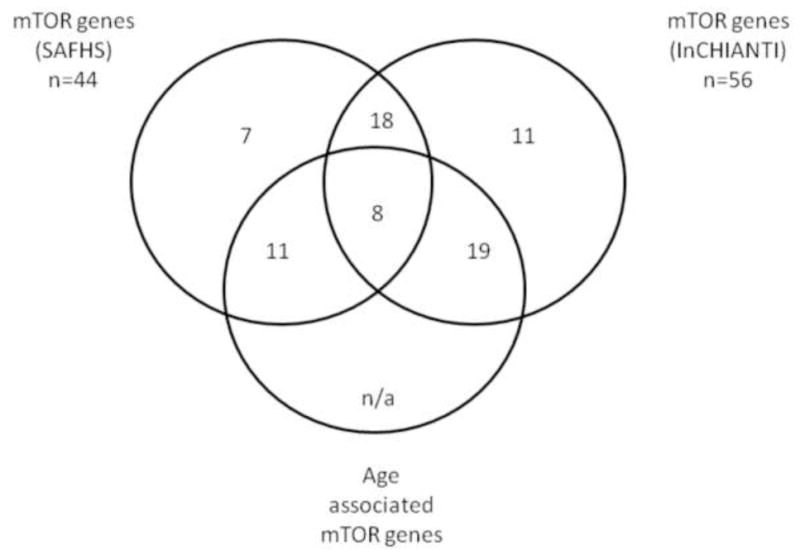
The figure illustrates the number of genes which are and are not associated with age in both the InCHIANTI and SAFHS cohorts, and indentifies the number of overlapping genes between the two cohorts.
Table 2. The ten most closely associated mTOR probes with age in both datasets.
The ten most closely associated (by false-discovery rate q-value) probes in the mTOR pathway with age (years) in InCHIANTI and SAFHS, ordered alphabetically by gene ID.
| InChianti | SAFHS | |||||||||||
|---|---|---|---|---|---|---|---|---|---|---|---|---|
|
| ||||||||||||
| Gene | p-value | B | 95% CIs | OR | q-value | p-value | B | 95% CIs | OR | q-value | ||
| EIF4EBP2 | 1.4×10⁻³ | 0.009 | 0.004 | 0.015 | 1.009 | 3.3×10⁻³ | 6.7×10⁻³ | 0.004 | 0.001 | 0.008 | 1.004 | 1.7×10⁻² |
| EIF4G3 | 9.9×10⁻⁹ | 0.016 | 0.011 | 0.022 | 1.016 | 2.3×10⁻⁷ | 8.9×10⁻¹¹ | 0.011 | 0.008 | 0.014 | 1.011 | 1.8×10⁻⁹ |
| NFKB1 | 1.7×10⁻⁴ | −0.011 | −0.017 | −0.005 | 0.989 | 6.6×10⁻⁴ | 1.0×10⁻⁵ | −0.008 | −0.011 | −0.005 | 0.992 | 6.9×10⁻⁵ |
| PRKAA1 | 9.6×10⁻⁵ | −0.01 | −0.015 | −0.005 | 0.990 | 5.3×10⁻⁴ | 1.9×10⁻³ | 0.005 | 0.002 | 0.009 | 1.005 | 6.2×10⁻³ |
| PTEN | 9.4×10⁻⁵ | −0.01 | −0.015 | −0.005 | 0.990 | 5.3×10⁻⁴ | 5.0×10⁻⁴ | −0.006 | −0.009 | −0.003 | 0.994 | 2.0×10⁻³ |
| RHEB | 1.9×10⁻² | −0.007 | −0.013 | −0.002 | 0.993 | 2.6×10⁻² | 3.8×10⁻² | 0.004 | 0.001 | 0.006 | 1.004 | 4.6×10⁻² |
| RPS6 | 9.1×10⁻³ | −0.007 | −0.013 | −0.002 | 0.993 | 1.5×10⁻² | 5.5×10⁻⁴ | −0.006 | −0.009 | −0.003 | 0.994 | 2.2×10⁻³ |
| SREBF1 | 3.5×10⁻³ | −0.008 | −0.014 | −0.003 | 0.992 | 7.1×10⁻³ | 7.6×10⁻³² | −0.02 | −0.023 | −0.017 | 0.980 | 2.1×10⁻²⁹ |
| STAT3 | 1.1×10⁻² | 0.007 | 0.002 | 0.012 | 1.007 | 1.7×10⁻² | 9.6×10⁻⁴ | 0.006 | 0.002 | 0.009 | 1.006 | 3.4×10⁻³ |
| VEGFB | 1.2×10⁻⁴ | −0.009 | −0.013 | −0.004 | 0.991 | 6.0×10⁻⁴ | 3.6×10⁻⁴ | −0.006 | −0.009 | −0.002 | 0.994 | 1.5×10⁻³ |
Correlation coefficients (B) show changes in standardized expression per year of age. CIs are the confidence intervals for B.
OR (exp(B)) is the fold-change in expression per year of age
Q-value represents the false-discovery rate (FDR) adjusted p-value
InChianti models adjusted for: gender, smoking-status, highest education level, site, hybridization-batch, amplification-batch, leukocyte proportions. N = 695
SAFHS models adjusted for: gender, smoking-status. N = 1238
3.3 Principal Components Analysis (PCA)
In a PCA analysis we found no distinctive (sub-)components of variance within the age associated probes.
3.4 Sensitivity analyses
A sensitivity analysis in the SAFHS data showed 10 out of the 19 age-associated genes (in the original analysis) retained significance in the younger subset (15–55 years), indicating that concurrent disease, or alterations to the ratio of lymphocyte subsets, known to alter with advanced age, were not likely to be primary drivers of our observations.
Excluding the diabetic individuals (n=100; omitted in this analysis to remove effects of metformin, an mTOR inhibitor) from the InCHIANTI sample minimally altered the results (see supplementary table 4). The effect size (coefficient) for each probe remained very similar, however some probes are no longer statistically significant, probably due to a loss in power after exclusion of almost 1/6th of the sample.
4. Discussion
Inhibition of mTOR signaling in laboratory models is associated with increased survival, but relevance to (much longer lived) humans is unclear. In this study we aimed to identify age associated changes in transcript expression for component genes of the mTOR pathway in two large human populations. We report here the first direct evidence that differential expression of in-vivo mTOR signaling is associated with human age. Having examined and presented results for all available probes in InCHIANTI and/or SAFHS, we found that 48% and 43% of the relevant genes were associated with age in the InCHIANTI and SAFHS cohorts respectively. Of these, 8 genes were significantly and robustly associated with age in both populations, whilst 18 genes present in both populations showed no associations (figure 3). Significantly associated genes included the translational initiation factors EIF4EBP2 and EIF4G3 and the ribosomal protein S6 kinase (S6K), the inflammatory mediators STAT3 and NFKB1, the lipid metabolism gene SREBF1, the dual specificity phosphatase PTEN and the angiogenesis factor VEGFB (table 2). Most downstream gene transcripts showed reduced expression with advancing age, except for increased expression of genes involved in inhibition of ribosomal components and inflammatory mediators, a pattern similar to that found in long-lived lab animals under mTOR inhibition. Principal component analysis demonstrated that no specific subset of mTOR-related genes accounted for most of the association with age, indicating that all of the downstream sub-pathways were probably affected.
Multiple transcripts associated with translational control or biogenesis of ribosomes were significantly associated with age. The EIF4EBP2 gene which is an inhibitor of translation, and the initiation factor EIF4G3 were up-regulated in both cohorts (see supplementary tables S2 and S3 online). Similarly, most components of the S6K (RPS6KA2 and RPS6KB1) which phosphorylate the 40S ribosomal subunit and promote the assembly of functional ribosomes were found to be down-regulated in InCHIANTI (see supplementary table S2 online). These results are consistent with an overall down-regulation of protein synthesis, as noted in several species and many tissue types (Blazejowski and Webster, 1983; Hansen et al., 2007; Ma and Blenis, 2009). Translational initiation factors are also required for the pioneer round of translation in the nonsense-mediated decay mRNA degradation pathway (Lejeune et al., 2004). This pathway detects and degrades aberrant transcripts (Frischmeyer and Dietz, 1999), so the up-regulation of EIF4G3 may reflect a response to an increase in the presence of abnormal mRNAs in elderly people, which would be consistent with our earlier finding of disruption to splicing processes with advancing age (Harries et al., 2011).
Human ageing is also associated with immune senescence and changes in the inflammatory milieu (Chung et al., 2011). Accordingly, two of the 8 genes identified in our study (STAT3 and NFKB1) lie within this pathway. STAT3 is activated in response to several cytokines and growth factors such as IFNs and interleukins 5 and 6. The NFKB gene is responsible for the orchestration of the inflammatory response to both infection and tissue damage and is arguably its most important function (Mohamed and McFadden, 2009). In our study we found NFKB1 to be negatively correlated with age. This association would suggest an overall deterioration of the immune system with increasing age. Metabolic control is also known to deteriorate with age (Kolovou et al., 2011). Accordingly, we found that the SREBF1 gene, involved in lipid metabolism and the PTEN involved in insulin signaling were altered in our study. Both genes were inversely correlated with age in both cohorts (table 2) perhaps reflecting the known decreases in metabolic control that occur with increasing age. Finally, we found the transcript coding for the angiogenesis factor VEGFB to be inversely associated with age in both cohorts. VEGF signaling is well known to promoter angiogenesis and is also a primary regulator of cardiomyocyte function. This could reflect decreases in vascular function known to occur in ageing (Toda, 2012). It is also worth noting that this analysis was probably not driven by underlying concurrent disease phenotypes; by using a younger, presumably healthy subset and a subset without diabetes in our sensitivity analysis we found that the associations between mTOR-related genes and age were still apparent.
Our principal components analysis revealed that no single statistical component was responsible for the effects we saw. It is likely therefore that all components of mTOR signaling may be involved. This is supported by our observation that the 8 genes we found to be significantly associated with age in both the InCHIANTI and SAFHS datasets do not one lie within one sub-pathway. It must be noted however, that the precise identity of the genes affected in an individual, when sampled on any particular day may differ. It is most likely that different people will have different branches of the pathway affected depending on their particular physiological circumstances. Proteins in the mTOR pathway, like other signaling pathways, are activated by phosphorylation and dephosphorylation events (Avruch et al., 2006; Proud, 2011). In this analysis it is not possible to identify phosphorylation events leading to activation and those leading to repression. In our analysis, the expression of the TORC1 and TORC2 genes were not themselves significantly associated with age, however the expression of these genes is highly labile and tightly regulated. Small changes in their expression can result in large scale alterations to the signaling potential of the pathway as a whole. It is therefore unsurprising that we did not identify associations with these genes in a cohort consisting of a single measure of gene expression taken on a single occasion.
The differences between the associations found in InCHIANTI and those found in SAHFS may be because the SAHFS data were collected on an older version of the microarray chip, and some of the probes available in the InCHIANTI data were not represented in SAHFS data. We found only two genes (PRKAA1, RHEB) where an association identified in both InCHIANTI and SAHFS had an opposite direction of effect, although it is unclear whether the probes on the different chips measure the same isoform. This may be due to cell-type differences between the two cohorts; InCHIANTI samples were from whole blood, whereas SAHFS samples were isolated leukocytes. There are advantages to both approaches; the use of isolated cells allows much of the cell-type specific variation in the expression of separate white blood cell types to be accounted for, but the expression patterns achieved from the InCHIANTI samples are likely to be more representative of the in vivo situation since they have undergone minimal post-bleed sample handling. White blood cell composition measures were also included in our fully adjusted regression models, as can be evidenced from the concordance achieved between the two sets of data. The fact that key parts of the mTOR pathway were replicated despite differences in blood collection, RNA extraction and storage and analytical approach suggests that our findings are robust and reproducible.
Our data are broadly consistent with a general inhibition of mTOR signaling in elderly people, which is in keeping with the increased lifespan noted in animal models treated with TOR inhibitors (Bjedov and Partridge, 2011; Harrison et al., 2009). A possible explanation for this apparent inhibition of mTOR signaling with advancing age may be a survivor effect, where decreased mTOR signaling is associated with greater survival. Future work should test whether inhibition-like mTOR signaling patterns are predictive of human longevity. Work is also needed to confirm these changes in a wider range of tissues, although access to many human tissues for ‘in-vivo’ expression studies is necessarily severely restricted. Humans are far longer lived than any of the laboratory models, and therefore the scope for additional inhibition of mTOR signaling being helpful in humans will need to be tested directly: the current study may provide biomarker targets to such work.
5. Conclusions
We have shown for the first time that the expression of mTOR-related transcripts in-vivo is associated with advancing age in humans. The expression pattern found is broadly similar to that seen with mTOR inhibition interventions associated with increased lifespan in much shorter lived laboratory models. Work is needed to establish whether these changes are predictive of human longevity and whether potentiating mTOR inhibition further would be beneficial in older people.
Supplementary Material
Highlights.
Inhibition of mTOR signaling increases lifespan in animal models.
We found that human mTOR-related gene expression varies across a wide age-range.
Genes involved in regulation of protein synthesis were prominent in our analysis.
mTOR signaling may therefore be critical to human ageing, as in the animal models.
Acknowledgments
This study was supported in part by the Intramural Research Program, National Institute on Aging, and the U.S. National Institutes of Health. We thank the many people who contributed to the InCHIANTI study, including all of the anonymous participants. The US National Institute on Aging intramural research program contributed the array data and supported this analysis. We also acknowledge the San Antonio Family Heart Study for the use of their data.
Footnotes
Publisher's Disclaimer: This is a PDF file of an unedited manuscript that has been accepted for publication. As a service to our customers we are providing this early version of the manuscript. The manuscript will undergo copyediting, typesetting, and review of the resulting proof before it is published in its final citable form. Please note that during the production process errors may be discovered which could affect the content, and all legal disclaimers that apply to the journal pertain.
References
- AbouRjaili G, Shtaynberg N, Wetz R, Costantino T, Abela GS. Current concepts in triglyceride metabolism, pathophysiology, and treatment. Metabolism: clinical and experimental. 2010;59:1210–20. doi: 10.1016/j.metabol.2009.11.014. [DOI] [PubMed] [Google Scholar]
- Avruch J, Hara K, Lin Y, Liu M, Long X, Ortiz-Vega S, Yonezawa K. Insulin and amino-acid regulation of mTOR signaling and kinase activity through the Rheb GTPase. Oncogene. 2006;25:6361–72. doi: 10.1038/sj.onc.1209882. [DOI] [PubMed] [Google Scholar]
- Bjedov I, Partridge L. A longer and healthier life with TOR down-regulation: genetics and drugs. Biochemical Society transactions. 2011;39:460–5. doi: 10.1042/BST0390460. [DOI] [PubMed] [Google Scholar]
- Blazejowski CA, Webster GC. Decreased rates of protein synthesis by cell-free preparations from different organs of aging mice. Mechanisms of ageing and development. 1983;21:345–56. doi: 10.1016/0047-6374(83)90051-9. [DOI] [PubMed] [Google Scholar]
- Butler RN, Miller RA, Perry D, Carnes BA, Williams TF, Cassel C, Brody J, Bernard MA, Partridge L, Kirkwood T, Martin GM, Olshansky SJ. New model of health promotion and disease prevention for the 21st century. BMJ. 2008;337:a399. doi: 10.1136/bmj.a399. [DOI] [PMC free article] [PubMed] [Google Scholar]
- Cao K, Graziotto JJ, Blair CD, Mazzulli JR, Erdos MR, Krainc D, Collins FS. Rapamycin reverses cellular phenotypes and enhances mutant protein clearance in Hutchinson-Gilford progeria syndrome cells. Science translational medicine. 2011;3:89ra58. doi: 10.1126/scitranslmed.3002346. [DOI] [PubMed] [Google Scholar]
- Chung HY, Lee EK, Choi YJ, Kim JM, Kim DH, Zou Y, Kim CH, Lee J, Kim HS, Kim ND, Jung JH, Yu BP. Molecular inflammation as an underlying mechanism of the aging process and age-related diseases. Journal of dental research. 2011;90:830–40. doi: 10.1177/0022034510387794. [DOI] [PubMed] [Google Scholar]
- Colman RJ, Anderson RM, Johnson SC, Kastman EK, Kosmatka KJ, Beasley TM, Allison DB, Cruzen C, Simmons HA, Kemnitz JW, Weindruch R. Caloric restriction delays disease onset and mortality in rhesus monkeys. Science (New York, NY) 2009;325:201–4. doi: 10.1126/science.1173635. [DOI] [PMC free article] [PubMed] [Google Scholar]
- Dazert E, Hall MN. mTOR signaling in disease. Current opinion in cell biology. 2011;23:744–55. doi: 10.1016/j.ceb.2011.09.003. [DOI] [PubMed] [Google Scholar]
- Debey-Pascher S, Eggle D, Schultze JL. RNA stabilization of peripheral blood and profiling by bead chip analysis. Methods Mol Biol. 2009;496:175–210. doi: 10.1007/978-1-59745-553-4_13. [DOI] [PubMed] [Google Scholar]
- Dobashi Y, Watanabe Y, Miwa C, Suzuki S, Koyama S. Mammalian target of rapamycin: a central node of complex signaling cascades. International journal of clinical and experimental pathology. 2011;4:476–95. [PMC free article] [PubMed] [Google Scholar]
- Ferrucci L, Bandinelli S, Benvenuti E, Di Iorio A, Macchi C, Harris TB, Guralnik JM. Subsystems contributing to the decline in ability to walk: bridging the gap between epidemiology and geriatric practice in the InCHIANTI study. Journal of the American Geriatrics Society. 2000;48:1618–25. doi: 10.1111/j.1532-5415.2000.tb03873.x. [DOI] [PubMed] [Google Scholar]
- Frischmeyer PA, Dietz HC. Nonsense-mediated mRNA decay in health and disease. Human Molecular Genetics. 1999;8:1893– 1900. doi: 10.1093/hmg/8.10.1893. [DOI] [PubMed] [Google Scholar]
- Goring HH, Curran JE, Johnson MP, Dyer TD, Charlesworth J, Cole SA, Jowett JB, Abraham LJ, Rainwater DL, Comuzzie AG, Mahaney MC, Almasy L, MacCluer JW, Kissebah AH, Collier GR, Moses EK, Blangero J. Discovery of expression QTLs using large-scale transcriptional profiling in human lymphocytes. Nature genetics. 2007;39:1208–16. doi: 10.1038/ng2119. [DOI] [PubMed] [Google Scholar]
- Hansen M, Taubert S, Crawford D, Libina N, Lee SJ, Kenyon C. Lifespan extension by conditions that inhibit translation in Caenorhabditis elegans. Aging cell. 2007;6:95–110. doi: 10.1111/j.1474-9726.2006.00267.x. [DOI] [PubMed] [Google Scholar]
- Harries LW, Hernandez D, Henley W, Wood A, Holly AC, Bradley-Smith RM, Yaghootkar H, Dutta A, Murray A, Frayling TM, Guralnik JM, Bandinelli S, Singleton A, Ferrucci L, Melzer D. Human aging is characterized by focused changes in gene expression and deregulation of alternative splicing. Aging cell. 2011 doi: 10.1111/j.1474-9726.2011.00726.x. [DOI] [PMC free article] [PubMed] [Google Scholar]
- Harrison DE, Strong R, Sharp ZD, Nelson JF, Astle CM, Flurkey K, Nadon NL, Wilkinson JE, Frenkel K, Carter CS, Pahor M, Javors MA, Fernandez E, Miller RA. Rapamycin fed late in life extends lifespan in genetically heterogeneous mice. Nature. 2009;460:392–5. doi: 10.1038/nature08221. [DOI] [PMC free article] [PubMed] [Google Scholar]
- Howell JJ, Manning BD. mTOR couples cellular nutrient sensing to organismal metabolic homeostasis. Trends in endocrinology and metabolism: TEM. 2011;22:94–102. doi: 10.1016/j.tem.2010.12.003. [DOI] [PMC free article] [PubMed] [Google Scholar]
- Jia K, Levine B. Autophagy and longevity: lessons from C. elegans. Advances in experimental medicine and biology. 2010;694:47–60. doi: 10.1007/978-1-4419-7002-2_5. [DOI] [PubMed] [Google Scholar]
- Kennedy BK, Kaeberlein M. Hot topics in aging research: protein translation, 2009. Aging Cell. 2009;8:617–23. doi: 10.1111/j.1474-9726.2009.00522.x. [DOI] [PMC free article] [PubMed] [Google Scholar]
- Kolovou G, Bilianou H, Marvaki A, Mikhailidis DP. Aging men and lipids. American journal of men’s health. 2011;5:152–65. doi: 10.1177/1557988310370360. [DOI] [PubMed] [Google Scholar]
- Lejeune F, Ranganathan AC, Maquat LE. eIF4G is required for the pioneer round of translation in mammalian cells. Nature structural & molecular biology. 2004;11:992–1000. doi: 10.1038/nsmb824. [DOI] [PubMed] [Google Scholar]
- Ma XM, Blenis J. Molecular mechanisms of mTOR-mediated translational control. Nature reviews Molecular cell biology. 2009;10:307–18. doi: 10.1038/nrm2672. [DOI] [PubMed] [Google Scholar]
- Masoro EJ. Overview of caloric restriction and ageing. Mechanisms of ageing and development. 2005;126:913–22. doi: 10.1016/j.mad.2005.03.012. [DOI] [PubMed] [Google Scholar]
- Mitchell B, Kammerer C, Reinhart L, Stern M. NIDDM in Mexican-American families. Heterogeneity by age of onset. Diabetes Care. 1994;17:567–73. doi: 10.2337/diacare.17.6.567. [DOI] [PubMed] [Google Scholar]
- Mitchell BD, Kammerer CM, Blangero J, Mahaney MC, Rainwater DL, Dyke B, Hixson JE, Henkel RD, Sharp RM, Comuzzie AG, VandeBerg JL, Stern MP, MacCluer JW. Genetic and environmental contributions to cardiovascular risk factors in Mexican Americans. The San Antonio Family Heart Study. Circulation. 1996;94:2159–70. doi: 10.1161/01.cir.94.9.2159. [DOI] [PubMed] [Google Scholar]
- Mohamed MR, McFadden G. NFkB inhibitors: strategies from poxviruses. Cell Cycle. 2009;8:3125–32. doi: 10.4161/cc.8.19.9683. [DOI] [PubMed] [Google Scholar]
- Partridge L, Alic N, Bjedov I, Piper MD. Ageing in Drosophila: the role of the insulin/Igf and TOR signalling network. Experimental gerontology. 2011;46:376–81. doi: 10.1016/j.exger.2010.09.003. [DOI] [PMC free article] [PubMed] [Google Scholar]
- Proud CG. mTOR Signalling in Health and Disease. Biochemical Society transactions. 2011;39:431–6. doi: 10.1042/BST0390431. [DOI] [PubMed] [Google Scholar]
- Revelle W. Procedures for Personality and Psychological Research. Northwestern University; Evanston, Illinois: 2011. [Google Scholar]
- Strimmer K. A unified approach to false discovery rate estimation. BMC bioinformatics. 2008;9:303. doi: 10.1186/1471-2105-9-303. [DOI] [PMC free article] [PubMed] [Google Scholar]
- Toda N. Age-related changes in endothelial function and blood flow regulation. Pharmacology & therapeutics. 2012;133:159–76. doi: 10.1016/j.pharmthera.2011.10.004. [DOI] [PubMed] [Google Scholar]
- Towler MC, Hardie DG. AMP-activated protein kinase in metabolic control and insulin signaling. Circulation research. 2007;100:328–41. doi: 10.1161/01.RES.0000256090.42690.05. [DOI] [PubMed] [Google Scholar]
- Wieser D, Papatheodorou I, Ziehm M, Thornton JM. Computational biology for ageing. Philosophical transactions of the Royal Society of London Series B, Biological sciences. 2011;366:51–63. doi: 10.1098/rstb.2010.0286. [DOI] [PMC free article] [PubMed] [Google Scholar]
- Zeller T, Wild P, Szymczak S, Rotival M, Schillert A, Castagne R, Maouche S, Germain M, Lackner K, Rossmann H, Eleftheriadis M, Sinning CR, Schnabel RB, Lubos E, Mennerich D, Rust W, Perret C, Proust C, Nicaud V, Loscalzo J, Hubner N, Tregouet D, Munzel T, Ziegler A, Tiret L, Blankenberg S, Cambien F. Genetics and beyond--the transcriptome of human monocytes and disease susceptibility. PLoS One. 2010;5:e10693. doi: 10.1371/journal.pone.0010693. [DOI] [PMC free article] [PubMed] [Google Scholar]
Associated Data
This section collects any data citations, data availability statements, or supplementary materials included in this article.