

Abstract
PURPOSE: To evaluate the Aegis software implementation for real-time calculation of functional tumor volume (FTV) in the neoadjuvant breast cancer treatment trial setting. METHODS: The validation data set consisted of 689 contrast-enhanced magnetic resonance imaging (MRI) examinations from the multicenter American College of Radiology Imaging Network 6657 study. Subjects had stage III tumors ≥3 cm in diameter and underwent MRI before, during, and after receiving anthracycline-cyclophosphamide chemotherapy. Studies were previously analyzed by the University of California San Francisco core laboratory using the three-timepoint signal enhancement ratio (SER) FTV algorithm; FTV measurement was subsequently implemented on the Hologic (formerly Sentinelle Medical Inc) Aegis platform. All cases were processed using predefined volumes of interest with no user interaction. Spearman rank correlation was evaluated for all study sites and visits. Cox proportional hazards analysis was used to compare predictive performance of the platforms for recurrence-free survival (RFS) time. RESULTS: Overall agreement between platforms was good; ρ varied from 0.96 to 0.98 for different study visits. Site-by-site analysis showed considerable variation, from ρ = 0.54 to near perfect agreement (ρ = 1.000) for several sites. Mean absolute difference between platforms ranged from 1.67 cm3 pretreatment to 0.2 cm3 posttreatment. The two platforms showed essentially identical performance for predicting RFS using pretreatment or posttreatment FTV. CONCLUSION: Implementation of the SER FTV algorithm on a commercial platform for real-time MRI volume assessments showed very good agreement with the reference core laboratory system, but variations by site and outlier analysis point out sensitivities to implementation-specific differences.
Introduction
Dynamic contrast-enhanced magnetic resonance imaging (DCE-MRI) is widely used to evaluate tumors in patients with locally advanced breast cancer who are undergoing neoadjuvant (preoperative) chemotherapy. Signal enhancement in T1-weighted DCE-MRI is typically assessed by using a semiquantitative method to estimate signal intensity changes or by using a pharmacokinetic model to quantify changes in tissue contrast agent concentration [1]. Pharmacokinetic models provide parameters that describe changes in perfusion and blood vessel permeability [2–5], but implementing them requires sacrificing imaging spatial resolution for high temporal resolution [6].
Because of the importance of tumor morphology for diagnosis in breast MRI, images with high spatial resolution and high signal-to-noise ratio are preferable to images with high temporal resolution but low spatial resolution and low signal-to-noise ratio. Previous studies have demonstrated the value of high spatial resolution three-dimensional (3D) DCE-MRI with relatively low temporal resolution (60–90 seconds per frame) [7,8] for assessing breast tumors. Moreover, methods based on sampling three time points (one precontrast and two postcontrast) with high spatial resolution 3D imaging and approximate isotropic pixel sizes of 1 x 1 x 1 mm covering the entire symptomatic breast are commonly used in clinical studies [8–10] to assess morphologic changes in breast lesions.
We previously published a three-timepoint acquisition strategy to calculate high spatial resolution maps of a semiquantitative parameter, the signal enhancement ratio (SER), for clinical studies of breast cancer [11]. SER is defined as (S1 - S0)/(S2 - S0), where S0, S1, and S2 represent the signal intensity of each voxel in the precontrast, first postcontrast (tp1), and second postcontrast (tp2) images, respectively. SER analysis gives rise to several metrics including the functional tumor volume (FTV), defined as the sum volume of all voxels meeting a minimum early percentage of enhancement [PE = 100 x (S1 - S0)/S0] threshold with SER in a designated range. The utility of such metrics has led to the use of SER volumetric analysis in multicenter clinical trials, including the American College of Radiology Imaging Network (ACRIN) 6657 trial (the largest multicenter trial completed to date using MRI to measure treatment response in primary breast cancers) and the imaging component of the Investigation of Serial studies to Predict Your Therapeutic Response with Imaging And moLecular analysis (I-SPY TRIAL). In ACRIN 6657, FTVs derived from SER analysis were shown to better predict pathologic complete response than clinical assessment [12].
To ensure consistency in methodology, SER volumetric analysis for all sites participating in ACRIN 6657 was performed at the Breast Imaging Research Program at the University of California San Francisco (UCSF; San Francisco, CA), which served as an imaging core laboratory for the trial. Although such an arrangement is feasible for smaller trials, it is unsustainable in larger trials or for widespread clinical use. Hence, in preparation for the I-SPY 2 TRIAL (an adaptively randomized phase II trial designed to identify novel agents for breast cancer), and under the framework of a National Institute of Health grant specifically geared toward promoting translation of in vivo imaging systems for cancer investigations (PAR-10-169; R01 CA132870), an academic-industrial partnership was established between the UCSF core laboratory and Sentinelle Medical Inc. The goal of the academic-industrial partnership grant was to implement the UCSF SER algorithm as a software module on the Sentinelle Aegis platform and to subsequently distribute Aegis systems to sites participating in the I-SPY 2 study for FTV measurement.
The purpose of the study presented here was two fold: 1) to evaluate the level of agreement between FTV measurements using UCSF core laboratory software and Aegis software, by site and by treatment time point, and 2) to investigate whether FTV derived from SER analysis using the Aegis platform performs comparably to the UCSF software for predicting 3-year recurrence-free survival (RFS). To accomplish these objectives, the Aegis platform was used to perform SER analysis of the ACRIN 6657 trial data set.
Materials and Methods
Data Acquisition
A detailed description of protocols in the ACRIN 6657 trial have been reported elsewhere [12]. A summary is presented here.
Subject recruitment. The ACRIN 6657 trial was conducted as the imaging arm of the larger I-SPY TRIAL, which also included a biomarker study, Cancer and Leukemia Group B (CALGB) 150007. Patients enrolling in CALGB 150007 with stage III tumors that measured at least 3 cm in diameter at clinical examination or imaging and who were receiving an anthracycline-cyclophosphamide regimen alone or followed by a taxane were eligible. Pregnant patients and those with ferromagnetic prostheses were excluded from the study. All participants were consented according to a process approved by the American College of Radiology Institutional Review Board and local-site institutional review boards. A total of 207 of 238 female subjects with analyzable DCE-MRI examinations and mean age at enrollment 47.9 years (range = 26–68 years) were included in this validation study.
Imaging procedures. MRI examinations were performed within 4 weeks before the start of anthracycline-cyclophosphamide chemotherapy (visit 1), at least 2 weeks after the first cycle and before the second cycle of anthracycline-cyclophosphamide chemotherapy (visit 2), between anthracycline-cyclophosphamide treatment and taxane therapy if taxane was administered (visit 3), and after the final chemotherapy treatment and before surgery (visit 4). MRI examinations were begun in June, 2002 and concluded in August, 2006, with studies submitted from nine imaging centers all located within the United States.
All MRI was performed on 1.5-Tesla scanners from GE Healthcare (Pewaukee, WI), Siemens Healthcare (Erlangen, Germany), and Philips Healthcare (Best, The Netherlands) using dedicated breast radiofrequency coils. Before the start of imaging, an IV catheter was inserted into each patient; patients were imaged in the prone position. The MRI protocol included a localization acquisition and a T2-weighted sequence, followed by a dynamic contrast-enhanced series. For the contrast-enhanced series, high spatial-resolution (in-plane spatial resolution, ≤1 mm) 3D fat-suppressed T1-weighted imaging of the symptomatic breast was performed using a gradient-echo sequence with a repetition time of 20 milliseconds or less, echo time of 4 to 5 milliseconds, flip angle of 45° or less, 16- to 18-cm field of view, minimum matrix of 256 x 192, and 64 sections with a thickness of 2.5 mm or less.
Imaging time for the T1-weighted sequence was required to be between 4.5 and 5 minutes per volume data set (phase), with one phase acquired before contrast injection and at least two phases acquired commencing immediately after injection. Pulse sequences for these acquisitions were required to have k-space ordering set to sample the most significant center of k-space region at the midpoint of the acquisition period, resulting in a temporal sampling point for the first contrast-enhanced phase between 2 minutes, 15 seconds and 2 minutes, 30 seconds. An interphase delay between the first and the second contrast-enhanced phase was allowed as needed to result in a temporal sampling point of the second contrast-enhanced phase between 7 minutes, 15 seconds and 7 minutes, 45 seconds.
Data Analysis
Volumetric analysis. Staff at the imaging core laboratory performed the quantitative analysis of all MR image data. Rectangular 3D volumes of interest (VOI) were defined manually on all DCE series to completely enclose the enhancing tumor, and early PE = [(S1 - S0)/S0] x 100% and SER = (S1 - S0)/(S2 - S0) were computed for all voxels, where S0, S1, and S2 represent the signal intensities on the precontrast, early postcontrast, and late postcontrast images, respectively. For this validation study, the lowest order volume FTV (SER > 0) was computed as the sum of voxels with positive SER meeting a specified threshold for early PE. Two additional filters—a minimum precontrast intensity filter and a requirement for a minimum number of connected high-PE voxels—were applied to eliminate background and fat regions and isolated high-PE voxels resulting from noise. The connected voxels filter was imposed in three dimensions, testing for a specified minimum number of high-PE voxels among the 26 nearest neighbor voxels surrounding each voxel. Nominal values of 70% for the early PE threshold, 60% of the VOI intensity maximum for the precontrast minimum-intensity level, and four neighboring high-PE voxels for the minimum connectivity kernel were chosen on the basis of earlier single-site data from UCSF. However, adjustments to these values were necessary to account for variability in MRI systems and imaging parameters. These adjustments were made on a site-specific basis, so all studies from a given site were processed with identical parameter values. For cases where significant nontumor enhancing regions (for example, large vessels) could not be excluded through careful selection of the rectangular VOI, one or more irregular “omit” regions were defined by the user to exclude these volumes from the analysis. Nonanalyzable cases included those in which SER analysis could not be performed due to an insufficient number of postcontrast phases, image misregistration, poor image quality, or major protocol violations. We expect that these rejection criteria are independent of a subject's SER FTV value, i.e., the reason that data are missing is not correlated with the unobserved data. The data in this case are considered “missing at random” [13], and therefore, there is no need for any explicit correction of the analysis due to the existence of missing data.
Analysis platforms. All cases were initially analyzed with a software package developed at UCSF for analysis of breast DCE-MRI studies, with final results submitted to ACRIN in 2008 after the close of the 6657 study. Beginning in 2007, UCSF teamed with Sentinelle Medical Inc (Toronto, Ontario; acquired by Hologic Inc, Bedford, MA, in 2010), manufacturer of the Aegis visualization system, to develop and provide an SER FTV analysis platform for use at imaging sites in the I-SPY 2 TRIAL. The algorithms developed at UCSF were adapted and ported to the Aegis software platform. All capabilities of the UCSF SER FTV analysis programs were replicated except for the “omit” functionality for excluding irregular regions from the VOI. In addition to real-time processing capability for analyzing ongoing studies, a batch-processing capability was implemented to process large numbers of cases with predefined VOI without operator interaction. Parameters for the different filtering steps in the SER FTV analysis (minimum early PE, minimum precontrast intensity, and minimum connected high-PE voxels) were set on a site-by-site basis to be identical with those used in the UCSF analysis. All analyzable cases from the ACRIN 6657 study were processed through the batch processor for this validation study.
Statistics. The relationship between FTVs computed with the imaging core laboratory's implementation and FTVs computed with the Aegis implementation was assessed using scatterplots and Spearman rank correlation coefficient (ρ). The differences between the FTVs from the two software platforms were evaluated using the mean difference (MD), given by the mean value of the magnitude of the difference between the two results. FTVs from across all sites were compared at each visit in a combined analysis (ignoring potential between-site variability). To evaluate between site variability, FTVs were also compared at each visit for each site separately. Two sites in the trial accrued a single patient, and another site had fewer than four patients at three of the four visits; data from these sites and visits were only included in the comparison of FTVs across sites because these data sets were too small to obtain meaningful correlation estimates.
Single-predictor Cox proportional hazards modeling was used to examine the relationship between FTV measurements and RFS. RFS was defined as the time (number of days) between first chemotherapy treatment and disease recurrence according to the standardized definitions for efficacy end points (STEEP) criteria [13]. The Cox model explicitly accounts for differential follow-up, so no cut points for defining recurrence were required for this analysis. FTVs at visit 1 (FTV1) and visit 4 (FTV4) were considered. All Cox proportional hazards results were reported as estimated hazard ratios with Wald 95% confidence intervals (CIs) and likelihood ratio test P values. All statistical analyses were performed using the R project for statistical computing (http://www.r-project.org; Vienna, Austria) and the survival library therein. A nominal statistical significance level of α = 0.05 was used throughout.
Results
Nine imaging centers contributed a total of 846 on-study MRI examinations. Of these, 689 examinations in 207 patients were acceptable for tumor volume quantification. Reasons for excluding examinations included patient ineligibility or withdrawal of consent, insufficient MRI image quality, and significant protocol violations. The most common image quality problems were insufficient or spatially varying fat suppression, poor SNR, and image misregistration due to motion. Protocol violations that prevented FTV analysis included failure to acquire at least two postcontrast DCE phases, use of a two-dimensional rather than 3D acquisition, and failure to keep all MRI acquisition parameters constant between precontrast and postcontrast acquisitions. The numerical distribution of exams submitted and accepted from the different study sites is shown in Table 1.
Table 1.
Total and Analyzable Examinations from Each Study Site.
| Site | 1 | 2 | 3 | 4 | 5 | 6 | 7 | 8 | 9 | All |
| n (total) | 135 | 13 | 116 | 67 | 22 | 182 | 49 | 7 | 255 | 846 |
| n (analyzable) | 108 | 1 | 76 | 42 | 11 | 155 | 48 | 1 | 248 | 690 |
Agreement between the software platforms was assessed independently at each study visit, as mean tumor volume decreased significantly with treatment. We observed high correlation between FTVs generated by the two platforms at all visits, as shown by the Spearman rank correlation analysis results summarized at the top of Table 2. The correlation ranged from the weakest at visit 2 (n = 175, ρ = 0.958, 95% CI = 0.944–0.969) to the highest at visit 3 (n = 166, ρ = 0.981, 95% CI = 0.974–0.986), with P < .0001 at all visits. MD values decreased steadily with successive visits: 1.67, 1.21, 0.27, and 0.20 cm3 for visits 1 to 4, respectively. The generally high agreement between software platforms is shown graphically through Bland-Altman plots for each visit in Figure 1, as well as the presence of some outliers at all visits.
Table 2.
Correlation of Software Platform Results by Visit for All Sites.
| Site | Parameter | Visit 1 | Visit 2 | Visit 3 | Visit 4 |
| All sites | n | 175 | 175 | 166 | 174 |
| ρ | 0.962 | 0.958 | 0.981 | 0.972 | |
| 95% CI | (0.949–0.971) | (0.944–0.969) | (0.974–0.986) | (0.962–0.979) | |
| MD (cm3) | 1.67 | 1.21 | 0.27 | 0.20 | |
| Excluding site 3 | n | 156 | 156 | 149 | 152 |
| ρ | 0.999 | 0.977 | 0.980 | 0.990 | |
| 95% CI | (0.998–0.999) | (0.968–0.983) | (0.972–0.985) | (0.986–0.992) | |
| MD (cm3) | 1.24 | 0.88 | 0.26 | 0.11 | |
| Site 1 | n | 27 | 28 | 26 | 27 |
| ρ | 0.998 | 0.995 | 1.000 | 1.000 | |
| 95% CI | (0.995–0.999) | (0.996–0.999) | (0.998–1.000) | (0.988–0.998) | |
| MD (cm3) | 0.59 | 0.52 | 0.34 | 0.05 | |
| Site 3 | n | 19 | 19 | 17 | 21 |
| ρ | 0.54 | 0.74 | 0.95 | 0.858 | |
| 95% CI | (0.113–0.798) | (0.43–0.894) | (0.863–0.982) | (0.677–0.941) | |
| MD (cm3) | 5.22 | 3.96 | 0.4 | 0.79 | |
| Site 4 | n | 10 | 12 | 10 | 10 |
| ρ | 1.000 | 0.979 | 0.964 | 1.000 | |
| 95% CI | (1.000–1.000) | (0.925–0.994) | (0.849–0.992) | (1.000–1.000) | |
| MD (cm3) | 0.48 | 0.73 | 1.38 | 0.04 | |
| Site 6 | n | 37 | 41 | 38 | 39 |
| ρ | 0.999 | 0.997 | 0.939 | 0.969 | |
| 95% CI | (0.998–1.000) | (0.995–0.999) | (0.884–0.968) | (0.941–0.984) | |
| MD (cm3) | 2.22 | 1.73 | 0.22 | 0.34 | |
| Site 7 | n | 13 | 11 | 12 | 12 |
| ρ | 1.000 | 1.000 | 0.999 | 1.000 | |
| 95% CI | (1.000–1.000) | (1.000–1.000) | (1.000–1.000) | (0.995–0.997) | |
| MD (cm3) | 1.39 | 0.27 | 0.16 | 0.04 | |
| Site 9 | n | 63 | 61 | 61 | 63 |
| ρ | 1.000 | 1.000 | 1.000 | 1.000 | |
| 95% CI | (1.000–1.000) | (0.999–1.000) | (0.988–0.996) | (0.985–0.994) | |
| MD (cm3) | 0.35 | 0.08 | 0.06 | 0.03 |
P < .0001 in all cases except for site 3, visit 1 (P < .017) and site 3, visit 2 (P < .0003).
MD, mean difference, the mean value of the magnitude difference between the FTV calculated with the core laboratory and Aegis software platforms.
Figure 1.
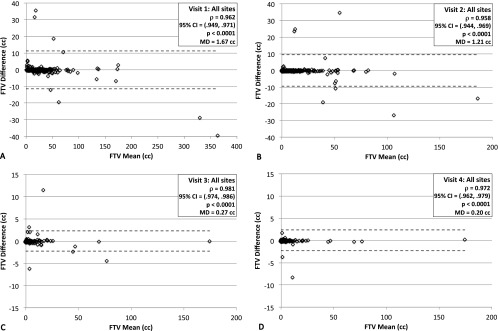
Bland-Altman plots of the difference between core laboratory FTV and Aegis platform FTV (FTVCore - FTVAegis) versus the mean of the two measures for all sites for study visit 1 (A) through visit 4 (D). Inset legends give the results from the Spearman rank correlation analysis for the shown studies.
FTVs from the two software platforms broken down by both site and visit were examined to investigate site-to-site differences and possible outlier effects. The three sites with very low numbers of analyzable cases (Table 1; sites 2, 5, and 8) were excluded from this analysis. Results for Spearman rank correlation and MD are shown in Table 2, and representative scatterplots for the first and fourth visits are shown in Figure 2 for the sites with the weakest (site 3) and highest (site 9) correlations. Due to therapeutic effects, many patients have significant volume reduction over the course of treatment, resulting in FTV values at or near 0 cm3 by visit 4, as shown in the insets in Figure 2, B and D. Estimates of correlation coefficients across sites and visits ranged from alow of ρ = 0.54 (n = 19, 95% CI = 0.113–0.798; P < .017) for site 3 at visit 1 up to ρ = 1.000 (95% CI = 1.000-1.000; P <.0001) for five different site + visit combinations. Estimates of the correlation coefficient at the other four sites with sufficient analyzable data (sites 1, 4, 6, and 7) were greater than 0.93 (P < .0001) for all visits, as shown in Table 2. Values of the MD are shown graphically for all sites and visits in Figure 3. They ranged from a maximum of 5.22 cm3 (site 3, visit 1) to 0.03 cm3 (site 9, visit 4). We repeated the correlation analysis for all sites combined excluding all examinations from site 3, with resulting increases in ρ and reduction in MD values as shown in Table 2. Examination of the plots in Figures 1 and 2 reveals that the errors are not normally distributed, a majority of the points lying almost perfectly on the identity line with only a small subset showing differences of a significant magnitude. Possible explanations for the anomalously poor correlations for site 3 and for the large differences in FTVs from some individual MRI exams are given in Discussion section.
Figure 2.

Scatterplots of core laboratory FTV (vertical axis) versus Aegis platform FTV (horizontal axis) for site 3 [poorest correlations, visit 1 (A) and visit 4 (B)] and site 9 [best correlations, visit 1 (C) and visit 4 (D)]. The diagonal line represents the identity relationship. Expanded scales are shown as insets to illustrate correlations at the small volume ranges typical for visit 4.
Figure 3.

MD between the core laboratory FTV and Aegis FTV for each visit at each site. Sites 2, 5, and 8 did not have enough analyzable cases for meaningful statistical analysis. MD, mean value of the magnitude of the difference between the two FTV measures.
The capability of the core laboratory software platform to exclude irregularly shaped “omit” regions of interest (ROIs) from the analysis was not supported by the Aegis implementation. Omit regions were defined in 107 of the 689 analyzed exams, resulting in an over-estimation of FTV by the Aegis platform in these cases relative to the core laboratory values. The excluded enhancing volumes were generally small, and eliminating these 107 exams from the correlation analysis for all sites combined resulted in no systematic changes in the estimated correlation coefficients or MD results for each visit. However, when the analysis was broken down by site, some changes were observed in the deviation of the slope of the regression line from an ideal value of 1. For site 6, the most extreme example, there was an average 9% overestimation of FTV by Aegis software relative to the core laboratory software, which was reduced to <1% when the cases with omit regions were excluded. Omit regions were also responsible for some significant outliers; for example, two visit four cases in which Aegis software reported FTV values of 7.8 and 9.2 cm3 versus values of 4.1 and 0.9 cm3 as reported by the core laboratory software.
Survival analysis using the Cox proportional hazards model was calculated for FTV values from each software platform for all sites for the baseline (FTV1) and presurgery (FTV4) visits. Per unit increase (1 cm3) in FTV1, the Aegis platform gave an estimated hazard ratio of 1.010 (Wald 95% CI = 1.004–1.017; likelihood ratio P < .002). The core laboratory platform gave a similar estimated hazard ratio of 1.011 (95% CI = 1.004–1.018; P < .001) for this visit. The estimated hazard ratio and CI per unit increase in FTV4 was identical (to three decimal places of hazard ratio) for both platforms: 1.043 (95% CI = 1.023–1.064; P < .0001).
Discussion
We compared FTV measured with an implementation of SER volumetric analysis on Hologic's Aegis platform to FTV measured by the UCSF imaging core laboratory in the ACRIN 6657 trial. We found very good overall concordance between the two platforms with ρ ≥ 0.95 for all visits. However, analysis of individual sites showed marked differences, and there were some outliers that bear explanation.
Site 3 exhibited poorer correlations than all the other sites. Examination of individual cases from this site indicated the following two primary problems: cases with Digital Imaging and Communications in Medicine (DICOM) file issues such as lack of scan timing information, which interfered with the Aegis software's ability to properly calculate the FTV, resulting in 0 cm3 or significantly underestimated volumes; and cases with poor image quality, typically due to poor fat saturation. These problems point to the importance of good adherence to both DICOM file transfer standards and study protocols, especially for multicenter studies.
Several known implementation differences between the two software platforms account for some of the differences observed in individual cases. These differences, discussed in detail below, include factors related to image orientation, PE value representation, ability to omit regions within a VOI, VOI coordinate storage format, and signal intensity thresholds used for analysis.
One limitation of the core laboratory platform implementation was a requirement of sagittal image orientation; and although this orientation was specified in the ACRIN 6657 study protocol, some examinations were submitted with DCE images acquired in the axial orientation. These images were processed as submitted by the Aegis software but were interpolated to isotropic voxels and reformatted to the sagittal orientation for processing by the core laboratory. However, of the 20 axial exams submitted for six subjects, only 3 exams from a single subject proved analyzable. This subject was from site 7, which had excellent correlation (ρ ≥ 0.999 at all visits), so these extra image-processing steps did not appear to significantly affect the correlation results. However, the exam from visit 1 for this subject was an outlier with a difference in FTV of 5.6 cm3 between platforms, and excluding this subject reduced the site 7, visit 1 MD from 1.39 to 1.04 cm3.
Another possible source of variation results from how the two platforms maintain PE values; the core laboratory uses a 32-bit floating-point number, whereas Aegis uses a 4-bit channel, binning the PE into 10% levels from 10% to 160%. Because the PE thresholds used for all sites were multiples of 10%, this is expected to have only small effects on individual FTV measurements due to possible rounding errors of voxels with PE values close to the selected threshold, but it may have affected the correlation results.
A capability of the core laboratory platform that was not possible to duplicate on the Aegis platform at the time of this study was an ROI “omit” function, whereby the user could trace an irregularly shaped ROI on a maximum-intensity projection image showing non-tumor enhancing regions and have that region excluded from the volume calculation. This feature was used to exclude regions such as the heart or large vessels that could not be excluded from the rectangular VOI without also excluding tumor regions. Broken down by site, the results indicate that this difference gave rise to an overall overestimation of FTV relative to the core laboratory values, by up to 9% for site 6, and significant errors on some individual cases. Following this study, an “omit region” feature was added to a later version of the Aegis platform SER FTV software for use in the I-SPY 2 study.
A final potential contributor of outliers involves the translation of the manually defined VOI from the core laboratory system to the Aegis platform. The VOI were stored on the core laboratory system as pixel coordinates of the rectangular region but, for platform architecture reasons, needed to be translated to DICOM standard patient coordinate system values for processing on the Aegis platform. These patient coordinates were subsequently reconverted into pixel ranges for the Aegis SER FTV analysis. This double conversion may have introduced errors in replicating the exact VOI at the pixel level. The direct effect of inclusion or exclusion of tumor regions on one platform but not the other is expected to be minimal because the VOI were defined to completely include enhancing regions with some margin. However, a secondary effect arises because the histogram of precontrast image intensity is used to calculate the minimum intensity threshold, which has been observed to have significant impact on the FTV, especially in cases of poor image quality or poor fat suppression. We note that whatever the extent of this problem turns out to be, it will be less of a factor in future studies such as I-SPY 2, as the VOI will be defined directly on the Aegis system by the operator. We are also investigating using different values for the intensity threshold and different segmentation methods in an attempt to reduce the dependence of the FTV analysis on the VOI definition.
The final check for validation was to measure the prediction of RFS time using FTV from each platform. We found no effective difference between the predictive models of FTVs from Hologic's Aegis platform relative to the UCSF core laboratory's platform; the hazard ratio per unit increase in the final, presurgery FTV was identical for both platforms at 1.043 (95% CI = 1.023–1.064; P <.0001).
The multiple potential error sources described above illustrate the importance of attention to implementation details when porting quantitative image analysis algorithms between platforms. This is of particular concern when they are intended for use in multisite studies with the possibility of significant variability in image acquisition protocol compliance and image quality. Nonetheless, the high correlations and similar results from the survival analyses illustrate the robustness of MRI volume measures for prediction of response in the breast cancer neoadjuvant treatment regimen.
References
- 1.Collins GL, Wallis-Crespo MC, Gilbert-Barness E. Pathology teach and tell: Castleman disease. Fetal Pediatr Pathol. 2004;23:65–69. doi: 10.1080/15227950490423089. [DOI] [PubMed] [Google Scholar]
- 2.den Boer JA, Hoenderop RKKM, Smink J, Dornseiffen G, Koch PWAA, Mulder JH, Slump CH, Volker EDP, De Vos RAI. Pharmacokinetic analysis of Gd-DTPA enhancement in dynamic three-dimensional MRI of breast lesions. J Magn Reson Imaging. 1997;7:702–715. doi: 10.1002/jmri.1880070416. [DOI] [PubMed] [Google Scholar]
- 3.Knopp MV, Brix G, Junkermann HJ, Sinn HP. MR mammography with pharmacokinetic mapping for monitoring of breast cancer treatment during neoadjuvant therapy. Magn Reson Imaging Clin N Am. 1994;2:633–658. [PubMed] [Google Scholar]
- 4.Mussurakis S, Buckley DL, Drew PJ, Fox JN, Carleton PJ, Turnbull LW, Horsman A. Dynamic MR imaging of the breast combined with analysis of contrast agent kinetics in the differentiation of primary breast tumours. Clin Radiol. 1997;52:516–526. doi: 10.1016/s0009-9260(97)80328-5. [DOI] [PubMed] [Google Scholar]
- 5.Tofts PS, Berkowitz B, Schnall MD. Quantitative analysis of dynamic Gd-DTPA enhancement in breast tumors using a permeability model. Magn Reson Med. 2005;33:564–568. doi: 10.1002/mrm.1910330416. [DOI] [PubMed] [Google Scholar]
- 6.Li K-L, Henry RG, Wilmes LJ, Gibbs J, Zhu X, Lu Y, Hylton NM. Kinetic assessment of breast tumors using high spatial resolution signal enhancement ratio (SER) imaging. Magn Reson Med. 2007;58:572–581. doi: 10.1002/mrm.21361. [DOI] [PMC free article] [PubMed] [Google Scholar]
- 7.Kuhl CK, Mielcareck P, Klaschik S, Leutner C, Wardelmann E, Gieseke J, Schild HH. Dynamic breast MR imaging: are signal intensity time course data useful for differential diagnosis of enhancing lesions? Radiology. 1999;211:101–110. doi: 10.1148/radiology.211.1.r99ap38101. [DOI] [PubMed] [Google Scholar]
- 8.Esserman L, Hylton N, George T, Weidner N. Contrast-enhanced magnetic resonance imaging to assess tumor histopathology and angiogenesis in breast carcinoma. Breast J. 1999;5:13–21. doi: 10.1046/j.1524-4741.1999.005001013.x. [DOI] [PubMed] [Google Scholar]
- 9.Boné B, Szabó BK, Perbeck LG, Veress B, Aspelin P. Can contrast-enhanced MR imaging predict survival in breast cancer? Acta Radiol. 2003;44:373–378. doi: 10.1080/j.1600-0455.2003.00080.x. [DOI] [PubMed] [Google Scholar]
- 10.Degani H, Gusis V, Weinstein D, Fields S, Strano S. Mapping pathophysiological features of breast tumors by MRI at high spatial resolution. Nat Med. 1997;3:780–782. doi: 10.1038/nm0797-780. [DOI] [PubMed] [Google Scholar]
- 11.Hylton NM. Vascularity assessment of breast lesions with gadolinium-enhanced MR imaging. Magn Reson Imaging Clin N Am. 1999;7:411–420. x. [PubMed] [Google Scholar]
- 12.Hylton NM, Blume JD, Bernreuter WK, Pisano ED, Rosen MA, Morris EA, Weatherall PT, Lehman CD, Newstead GM, Polin S. Locally advanced breast cancer: MR imaging for prediction of response to neoadjuvant chemotherapy—results from ACRIN 6657/I-SPY TRIAL. Radiology. 2012;263:663–672. doi: 10.1148/radiol.12110748. [DOI] [PMC free article] [PubMed] [Google Scholar]
- 13.Hudis CA, Barlow WE, Costantino JP, Gray RJ, Pritchard KI, Chapman J-AW, Sparano JA, Hunsberger S, Enos RA, Gelber RD, et al. Proposal for standardized definitions for efficacy end points in adjuvant breast cancer trials: the STEEP system. J Clin Oncol. 2007;25:2127–2132. doi: 10.1200/JCO.2006.10.3523. [DOI] [PubMed] [Google Scholar]