INTRODUCTION
The Caenorhabditis elegans embryo is particularly amenable to microscopy and embryological studies because of its short developmental time, transparent shell, and nonpigmented cells. Identification of cell contacts is important for understanding how cells within the embryo can be polarized by their neighbors. This protocol describes a technique for identifying cell membranes and potential contacts between different blastomeres in the embryo and for following those contacts through development. This protocol involves manual segmentation of the membrane of each blastomere from four-dimensional (4D) differential interference contrast (DIC) data sets. Although this technique is described for use with C. elegans embryos, it will work with any 4D DIC data set. The recent development of a pleckstrin homology (PH)-domain tagged::GFP expressed in C. elegans embryos simplifies this analysis; however, many organisms lack appropriate green fluorescent protein (GFP) transgenes. The use of the GFP transgene improves on laser-mediated techniques for labeling embryonic cell membranes with fluorescent dye. Such methods require that a laser be used to carefully permeabilize the eggshell for entry of the dye into the embryo. The technique described in this protocol requires only easily obtainable 4D DIC data sets.
RELATED INFORMATION
A description of a pleckstrin homology (PH)-domain tagged::GFP expressed in C. elegans embryos is found in Audhya et al. (2005). A protocol for collection of 4D data can be found in Acquisition of 4D DIC Microscopic Data to Determine Cell Contacts in Caenorhabditis elegans Embryos (Walston and Hardin 2010a). Several examples of the 4D data analysis technique are shown in the following movies, used to study the effects of contact between the ABar and C blastomeres: Movie 1 is the result of image analysis to determine the contact between the cells. The effects of this contact were abrogated through pal-1 RNA interference, which alters the fate of the C blastomere (Movie 2). For Movie 3, the ABp blastomere was subjected to laser killing, creating steric hindrance between C and ABar (see Laser Killing of Blastomeres in Caenorhabditis elegans [Walston and Hardin 2010b]).
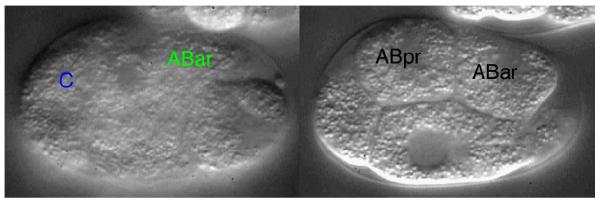
MOVIE 1.

Contact between the C blastomere and the ABar blastomere directs the spindle orientation of ABar division in a wild-type C. elegans embryo. (Left) Contact between the C blastomere (membrane near contact outlined in blue) and the ABar blastomere (membrane near contact outlined in green). The focal depth (18 μm) of greatest contact is shown. (Right) Shortly after contact between the C and the ABar blastomeres, the mitotic spindle of the ABar blastomere (right line) is shifted toward the contact, resulting in a cell division that is perpendicular to the orientation of division of the neighboring ABpr blastomere (left line). The focal depth is 7.5 μm. (To view movie, see doi: 10.1101/pdb.prot5542 online at www.cshprotocols.org.)
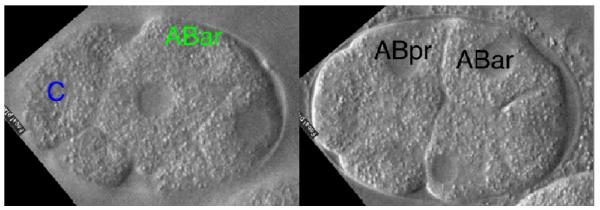
MOVIE 2.

Disruption of the fate of the C blastomere using pal-1(RNAi) knockdown results in delayed and minimal con- tact between the C and the ABar blastomeres before division of ABar, causing the ABar spindle to be misaligned. (Left) Contact is minimal and is delayed between the C blastomere (membrane near contact outlined in blue) and the ABar blastomere (membrane near contact outlined in green). The focal depth (14 μm) of greatest contact is shown. (Right) In lieu of a polarizing signal from the C blastomere, the ABar blastomere (right line) adopts the default spindle orien- tation and divides parallel with the ABpr blastomere (left line). The focal depth is 7 μm. (To view movie, see doi: 10.1101/pdb.prot5542 online at www.cshprotocols.org.)
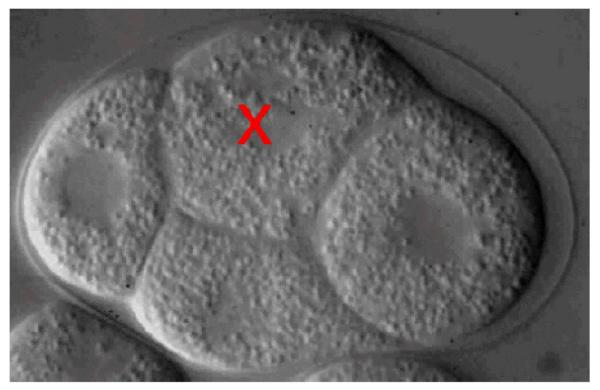
MOVIE 3.

Laser killing of ABp creates a barrier between contact with the C and the ABar blastomeres in C. elegans embryos. The ABp blastomere (labeled with a red x) was laser-killed at the four-cell stage of embryogenesis, just before the start of the movie. The corpse of ABp prevents contact between the C blastomere (membrane near closest contact outlined in blue) and the ABar blastomere (membrane near closest contact outlined in green). The focal depth (10.5 μm) of closest proximity between the two blastomeres is shown. As a result, the ABar blastomere aligns its spindle in the default orientation (line) and divides parallel with the other AB granddaughter cells (not shown). (To view movie, see doi: 10.1101/pdb.prot5542 online at www.cshprotocols.org.)
MATERIALS
CAUTIONS AND RECIPES
Please see Appendices for appropriate handling of materials marked with <!>, and recipes for reagents marked with <R>.
Equipment
Computer Data set (4D DIC; see Acquisition of 4D DIC Microscopic Data to Determine Cell Contacts in Caenorhabditis elegans Embryos [Walston and Hardin 2010a])
This protocol specifically addresses the use of DIC images but can also be extended to confocal images of transgenic embryos.
Software, drawing or photograph editing (e.g., Adobe Photoshop and Photoshop Elements; ImageJ, http://worms.zoology.wisc.edu/research/4d/4d.html; GIMP, http://www.gimp.org) Software, image analysis (e.g., ImageJ, http://worms.zoology.wisc.edu/research/4d/4d.html; BD Biosciences IPLab)
The image analysis program must have the ability to handle and to easily navigate 4D data sets.
Tracing tool
A mouse can be used for this; however, we have had significantly more success using a pen and tablet (such as a Wacom tablet) or the trackpad on a laptop computer.
METHOD
The total time needed is 15-20 min per time point.
Open the 4D data set in the image analysis program.
-
Navigate through time points to the time of interest, and identify the cells of interest.
To analyze cell contacts, start the segmentation method at least two to three time points before contact or suspected contact.
-
Scroll through the focal planes to identify the focal plane with the closest contact or the clearest contact between the cells.
See Troubleshooting.
Export all images from that focal plane either to individual frames or to a stack of images.
Open the exported images in one of the photograph editing programs.
-
Starting with the first image, select the freehand drawing tool in the software, and use the trackpad or the mouse to trace around the membrane of one of the cells in the embryo.
The first image analyzed may not be the first time point. In some cases, it might be easier to trace the best contact time point first and to work in either direction in time after that. See Troubleshooting.
Select a different color, and repeat Step 6 for the other cell being studied for contact. Maintain the color scheme throughout the analysis.
Repeat Steps 6 and 7 for each time point in the analysis. See Troubleshooting.
TROUBLESHOOTING
Problem It is difficult to determine where the cell membranes are for each cell. [Steps 3, 6]
Solution: Consider the following:
Compare the single frame and the 4D data set simultaneously. Membranes that are hard to pick out in the individual frame often are much more obvious in that frame when it can be visualized within the context of the 4D data sets. Examining neighboring images (either adjacent time steps or adjacent focal steps) can often clarify the membrane boundaries in the individual frame.
Using a fluorescent membrane marker, such as a PH domain::GFP transgene, highlights membrane boundaries and simplifies analysis of cell contacts.
Problem: This process takes a lot of time; is there a quicker way to do this? [Step 8]
Solution: Several C. elegans laboratories, including our laboratories, are working on automated or semi-automated segmentation techniques for identifying cell boundaries in images. Until the quality of these techniques can be tested and can be shown to be accurate, hand segmentation of the images is the most accurate way, although it is time-consuming. Membrane-based GFP markers also sim- plify this process and reduce the time for image analysis.
REFERENCES
- Audhya A, Hyndman F, McLeod IX, Maddox AS, Yates JR, III, Desai A, Oegema K. A complex containing the Sm protein CAR-1 and the RNA helicase CGH-1 is required for embryonic cytokine- sis in Caenorhabditis elegans. J Cell Biol. 2005;171:267–279. doi: 10.1083/jcb.200506124. [DOI] [PMC free article] [PubMed] [Google Scholar]
- Walston T, Hardin J. Acquisition of 4D DIC microscopic data to determine cell contacts in Caenorhabditis elegans embryos. Cold Spring Harb Protoc. 2010a doi: 10.1101/pdb.prot5541. doi: 10:1101/pdb.prot5541. [DOI] [PMC free article] [PubMed] [Google Scholar]
- Walston T, Hardin J. Laser killing of blastomeres in Caenorhabditis elegans. Cold Spring Harb Protoc. 2010b doi: 10.1101/pdb.prot5543. doi: 10:1101/pdb.prot 5543. [DOI] [PMC free article] [PubMed] [Google Scholar]


