Abstract
The velocity and curvature of a wave front are important factors governing the propagation of electrical activity through cardiac tissue, particularly during heart arrhythmias of clinical importance such as fibrillation. Presently, no simple computational model exists to determine these values simultaneously. The proposed model uses the arrival times at four or five sites to determine the wave front speed (v), direction (θ), and radius of curvature (ROC) (r0). If the arrival times are measured, then v, θ, and r0 can be found from differences in arrival times and the distance between these sites. During isotropic conduction, we found good correlation between measured values of the ROC r0 and the distance from the unipolar stimulus (r = 0.9043 and p < 0.0001). The conduction velocity (m/s) was correlated (r = 0.998, p < 0.0001) using our method (mean = 0.2403, SD = 0.0533) and an empirical method (mean = 0.2352, SD = 0.0560). The model was applied to a condition of anisotropy and a complex case of reentry with a high voltage extra stimulus. Again, results show good correlation between our simplified approach and established methods for multiple wavefront morphologies. In conclusion, insignificant measurement errors were observed between this simplified approach and an approach that was more computationally demanding. Accuracy was maintained when the requirement that ε (ε = b/r0, ratio of recording site spacing over wave fronts ROC) was between 0.001 and 0.5. The present simplified model can be applied to a variety of clinical conditions to predict behavior of planar, elliptical, and reentrant wave fronts. It may be used to study the genesis and propagation of rotors in human arrhythmias and could lead to rotor mapping using low density endocardial recording electrodes.
Keywords: Cardiac muscle, Propagation velocity, Wave front curvature, Electrode, Anisotropy
INTRODUCTION
Impulse propagation in cardiac muscle is determined by three factors11: (1) the active properties of cardiac cell membranes, (2) the passive electrical characteristics of the network formed by the cardiac cells, and (3) the geometry of excitation wave fronts. Extensive research during the last two decades by means of mathematical modeling and in experiments has shown the importance of wave dynamics in the study of cardiac impulse propagation. Initially the myocardium was considered to behave as a continuum,25,31 although later some have suggested that it is discontinuous because of the discrete nature of the cardiac cells34 resulting in an anisotropic distribution of the intercellular connections.35 Either view may apply depending on the type of arrhythmia under consideration (for example, polymorphic ventricular tachycardia seen in the long-QT syndrome is still explained by the continuous medium properties9). Cardiac electrical events have been described by reentrant path17,27 or vortex of reentrant wave fronts1 and reentrant wave dynamics are described by wave front curvature, rotors, spiral waves, and scroll waves.5,6,11,13,14
Cardiac arrhythmias are often studied by measuring and analyzing wave fronts of electrical activity in the heart. Conduction velocity is an important parameter characterizing cardiac activation, and while it is difficult to measure clinically during an arrhythmia such as fibrillation, methods exist for estimating velocity from wave front recordings.2,19 In computer simulations, conduction velocity measurements may provide crucial information about the wave front profile and arrhythmia sources, and could be a good support to clinical analysis. Wave front curvature is also an important property that influences propagation.11,37 Mapping cardiac activation using single or multiple recording electrodes has been used extensively and proven to be the method of choice for clinical measurements, experimental testing or in simulations. Four electrodes were used to determine the propagation direction of a cardiac impulse independent of activation time information by finding the vector sum of activity recorded from orthogonal paced bipolar electrodes.18 Another method based on three electrodes and a mathematical formalism was used to measure simultaneously the index of recovery of tissue excitability, action potential, conduction velocity, and direction of activation.15 Neither electrode designs cited above provide information on the curvature of wave fronts, an important factor in wave propagation. The critical curvature value often leads to wave detachments from obstacles, such as a scar or a conduction block, resulting in the formation of vortices and turbulent cardiac electrical activity.26
Researchers often lack a straightforward way to measure wave front speed, direction, and curvature simultaneously. We propose a simple and attractive method of measuring conduction velocity by determining the arrival times at four sites surrounding the point of interest (POI). From these arrival times, we can apply a Taylor expansion and solve for the conduction velocity and wave front curvature at the center point or POI. We test the method using simulations based on a 2D bidomain model of the tissue36 and the Beeler–Reuter model of the membrane kinetics.3 The method may be simpler and easier to use than techniques such as fitting polynomial surfaces to the space–time coordinates of activity as described by Bayly et al.2 or generating smooth, continuous parameterizations of wave shapes using cubic smoothing splines fitted to isopotentials as described by Kay and Gray.19 Although the clinical implications of this method are yet to be determined, we propose this as an excellent technique for measuring conduction velocities in a computer simulation or in animal experiments.
METHODS
Activation Mapping
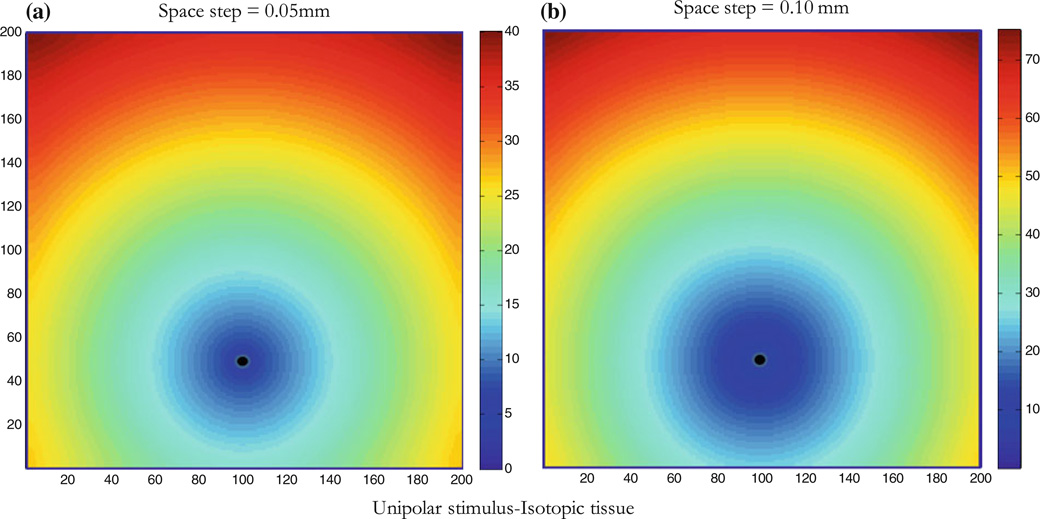
We used the Beeler–Reuter3 model of the kinetics and the bidomain36 model of the cardiac tissue to generate potential mapping corresponding to different cases. The isotropic case with a single unipolar stimulus (Fig. 1a) provides a good example to test the model, because the radius of curvature (ROC) is simply the distance from the stimulus as the wave front travels radially outward. In our simulation, activation times were determined whenever a threshold of −30 mV was reached, and we used a counter in the code to distinguish between different passes as the wave traveled past a point. Activation times were then stored in a data file for each location producing the activation map. The Beeler–Reuter model is simple and sufficient in generating an activation potential for isotropic, anisotropic and reentry cases, and was therefore selected over other new and complex models of the kinetics. We performed computer simulations using the bidomain representation of the cardiac tissue and the Beeler–Reuter model of the currents with accelerated calcium channel kinetics for the active membrane as previously described.23 A 2-D sheet of cardiac tissue of dimensions 10 ϗ 10 mm2 was represented by 200 ϗ 200 nodes with a space step of 0.05 mm. A stimulus was applied for 5 ms by raising the extracellular potential above threshold at some point in the cardiac tissue (stimulus site), giving rise to a propagating wave front. The time step was 0.005 ms for a total run of 200 ms. In our simulations, we used, b, the shortest distance, between sites where activation time is recorded, to be one space step or 0.05 mm. We repeated the simulation for different values of b (0.1, 0.2, 0.5, 1, 2, and 5 mm). We used a variety of fiber geometries to simulate complex wavefronts, which we then studied using our measurement approach. Figure 1b shows activation mapping for a space step of 0.1 mm, notice that activation times in the colorbar are different than Fig. 1a, the wave front reaches the nodes in a longer time because of the larger space step.
Figure 1.
Isotropic tissue with unipolar stimulus. The wave front is shown at different times; colorbar shows activation times at which the wave front reaches a node on the Cartesian grid (200 × 200 nodes). Arrival time contours are in ms and the stimulus (black dot) is located at node 100 × 50 (horizontal and vertical respectively). The conduction velocity is radial outward from the stimulus site as expected in the isotropic tissue. (a) Space step is 0.05 mm (tissue size is 10 × 10 mm2) and (b) space step is 0.10 mm (tissue size is 20 × 20 mm2).
Model for Simulation Testing
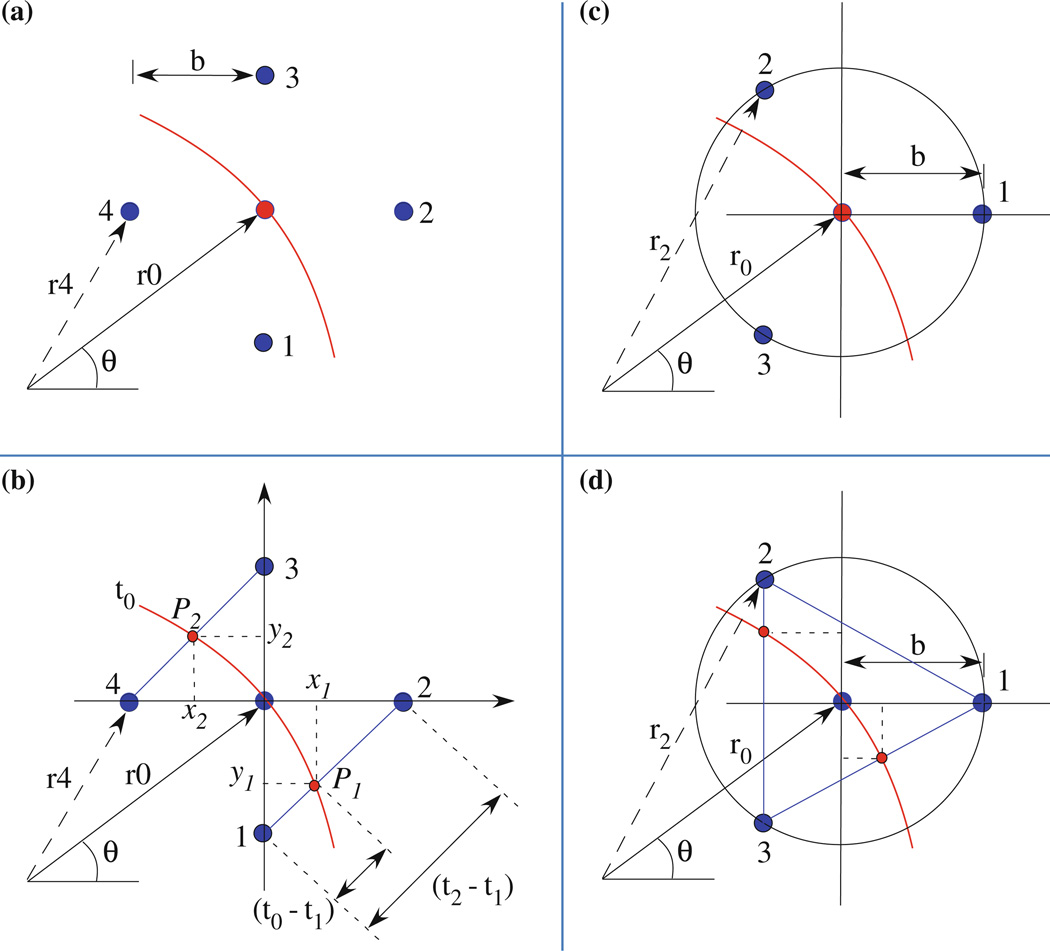
The rationale for using a square grid is that node arrays are usually square in simulations and pixels in a CCD camera for optical mapping are usually arranged in a square grid. Each grid node was used from the membrane potential (Vm) dataset; initially the algorithm was executed within the code performing the simulation and later mapping data of the whole grid was used to find points of interest. The following basic assumptions for our computational approach were made: (1) propagation direction is always normal at each site along the wavefront; (2) propagation is always smooth and continuous between recordings sites (which is assured by the cardiac model we are using); and (3) the ROC is large enough that locally we can approximate the wavefront as a circle. To compute the conduction velocity v, our method (4E) consisted of selecting a point (x, y) and measuring the arrival times corresponding to the times that the wave front passed through four neighboring points each a distance b from the central point, as shown in Fig. 2a. Our goal was to obtain the magnitude and direction of the velocity v, and the ROC r0 of the wave front. Assume that the wave front is circular, which should be a valid approximation locally (b ≪ r0). The corresponding radii of the neighbors (points 1–4 in Fig. 2a) are given from the law of cosines
| (1) |
| (2) |
| (3) |
| (4) |
where θ indicates the direction of the wave front. We next perform Taylor expansions in ε = b/r0 to find analytical expressions for speed, direction, and ROC, which works only if the radius is large compared to b, and obtain to second order
| (5) |
| (6) |
| (7) |
| (8) |
Figure 2.
Schematic diagrams of the wave front in different electrode arrangements. (a) 4-Electrodes geometry, (b) 5-electrodes geometry and 2 points (P1 and P2) on the line segments 1–2 and 4–3, (c) 3-electrodes geometry, and (d) 4-electrodes geometry and two extra points on segments 3–1 and 2–3. Arrangements in (b) and (d) are used to measure the ROC in a simulation and in clinical setting respectively (electrodes are colored blue).
The arrival time of the wave front at any of the four recording sites is denoted tn = rn/v, where n = 1, 2, 3, or 4. Let Δtij = ti − tj be the difference of arrival times between the ith and jth recording site. One can then show that
| (9) |
| (10) |
and
| (11) |
Equation (11) indicates that the ROC is indeterminate (0/0) when the direction of the wave front is at an angle of 45°. This represents a significant limitation when trying to determine the curvature of a complex wave front. However, this limitation can be overcome by using a second set of four recording sites rotated 45° relative to the first, which works simply in computer simulations using finite differences and a rectangular grid (the rotated points have a spacing that is larger by the square root of two, but that was accounted for in the calculations by increasing the value of b). Instead another method was chosen to overcome this limitation, the line segment (LS) method. Consider a fifth measurement at the POI in the center of the diamond shaped configuration as shown in Fig. 2b. The wave front would have at time t0 two corresponding points on the LS (1–2 and 3–4 in Fig. 2b), on two sides of the diamond shape. At t0, three points would approximate an arc of a circle; the ROC could be determined using the coordinates of the two points in a Cartesian coordinate system with the origin at the POI (Fig. 2b). The wave front traveled each segment of size b√2 in times (t2 − t1) and (t3 − t4) in this case. The coordinates of the points P1 and P2 on the segments (Eq. 12) were determined in terms of arrival times. The slopes of the lines joining each point to the origin are given by Eq. (13).
| (12) |
| (13) |
The coordinates of the center of the circle through three points including the origin are given by:
| (14) |
| (15) |
The ROC is again derived using only activation times at the electrodes. This method resolves the limitation of our 4E method in the 45° case as we show in the next sections.
Model for Clinical Testing
Measurements in a clinical setting may not be conducted using a square grid. Often three- and four-electrode non-rectangular arrangements are used. Models that represent clinical measurements would use either three or four electrodes, depending on the measurements. For example, three electrodes would provide for conduction velocity measurements while four electrodes would provide for both curvature and velocity measurements. With a circular probe containing three electrodes (Fig. 2c), and distance b from the center of the circle, the following equations were derived using similar approach as for Eqs. (1)–(11):
| (16) |
and
| (17) |
If a 4th electrode at the center is assumed (Fig. 2d), the ROC may be obtained using the approximation that b ≪ r0,
| (18) |
It is also possible to measure the ROC based on three points and approximate locally the wave to an arc of a circle (Fig. 2d) as described in Eqs. (12)–(15). Correlation between the two approaches served to determine the sensitivity of the method.
Comparative Analysis
Radius of Curvature
In the isotropic case, the ROC is known as the distance between the recording site or POI and the stimulus site where the wave front originated. Both 4E and LS methods were compared to the known value of the ROC using the distance formula (DF) in the Cartesian grid. The isotropic model of unipolar stimulus serves as a testing model for the methods later used in different anisotropic cases.
Conduction Velocity
Unfortunately there is no simple way to compare results even in the isotropic case. The velocity vectors are expected to be radial and divergent from the stimulus and our method uses time differences between recordings at different sites. To compare the proposed method, we derived an empirical technique based on distances the wave travels between recording sites. From observations, a wave travels a maximum distance of b√2 between recording sites at 45° and a minimum distance of b at 90°. The velocity can be averaged from valid measurements on the LS with known distance and time. The magnitude of the velocity has a factor that depends on the direction (θ) of the wave. A sine function reproduces the maximum and minimum values around the POI (Fig. S1). The equation of the velocity can be written as
| (19) |
with
| (20) |
where
| (21) |
and
| (22) |
In above equations, ui are velocities along the LS i and the value of npi depends on whether a segment has a point (npi = 1) or not (npi = 0). Equation (19) is generalized for all cases and is used for correlation testing with our 4E method (Eq. 9).
RESULTS
Isotropic Tissue
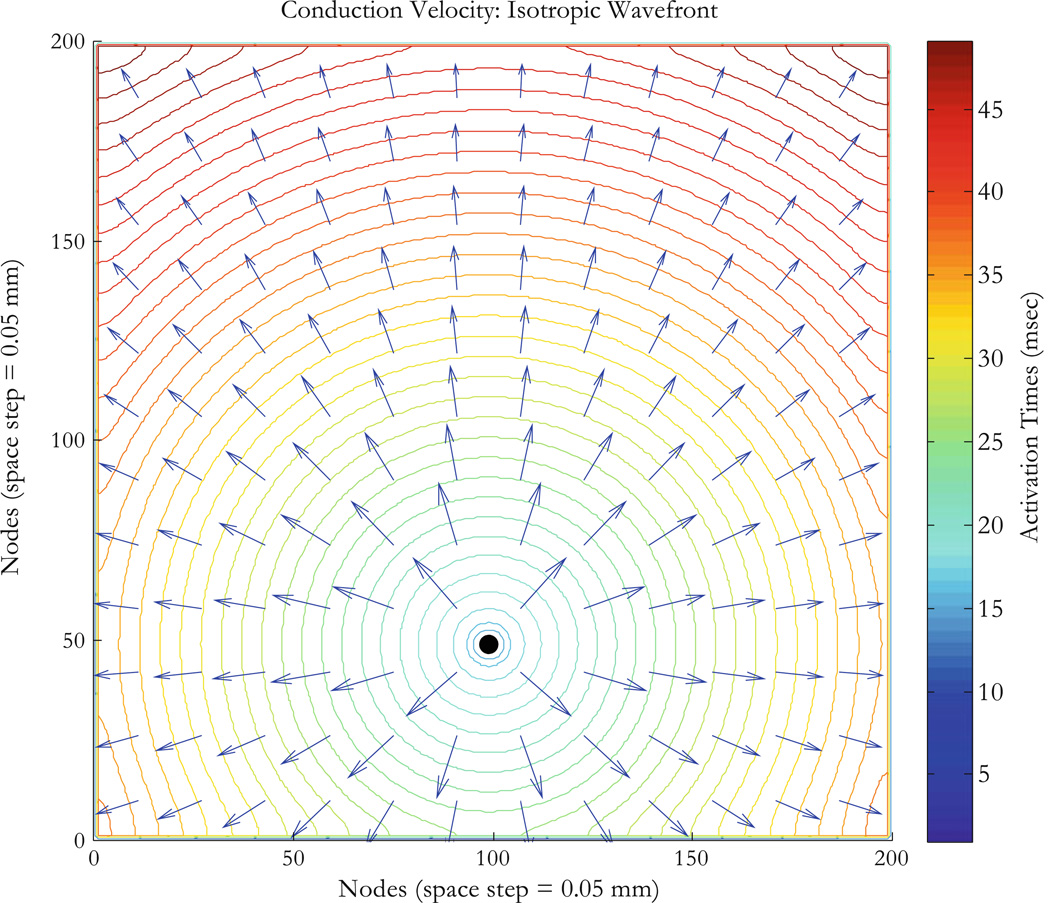
As a first example, consider an isotropic tissue (the intracellular and extracellular conductivities in the x and y directions are all equal, gix = giy = gex = gey = 0.1863 S/m).32 In this case, the ROC should simply be the distance from the stimulus site to the site of interest or POI, and the speed should be independent of direction. We performthis simulation by applying a unipolar stimulus of strength 0.05 V for a 5 ms duration and at time t = 10 ms. The stimulus is applied at the node corresponding to the Cartesian coordinates (100, 50) in the 200 ϗ 200 nodes configuration. The wave front is circular and travels radially away from the stimulus site as shown in Fig. 3. The curves represent contours of the wave front arrival time. The wave front finds excitable tissue and propagates radially with divergent velocity vectors exhibiting symmetry around the stimulus site as expected. Figure 4a shows five points that are 41 nodes from the stimulus node, where the wave front initiated. Corresponding values of the ROC are computed using three methods: (1) the DF which gives simply the distance between the stimulus point and the POI (POI or recording site), (2) the LS determine two points on the diagonal lines connecting the recording sites, and (3) our method (4E) based on Eq. (11). The ROC is undetermined for points B and D (respectively at 45° and 135°), and that is a limitation of the 4E method. The LS method provides an alternative to measuring the ROC at those angles.
Figure 3.
Isotropic tissue with unipolar stimulus. The arrival time contours and conduction velocity vectors (Eqs. 9 and 10) are for isotropic conductivities with a unipolar stimulus originating at node (100,50) represented by the black dot at the center of the circular wave fronts. The tissue sheet is 10 × 10 mm2 (200 × 200 nodes with 0.05 mm for space step). Activation times for nodes on wavefronts (ms) are shown by the colorbar. The conduction velocity is radial outward from the stimulus site as expected.
Figure 4.
Selected points for the isotropic case. Isotropic tissue with unipolar stimulus (applied at black dot) exhibits circular wave fronts with center at the stimulus site. (a) Values of the ROC for points shown on the wave front of radius 2.05 mm corresponding to 41 nodes, the coordinates are from the origin (lower left corner) in a 200 × 200 node configuration. Methods used are DF, LS, and the 4E method which is undefined for points B (135°) and D (45°). (b) Values of the conduction velocity (CV), Vcvt corresponds to values measured using the empirical method and Vcvr are values obtained using the 4E method.
Typical values of the conduction velocity are given for the same five points at equal distances from the stimulus (Fig. 4b). The conduction velocity is uniform in all directions with a variance of less than 0.5%: conduction velocities at points E and D are measured using the empirical method (0.250 and 0.254 m/s respectively) and our 4E method (0.253 and 0.254 m/s respectively). There is a slightly larger speed in the diagonal directions than the vertical and horizontal directions. This is not a limitation of Eq. (9), but instead reflects numerical errors in the solution of the bidomain equations that arise from the finite difference approximation to the differential equations, as can be verified by the reduction of this angular dependence as the space step (but not b) is made smaller.
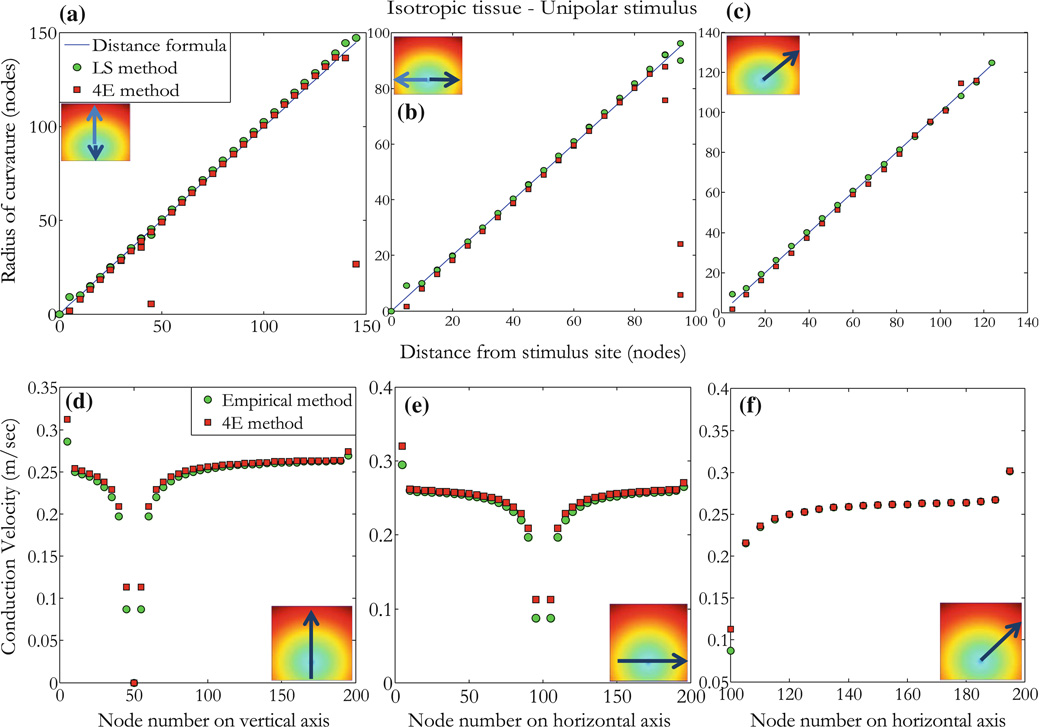
The ROC is shown along vertical (Fig. 5a), horizontal (Fig. 5b), and diagonal (Fig. 5c) lines (see insets) as a function of distance from the site the stimulus was applied. Note that the ROCr0 falls almost exactly along a line through the origin with slope of one, indicating that the calculated r0 is the same as the distance from the stimulus site for the isotropic case. The two methods (DF and LS) are shown to correlate with our 4E method. Except for edge points as seen inFig. 5a, outliers at about 50 and 150 nodes correspond to points on the edge of the tissue as shown in inset (arrows). Similar points exhibit a bad correlation at about 100 nodes in Fig. 5b. The distance on the x-axis corresponds to measurement from the stimulus site in units of node. The DF has relevance in the isotropic case (r = 0.9043 and p < 0.0001) and allows us to determine the accuracy of the LS method which we use to correlate with our method in the anisotropic and reentry cases. The correlation between our method (Eq. 9) and results from the empirical method (Eq. 19) in the isotropic case is shown for points along vertical (Fig. 5d), horizontal (Fig. 5e), and diagonal (Fig. 5f) lines radially outward from the stimulus. The conduction velocity (m/s) was correlated (r = 0.998, p < 0.0001) using our method (mean = 0.2403, SD = 0.0533) and the empirical method (mean = 0.2352, SD = 0.0560).
Figure 5.
Isotropic tissue with unipolar stimulus. (a) The ROC calculated from Eq. (11) (4E method) as a function of distance from the stimulus along the vertical line shown in inset (arrows indicate the direction and distance measured from the stimulus site in unit of nodes). Measurements are made using the DF (blue line), LS (green circles), and our method (4E, red squares). (b) Same as in (a) for points on a horizontal line as shown in inset, and (c) for points along line with equation y = 0.7x − 20 from the stimulus site as shown in inset. (d) Values of the conduction velocity (m/s) are measured using the empirical and 4E methods for points along the line shown in inset (node position is represented by node number on vertical or horizontal line in the direction of the arrow). (e) Similar to (d), conduction velocity is measured for points along a horizontal line as shown in inset, and (f) for points on a line with equation as in (c). Close to the unipolar stimulus and by the edge of the tissue, data becomes poorly correlated because activation times and wave fronts are perturbed by edge effects (tissue size is 200 × 200 nodes with a space step of 0.05 mm).
Anisotropic Tissue
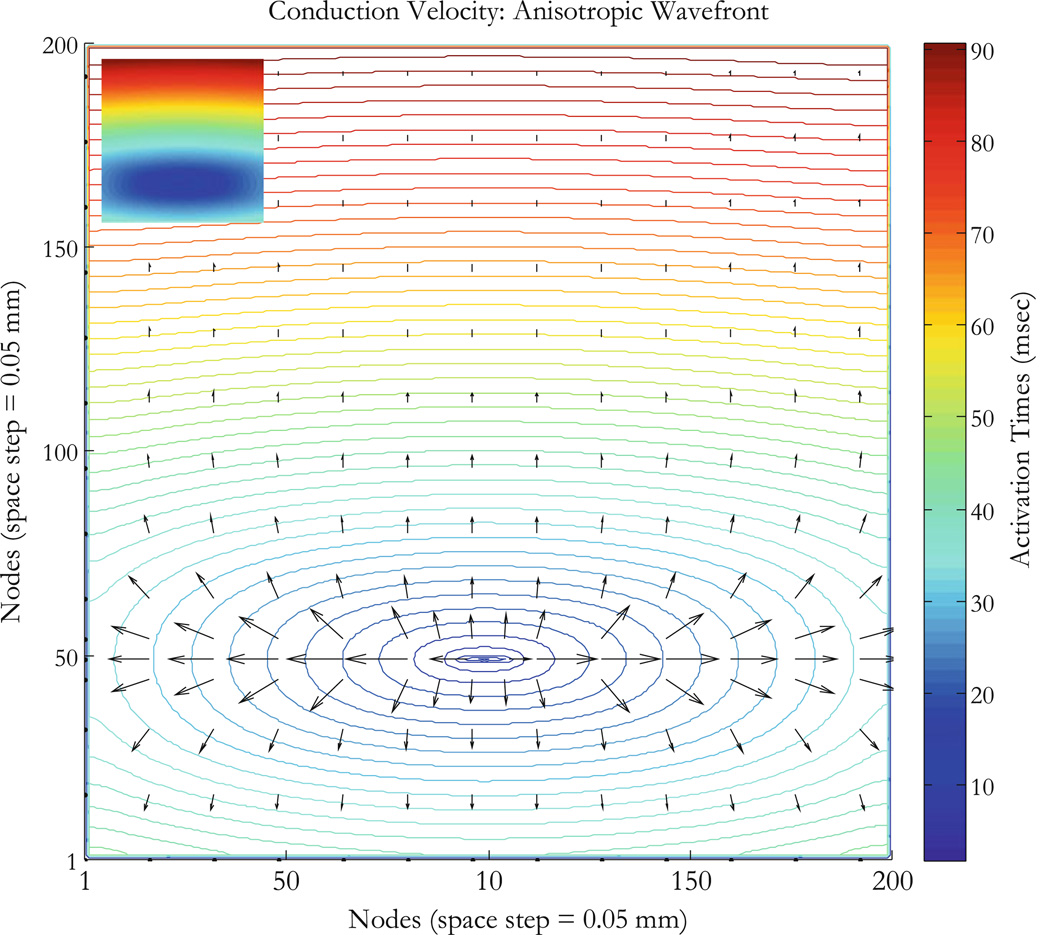
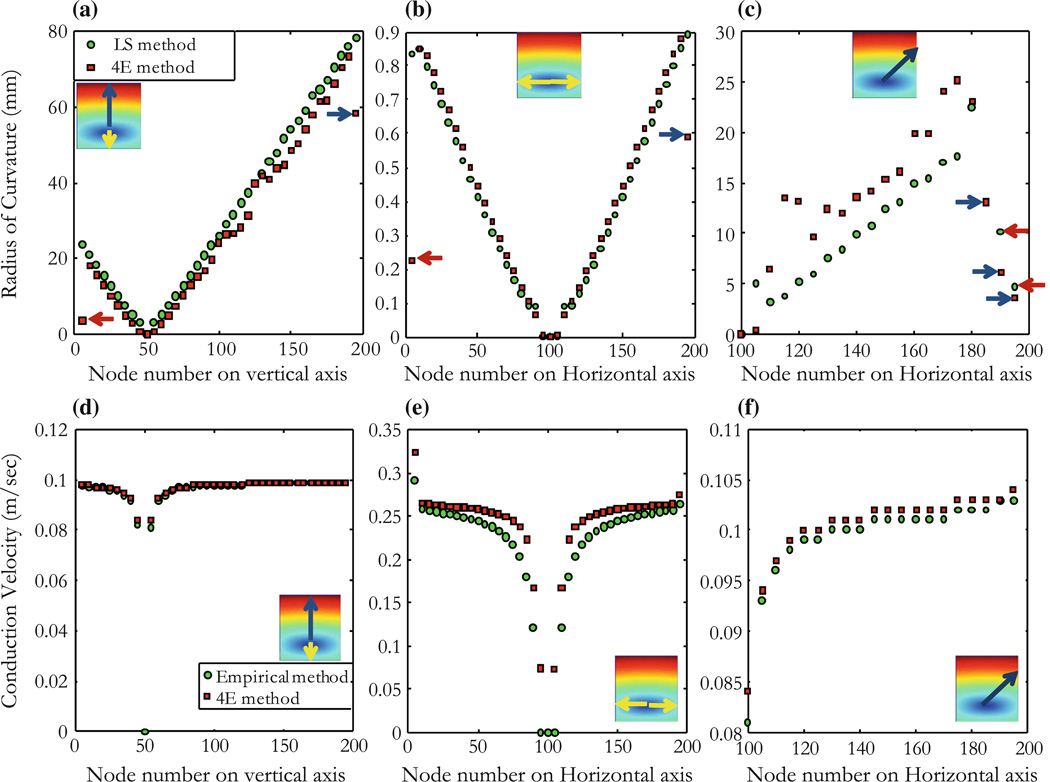
For a second example, we consider anisotropic tissue with realistic conductivity values (gix = gex = 0.1863 S/m, giy = 0.0186 S/m, and gey = 0.0745 S/m).32 Using a unipolar stimulus as in the isotropic case, we simulate an elliptical wave front and find that the conduction velocity is larger in the direction of the fibers as would be expected from the anisotropy, Fig. 6. The ROC of the wave front is plot for points as shown in insets of Figs. 7a, 7b, and 7c, the radius is dramatically smaller in the direction parallel to the fibers (horizontal, Fig. 7b) than in the direction perpendicular to the fibers (vertical, Fig. 7a). The figure shows low values of the ROC in the vicinity of the stimulus point at (100, 50), and an increase in the uncertainty of the calculated radius when the wave front is flat so r0 is large. Figure 7a shows points on a vertical line (yellow and blue arrows) through the stimulus site (stimulus site is at 50 nodes), Fig. 7b shows points on a horizontal line (yellow arrows) through stimulus site (stimulus is at 100 nodes), and Fig. 7c shows points along a diagonal described by the equations y = 0.7x − 20 for which case the x-axis represent the x-components of the points on the diagonal in inset. Blue and red arrows show outliers corresponding to points by the edge of the tissue where the wave front is perturbed. Measurements are correlated for points on a vertical line using our 4E method (mean = 1.43, SD = 1.14) and the LS method (mean = 1.65, SD = 1.20 with r = 0.9773, p < 0.0001). The conduction velocity (Figs. 7d, 7e, and 7f) is measured for points on the elliptical wave fronts along vertical, horizontal, and diagonal lines using our 4E method described in Eq. (9) (mean = 0.0945, SD = 0.0159) and correlated with data from the empirical method described by Eq. (19) (mean = 0.0942, SD = 0.016 with r = 0.9892, p < 0.0001).
Figure 6.
Anisotropic tissue mapping. Tissue sheet is 10 × 10 mm2 (200 × 200 nodes at 0.05 mm space step). Arrival time contours are shown in ms corresponding to activation times at nodes on elliptical wave fronts; fiber direction is horizontal and the conduction velocity is greater in that direction for the anisotropic tissue. Colorbar shows arrival times at nodes on wave fronts; vectors (black) are conduction velocities for points on the wave fronts (activation map shown in inset).
Figure 7.
Anisotropic tissue with a unipolar stimulus. Measurements are made for points along vertical, horizontal, and diagonal (y = 0.7x − 20) lines as shown in insets. The ROC (mm) for the anisotropic tissue is measured using the 4E and the LS methods, described by Eqs. (11) and (15) respectively. (a) Points are on a vertical line (yellow and blue arrows) through the stimulus site (stimulus site is at 50 nodes), (b) points are on a horizontal line (yellow arrows) through stimulus site (stimulus is at 100 nodes), and (c) along a diagonal described by the equations y = 0.7x − 20, x-axis represent the x-components of the points on the diagonal in inset. Blue and red arrows show outliers corresponding to points by the edge of the tissue where the wave front is perturbed. (d, e, and f) Conduction velocity (m/s) for the anisotropic tissue using the empirical method (Eq. 19) and the 4E method (Eq. 9) and for points as described for (a), (b), and (c).
Anisotropic Tissue with Geometry and Reentry
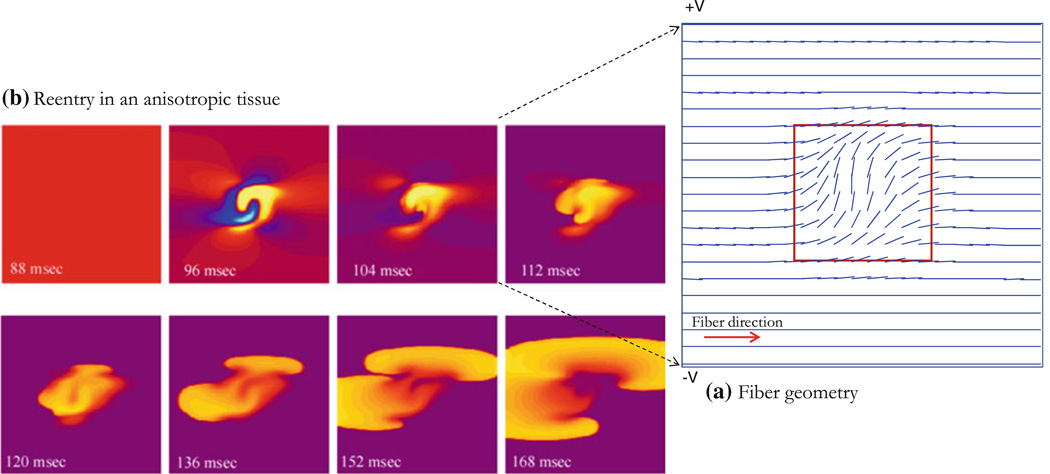
As a last example, we consider the case of reentry, which consists of complex fiber geometry in the tissue. The fiber angle is zero except in the central region of size D (D = 6 mm in a 20 ϗ 20 mm2 tissue), shown in Fig. 8a and represented by the function in Eq. (23), below. This geometry results in the fiber angle being π/2 at the tissue center, and decreasing smoothly to zero at x = y= ±D/2 from the center,
| (23) |
Figure 8.
Reentry in an anisotropic tissue with curving fibers. (a) Fiber geometry and orientation shown for the region of size D, the fiber angle is zero except in the region in the middle of the tissue where the fiber behaves according to Eq. (23), the region D × D (red square) inside the tissue has size D = 6.0 mm in a tissue of size 20 × 20 mm2 (only central region shown). (b) A stimulus is applied at ± V in an S1–S2 protocol with S2 = 105 V and a time (S2–S1) = 90 ms, S2 applied for 5 ms (S1 raises the tissue to an excitable state, in this case the whole tissue is at 0.0 V). Yellow is depolarization, blue is hyperpolarization, and purple is rest.
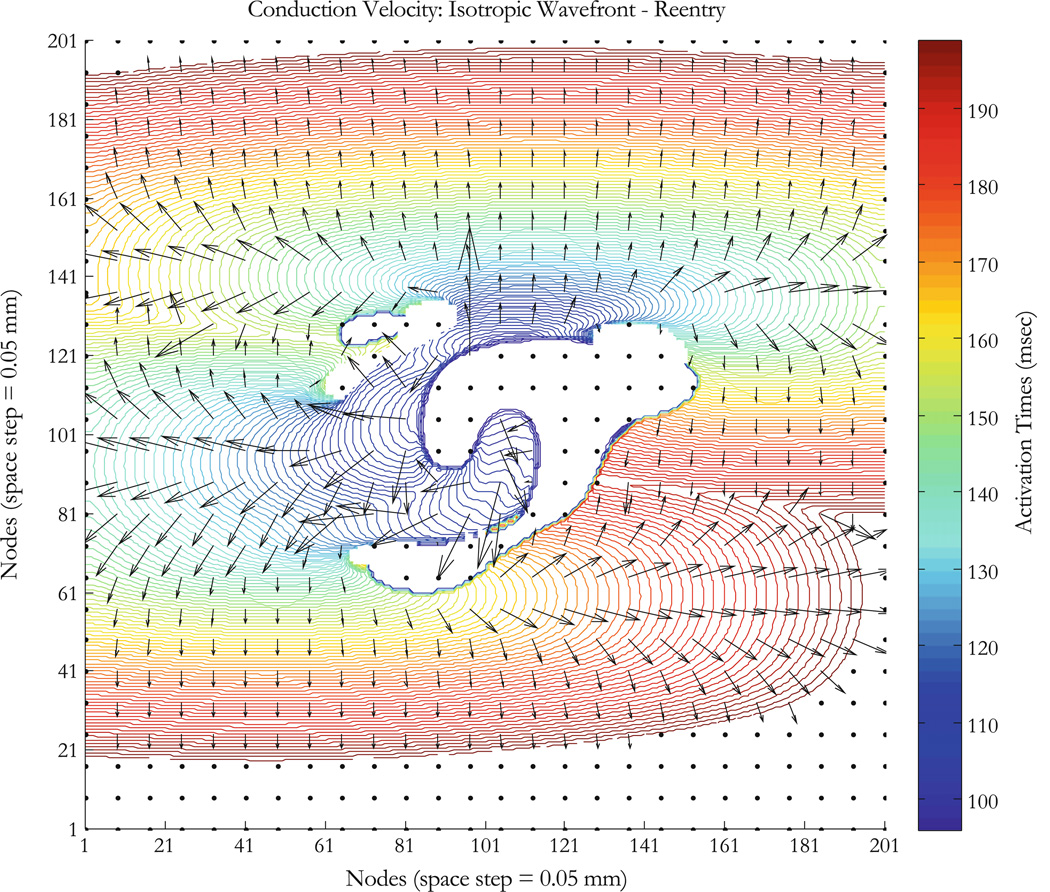
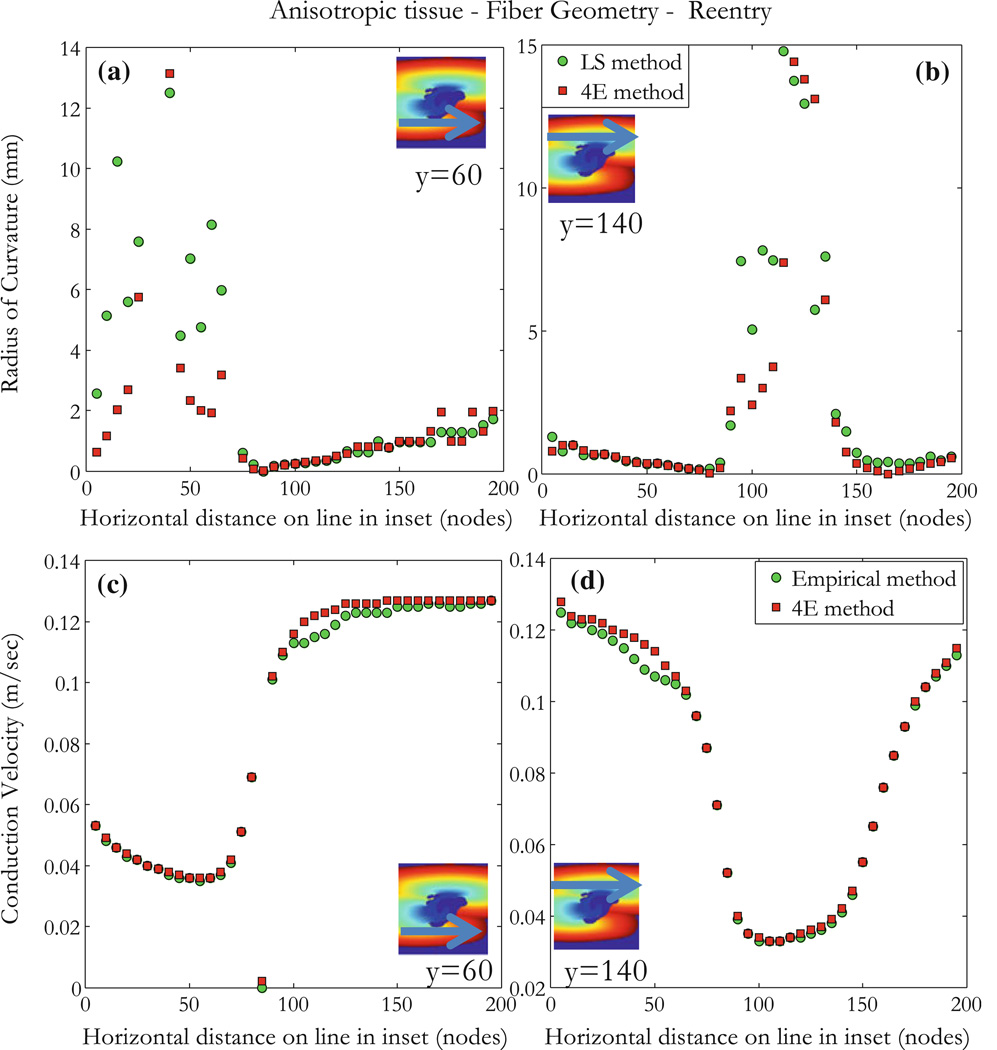
This tissue is an example we analyzed previously when modeling the upper limit of vulnerability in the heart (Fig. 44 in Mazeh23). The stimulation is an S1–S2 protocol with S1 raising the whole tissue to an excitable state and applying an S2 stimulus with shock electrodes along the upper and lower edge at ±V (volts), where S2 = 105 V, the S1–S2 interval is 90 ms, and S2 is applied for 5 ms. Results are shown in Fig. 8b. At 88 ms, the tissue has not yet recovered and is still refractory. The response to the S2 shock is shown in the 96 ms frame. Because of the fiber curvature, the tissue has adjacent regions of depolarization (virtual cathode, yellow) and hyperpolarization (virtual anode, blue). Make excitation (excitation following the start of the stimulus pulse) cannot occur in the depolarized regions because the tissue is refractory, but break (excitation following the end of the stimulus pulse) excitation occurs following the end of the S2 shock (104–120 ms).24 Once the break wave front reaches the edge of the virtual anode, the surrounding tissue has recovered sufficiently to allow the wave front to propagate outward and to the right and re-entry can be seen at 168 ms. The conduction velocity is large in the virtual anode; rapid propagation through a virtual anode is thought to be one mechanism for the upper limit of vulnerability.7 The wave front and conduction velocity profile are reproduced for the area around the virtual electrode as shown in Figs. 9 and S2. The ROC does not have good correlation for large values as expected; there is an increase in the uncertainty of the calculated radius (large r0) (Figs. 10a and 10b). Blue regions in insets have no wave fronts, at the border limit between regions of activation and no activation, arrival times are not very accurate because points overlap, and this explains partly the weak correlation in those regions. Another reason is that for an almost flat wave front, the ROC becomes very high and that is a limitation of our method. Figure 10a shows poor correlation for points x < 70 and Fig. 10b shows that for 80 < x < 140. Conduction velocities of the propagating wave front are shown for about 200 ms (colorbar in Fig. 9 represents activation times). Conduction velocity measurements are correlated between the empirical and the 4E methods for different points as shown in insets of Figs. 10c and 10d. The results indicate that our method allows determination of conduction velocity even in the case of a complicated reentrant circuit.
Figure 9.
Anisotropic tissue mapping with fiber geometry, a case of reentry. Tissue sheet is 10 × 10 mm2 (200 × 200 nodes with a space step of 0.05 mm); a geometry described by Eq. (23) and Fig. 8a is integrated to produce a virtual electrode polarization (Fig. 8b at 96 ms). Reentry is induced as describe in Mazeh23 (Fig. 44). Colorbar shows arrival times in ms (whole run time is about 200 ms), contours correspond to activation times at nodes on the wave fronts; fiber direction is horizontal (except for the D × D region described in Fig. 8a) and the conduction velocity is greater in that direction for the anisotropic tissue. Vectors (black) are conduction velocities for points on the wave fronts.
Figure 10.
Anisotropic tissue with reentry. Results are for the 104 ms map in Fig. 8b. Measurements are made for points on lines as shown in insets: (a and b) ROC (mm) measurements are made using the 4E and the LS methods. (c and d) Conduction velocity (m/s) measurements are made using the 4E and the empirical methods. Regions in inset are defined by the color bar in Fig. 9 (blue regions have no wave fronts). Our method correlates poorly in the border line between activation and no activation and for almost flat wave front when the ROC becomes very high as shown in (a) for points x<70 and (b) for 80<x<140.
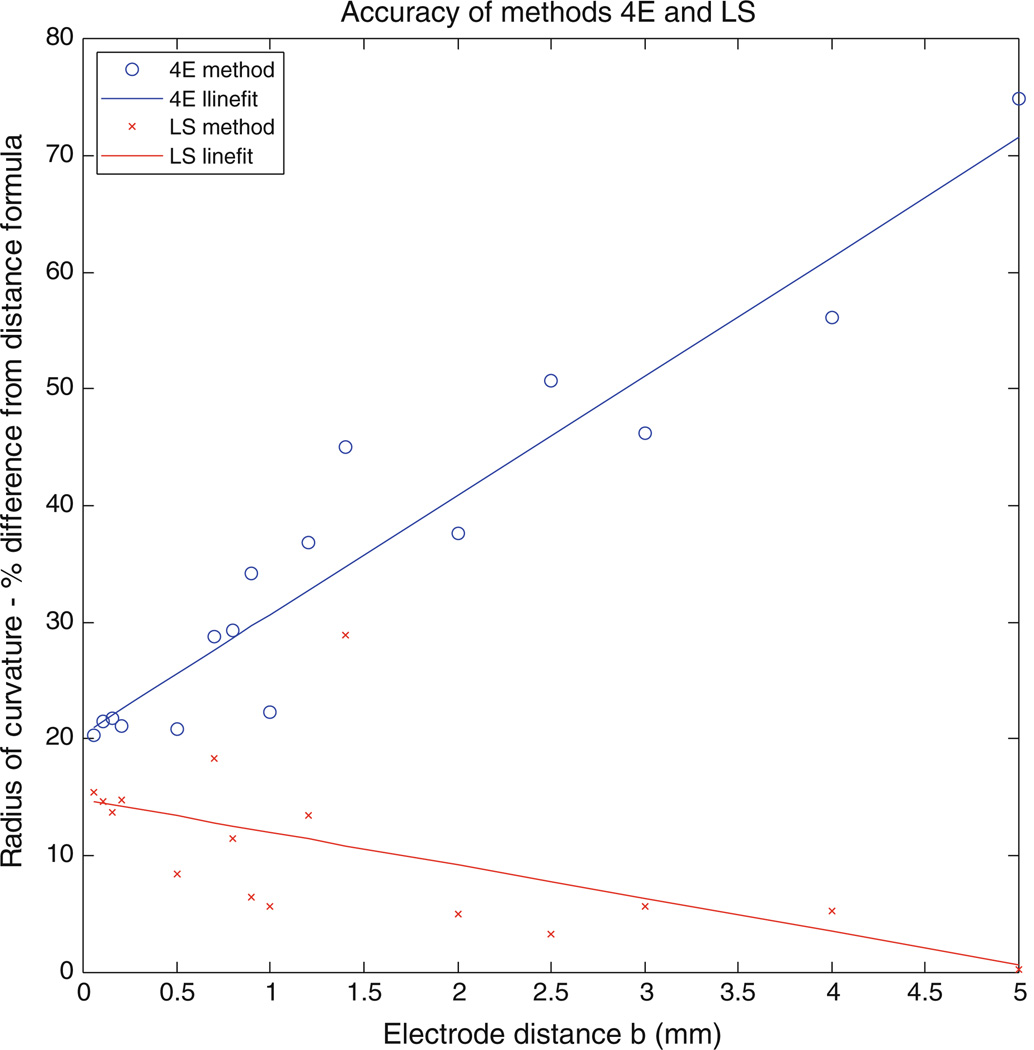
Our simulations have used a relatively small value of b equal to 0.05 mm, which equals the space step in our calculation; the arrival time could be measured to at least the accuracy of one time step (0.005 ms). However, in experiments the electrode size and time step may be larger. We repeated the simulation for a space step of 0.1 mm and found no differences. We also repeated the isotropic simulation for different electrode distances for a space step of 0.05 mm and found a lower correlation for the 4E method but a better correlation with the LS method. Figure 11 shows percent difference for the ROC from the DF that both methods (4E and LS) exhibit for different values of b. The space step is 0.05 mm and b is varied. In method 4E, b is assumed to be much smaller than the ROC and hence would not perform well as b increase. On the other hand, the LS method which determines the arc of a circle to measure the ROC improves with increasing values of b.
Figure 11.
Accuracy of methods 4E and LS, for the isotropic simulation. Percent difference for the ROC from the DF is shown for both methods (4E and LS). Points are fit using a Linefit (Matlab). Method 4E correlates poorly as the distance between electrode b increases while method LS has a better correlation, the space step is maintained at 0.05 mm.
DISCUSSION
Important progress has been made in analyzing the mechanistic phenomena underlying cardiac rhythms. Most notable of the techniques used in studying arrhythmias is high-resolution cardiac mapping, performed using a network of electrodes in contact with the myocardium.33 Activation times are computed from individual electrograms that are simultaneously recorded to construct isochronal contour maps. While the cardiac mapping method is well suited for sinus rhythms, it becomes cumbersome and ineffective in the presence of arrhythmias presenting with reentry and fibrillatory conduction patterns in cardiac tissue. In these conditions epicardial mapping shows ambiguities in detecting local activations and grouping them into coherent cardiac beats.4 Assumptions made in the construction and use of isochronal cardiac maps to study arrhythmia mechanisms and to guide ablative therapies are not completely reliable, and could in fact can be misleading.16 Another technique in constructing activation time maps is called isoderivative and consists of using temporal electrogram derivatives.10 Serial isoderivative maps, the temporal sequence of spatial distribution of electrogram derivatives, showed differences when compared with isochrones. It was later demonstrated that time derivatives in determining activation time on fractionated unipolar electrograms give errors in building isochronal maps, partially due to the epicardial distribution of those fractionated electrograms.28 Activation patterns during ventricular fibrillation (VF) can also be visualized in animated displays of mapped potentials.20,21,29 The method has some advantages over isochronal mapping in that it does not depend on the measurement of activation times and allows for large amounts of data to be screened rapidly, since they are not manually processed. It has also been shown that a lower correlation exist between activation times estimated using the time derivative method and the time series of potential maps.28 Spatial methods (maximum spatial gradient and zero Laplacian) are preferred over the time derivative method for the case of epicardial pacing where large numbers of fractionated electrograms are found. A method to quantify VF activation patterns based on a decomposition of the rhythm into its constituent activation wave fronts has also been proposed.29 In this robust method of isolating wave fronts in epicardial mapping data, properties of a VF episode are quantified in terms of statistical measures of the wave fronts themselves (mean wave front size) and in terms of inter wave front relationships (fractionations and collisions). A limitation of the method is that it is difficult to accurately represent the spatial extent of the wave fronts from the data. A good estimation of the number of wave fronts on the recording array depends on a high number of electrodes (~2000) in the mapping system. Such systems with high electrode number are not practical for clinical measurements where electrodes as currently used are of the order of 2 mm in diameter.
Our method for analyzing conduction provides three important parameters—conduction speed, direction, and ROC—from simple measurements of the arrival time of the wave front. Because the method requires only arrival times, it is suitable for use with either optical mapping measurements of the transmembrane potential,8,12,14,22,30 or extracellular potential recordings using an array of electrodes. The method is easier to use than more sophisticated techniques that require extensive numerical analysis. Bayly et al.2 use a method based on observed epicardial extracellular potentials and fit polynomial surfaces to the space–time coordinates of activity. In their method, they compute conduction velocity and direction from the gradient of the local polynomial surfaces. Kay and Gray19 use a method of generating smooth, continuous parameterizations of wave shapes from cubic smoothing splines fitted to isopotentials. Conduction velocities are then computed as the wave speed along lines normal to the parametric form. We compared our method with the Kay–Gray method by computing conduction velocities using their mapping data, results are shown for collision and breakup wavefronts in Fig. S3. Discrepancies observed in the lower figures between 4E and Kay– Gray methods for both breakup and collision wavefronts are due to the fact that we used mapping data generated by Kay and Gray to fit their method of spline fitting. There is nevertheless good correlation for the conduction velocity shown on the upper right plots of both breakup and collision wavefronts (Figs. S3a and S3b upper right).
Our method has several limitations. First, Eq. (11) that determines the ROC is indeterminate (0/0) when the direction of the wave front is at an angle of 45°. While this is a significant limitation using Eq. (11), we can overcome it by using the LS method described in Fig. 2b and Eqs. (12)–(15) or using a second set of four points rotated 45° relative to the first as described in the model description above. Second, the method requires accurate measurement of arrival time differences between nearby electrodes, which should become more accurate as the distance between electrodes increases. However, our analysis is based on the assumption that the distance between electrodes is small compared to the ROC. Thus, the selection of the best value of b will be a trade-off between these two factors. We can see this limitation in Figs. 5, 7, and 10, where the measurement of the ROC becomes noisy as the wave front becomes flat (small ε, large r0). The method shows good accuracy for a value of ε between 0.001 (Fig. 7a, r0 < 50 mm for b = 0.05 mm, one space step) and 0.5 (Fig. 7b, r0 > 0.1 mm for b = 0.05 mm). The anisotropic case was a good test because it provides an elliptical wavefront which becomes almost flat in the direction perpendicular to the fiber direction and circular with a small ROC in the direction of the fibers (Fig. 6). Third, the method was developed for two-dimensional sheets of tissue. We are working on extending the model to 3-d, which would yield the three-dimensional conduction velocity distribution from measurements of the extracellular potential using plunge electrodes. However, we have not yet performed any 3-d simulations. Fourth, our analysis assumes the positions of the electrodes are known precisely. Uncertainties in electrode position may be one of the limiting factors determining the precision of these measurements.
Despite these limitations, this method provides a quick and easy way to determine wave front speed, direction, and curvature. The simplified approach can be applied to a variety of clinical conditions to predict behavior of planar, elliptical, and reentrant wave fronts. Understanding the genesis and propagation of rotors in human arrhythmias such as atrial fibrillation is necessary to design the optimal strategy and define the optimal targets for catheter ablation. This methodology may lead to rotor mapping using low density endocardial recording electrodes. The basic assumption in the algorithm is that the wavefront is locally circular. That is, the ROC is large enough that locally we can approximate the wave front as a circle. It is ideal for computer simulations performed on a Cartesian grid, as it allows for a complete map of these variables to be obtained simply. It also suggests that an array of four or five electrodes in a square should provide a simple way to measure wave front properties during animal experiments. Such an array might also have use clinically for simple point recordings of wave front speed, direction, and curvature. It can be tested clinically by measurements of a four-electrode array placed on the heart surface. Figure 11 shows that our method using the LS to measure the ROC has a good accuracy as the electrode spacing increases.
Supplementary Material
ACKNOWLEDGMENTS
This research was funded by the Department of Cardiovascular Medicine at Beaumont Health System, Royal Oak, Michigan. Dr. M. W. Kay received support from the NIH Grant (HL095828). We wish to thank Drs. R. A. Gray and J. M. Rogers for their helpful discussions and insights.
NOMENCLATURE
- v
Wave front speed
- θ
Angle specifying wave front velocity direction
- r0
Radius of curvature
- b
Recording sites spacing (shortest distance)
- ε
Ratio of electrode spacing over radius of curvature
- gix
Intracellular conductivity in the x-direction
- giy
Intracellular conductivity in the y-direction
- gex
Extracellular conductivity in the x-direction
- gey
Extracellular conductivity in the y-direction
- tn
Activation time at electrode n, where n = 1, 2, 3, or 4
- Δtij
Difference of activation times between the ith and jth electrodes
- Δτi
Time for wave front to travel segment i
- S1–S2
Stimulation protocol using stimulus of strength S1 and at a later time stimulus S2
- D
Side of square inside the tissue where fibers curve
- POI
Point of interest
- DF
Distance formula
- LS
Line segments method
- 4E
Our computational method
- VF
Ventricular fibrillation
- Vm
Membrane potential
Footnotes
ELECTRONIC SUPPLEMENTARY MATERIAL
The online version of this article (doi:10.1007/s13239-013-0158-2) contains supplementary material, which is available to authorized users.
CONFLICT OF INTEREST
None.
REFERENCES
- 1.Allessie MA, Bonke FJM, Schopman FJG. Circus movement in rabbit atrial muscle as a mechanism of tachycardia, III: the “leading circle” concept. A new model of circus movement in cardiac tissue without involvement of an anatomical obstacle. Circ. Res. 1977;41:9–18. doi: 10.1161/01.res.41.1.9. [DOI] [PubMed] [Google Scholar]
- 2.Bayly PV, KenKnight BH, Rogers JM, Hillsley RE, Ideker RE, Smith WM. Estimation of conduction velocity vector fields from epicardial mapping data. IEEE Trans. Biomed. Eng. 1998;45:563–571. doi: 10.1109/10.668746. [DOI] [PubMed] [Google Scholar]
- 3.Beeler GW, Reuter H. Reconstruction of the action potential of ventricular myocardial fibres. J. Physiol. 1977;268:177–210. doi: 10.1113/jphysiol.1977.sp011853. [DOI] [PMC free article] [PubMed] [Google Scholar]
- 4.Berbari EJ, Lander P, Scherlag BJ, Lazara R, Gesesowitz DB. Ambiguities of epicardial mapping. J. Electrocardiol. 1992;24:16–20. doi: 10.1016/s0022-0736(10)80007-x. [DOI] [PubMed] [Google Scholar]
- 5.Berenfeld O, Pertsov AM. Dynamics of intramural scroll waves in three dimensional continuous myocardium with rotational anisotropy. J. Theor. Biol. 1999;199:383–394. doi: 10.1006/jtbi.1999.0965. [DOI] [PubMed] [Google Scholar]
- 6.Cabo C, Pertsov AM, Baxter WT, Davidenko JM, Gray RA, Jalife J. Wave-front curvature as a cause of slow conduction and block in isolated cardiac muscle. Circ. Res. 1994;75:1014–1028. doi: 10.1161/01.res.75.6.1014. [DOI] [PubMed] [Google Scholar]
- 7.Charteris N, Roth BJ. How hyperpolarization and recovery of excitability affect propagation through a virtual anode in the heart. Comput. Math. Methods Med. 2011;2011:375059. doi: 10.1155/2011/375059. [DOI] [PMC free article] [PubMed] [Google Scholar]
- 8.Davidenko JM, Pertsov AV, Salomonsz R, Baxter W, Jalife J. Stationary and drifting spiral waves of excitation in isolated cardiac muscle. Nature. 1992;355:349–351. doi: 10.1038/355349a0. [DOI] [PubMed] [Google Scholar]
- 9.El-Sherif N, Caref EB, Yin H, Restivo M. The electrophysiological mechanism of ventricular arrhythmias in the long QT syndrome: tridimensional mapping of activation and recovery times. Circ. Res. 1996;79:474–492. doi: 10.1161/01.res.79.3.474. [DOI] [PubMed] [Google Scholar]
- 10.Ershler PR, Lux RL. Derivative mapping in the study of activation sequence during ventricular arrhythmias. In: Ripley KL, editor. Proceedings of Computers in Cardiology. New York: IEEE Computer Society Press; 1986. pp. 623–624. [Google Scholar]
- 11.Fast VG, Kleber AG. Role of wavefront curvature in propagation of cardiac impulse. Cardiovasc. Res. 1997;33:258–271. doi: 10.1016/s0008-6363(96)00216-7. [DOI] [PubMed] [Google Scholar]
- 12.Girouard SD, Pastore JM, Laurita KR, Gregory KW, Rosenbaum DS. Optical mapping in a new guinea pig model of ventricular tachycardia reveals mechanisms for multiple wavelengths in a single reentrant circuit. Circulation. 1996;93:603–613. doi: 10.1161/01.cir.93.3.603. [DOI] [PubMed] [Google Scholar]
- 13.Gray RA, Jalife J. Mechanisms of cardiac fibrillation. Science. 1995;270:1222–1223. [PubMed] [Google Scholar]
- 14.Gray RA, Pertsov AM, Jalife J. Spatial and temporal organization during cardiac fibrillation. Nature. 1998;392:75–78. doi: 10.1038/32164. [DOI] [PubMed] [Google Scholar]
- 15.Horner SM, Vespalcova Z, Lab MJ. Electrode for recording direction of activation, conduction velocity, and monophasic action potential of myocardium. Am. J. Physiol. 1997;272:H-1917–H-1927. doi: 10.1152/ajpheart.1997.272.4.H1917. [DOI] [PubMed] [Google Scholar]
- 16.Ideker RE, Smith WM, Blanchard SM, Reiser SL, Simpson EV. The assumptions of isochronal cardiac mapping. PACE. 1989;12:456–478. doi: 10.1111/j.1540-8159.1989.tb02684.x. [DOI] [PubMed] [Google Scholar]
- 17.Janse MJ, van Capelle FJL, Morsink H, Kléber AG, Wilms-Schopman F, Cardinal R, d’Alnoncourt CN, Durrer D. Flow of “injury” current and patterns of excitation during early ventricular arrhythmias in acute regional myocardial ischemia in isolated porcine and canine hearts: evidence for two different arrhythmic mechanisms. Circ. Res. 1980;47:151–165. doi: 10.1161/01.res.47.2.151. [DOI] [PubMed] [Google Scholar]
- 18.Kadish AH, Spear JF, Levine JH, Hanich RF, Prood C, Moore EN. Vector mapping of myocardial activation. Circulation. 1986;74:603–615. doi: 10.1161/01.cir.74.3.603. [DOI] [PubMed] [Google Scholar]
- 19.Kay MW, Gray RA. Measuring curvature and velocity vector fields for waves of cardiac excitation in 2-D media. IEEE Trans. Biomed. Eng. 2005;52:50–63. doi: 10.1109/TBME.2004.839798. [DOI] [PubMed] [Google Scholar]
- 20.KenKnight BH, Bayly PV, Gerstle RJ, Rollins DL, Wolf PD, Smith WM, Ideker RE. Regional capture of fibrillating ventricular myocardium. Evidence of an excitable gap. Circ. Res. 1995;77:849–855. doi: 10.1161/01.res.77.4.849. [DOI] [PubMed] [Google Scholar]
- 21.Laxer C, Alferness C, Smith WM, Ideker RE. The use of computer animation of mapped cardiac potentials in studying electrical conduction properties of arrhythmias. In: Murray A, Ripley KL, editors. Proceedings of Computers in Cardiology. Chicago, IL: IEEE Computer Society Press; 1990. pp. 23–26. [Google Scholar]
- 22.Lin S-F, Abbas RA, Wikswo JP., Jr High-resolution high-speed synchronous epifluorescence imaging of cardiac activation. Rev. Sci. Instrum. 1997;68:213–217. [Google Scholar]
- 23.Mazeh N. PhD dissertation. Rochester, MI: Oakland University; 2008. The upper limit of vulnerability of the heart. [Google Scholar]
- 24.Mazeh N, Roth BJ. A mechanism of the upper limit of vulnerability. Heart Rhythm. 2009;6:361–367. doi: 10.1016/j.hrthm.2008.11.010. [DOI] [PMC free article] [PubMed] [Google Scholar]
- 25.Moe GK, Rheinboldt WC, Abildskov JA. A computer model of atrial fibrillation. Am. Heart J. 1964;67:200–220. doi: 10.1016/0002-8703(64)90371-0. [DOI] [PubMed] [Google Scholar]
- 26.Pertsov AM, Davidenko JM, Salomonsz R, Baxter WT, Jalife J. Spiral waves of excitation underlie reentrant activity in isolated cardiac muscle. Circ. Res. 1993;72:631–650. doi: 10.1161/01.res.72.3.631. [DOI] [PubMed] [Google Scholar]
- 27.Pogwizd SM, Corr PB. Reentrant and nonreentrant mechanisms contribute to arrhythmogenesis during early myocardial ischemia: results using three-dimensional mapping. Circ. Res. 1987;61:352–371. doi: 10.1161/01.res.61.3.352. [DOI] [PubMed] [Google Scholar]
- 28.Punske BB, Ni Q, Lux RL, MacLeod RS, Ershler PR, Dustman TJ, Allison MJ, Taccardi B. Spatial methods of epicardial activation time determination in normal hearts. Ann. Biomed. Eng. 2003;31:781–792. doi: 10.1114/1.1581877. [DOI] [PubMed] [Google Scholar]
- 29.Rogers JM, Usui M, KenKnight BH, Ideker RE, Smith WM. A quantitative framework for analyzing epicardial activation patterns during ventricular fibrillation. Ann. Biomed. Eng. 1997;25:749–760. doi: 10.1007/BF02684159. [DOI] [PubMed] [Google Scholar]
- 30.Rosenbaum DS, Jalife J. Optical Mapping of Cardiac Excitation and Arrhythmias. Armonk, NY: Futura Pub Co; 2001. [Google Scholar]
- 31.Roth BJ. How the anisotropy of the intracellular and extracellular conductivities influences stimulation of cardiac muscle. J. Math. Biol. 1992;30(6):633–646. [PubMed] [Google Scholar]
- 32.Roth BJ. Electrical conductivity values used with the bidomain model of cardiac tissue. IEEE Trans. Biomed. Eng. 1997;44:326–328. doi: 10.1109/10.563303. [DOI] [PubMed] [Google Scholar]
- 33.Smith WM, Wolf PD, Simpson EV, Danieley ND, Ideker RE. Mapping ventricular fibrillation and defibrillation. In: Shenesa M, Borggrefe M, Breithard G, editors. Cardiac Mapping. Mount Kisco, NY: Futura Publishing Co; 1993. pp. 251–260. [Google Scholar]
- 34.Spach MS, Miller WT, III, Geselowitz DB, Barr RC, Kootsey J, Johnson EA. The discontinuous nature of propagation in normal canine cardiac muscle: evidence for recurrent discontinuities of intracellular resistance that affect the membrane currents. Circ. Res. 1981;48:39–54. doi: 10.1161/01.res.48.1.39. [DOI] [PubMed] [Google Scholar]
- 35.Spooner PM, Joyner RW, Jalife J. Discontinuous Conduction in the Heart. Armonk, NY: Futura Publishing; 1997. [Google Scholar]
- 36.Tung L. PhD Thesis. Cambridge, MA: MIT; 1977. A bi-domain model for describing ischemic myocardial D-C potentials. [Google Scholar]
- 37.Winfree AT. Heart muscle as a reaction-diffusion medium: the roles of electric potential diffusion, activation front curvature, and anisotropy. Int. J. Bifurcation Chaos. 1997;7:487–526. [Google Scholar]
Associated Data
This section collects any data citations, data availability statements, or supplementary materials included in this article.


