

Abstract
We present a theoretical analysis and experimental demonstration of particle trapping and manipulation around optothermally generated bubbles. We show that a particle located within 500 μm of a surface bubble can be attracted towards a bubble by the drag force resulting from a convective flow. Once the particle comes in contact with the bubble’s surface, a balance between surface tension forces and pressure forces traps the particle on the bubble surface, allowing the particle to move with the bubble without detaching. The proposed mechanism is confirmed by computational fluid dynamics simulations, force calculations, and experiments. Based on this mechanism, we experimentally demonstrated a novel approach for manipulating microparticles via optothermally generated bubbles. Using this approach, randomly distributed microparticles were effectively collected and carried to predefined locations. Single particles were also manipulated along prescribed trajectories. This bubble-based particle trapping and manipulation technique can be useful in applications such as micro assembly, particle concentration, and high-precision particle separation.
Introduction
Recently, the use of bubbles in microfluidics1-6 has led to many unique approaches for handling liquids,7-15 microparticles,16-18 cells,19 or molecules20 on a chip. Most of these approaches require mechanisms not only to generate micro-bubbles with well-defined sizes, but also to actively control their locations. To fulfill these requirements within microfluidic devices, researchers have developed several bubble generation and manipulation mechanisms,21-25 among which optothermally generated bubbles7,20,26-28 have received significant attention. The optothermal-based approach can conveniently generate bubbles and actively control their locations and sizes with simple setups.29-33 It uses a weakly focused, continuous wave laser to heat a strong laser-absorbing metal (e.g., silver or gold) immersed in a liquid. After the temperature of the liquid near the metal surface is heated to its boiling point, a bubble is generated at the metal-liquid interface. The size and movement of the bubble can be flexibly controlled by adjusting the exposure time and the location of the laser. So far, optothermally generated bubbles have been applied in liquid control,7 single DNA stretching,20 the assembly of micro-components,26-28 plasmonic lens, 34-37 and nanoparticle accumulation.38
Besides the aforementioned applications, optothermally generated bubbles can potentially be utilized for particle trapping and manipulation,39 which is an important tool for many physical,40-49 chemical,50,51 and biological studies.52-56 It has been shown that particles located near an optothermally generated bubble can be trapped on the surface of a bubble.31,32,38 However, currently, the underlying mechanism for particle trapping using an optothermal bubble has not been fully understood. A number of effects, including van der Waals forces,38 thermophoretic effects,38 and Marangoni effects26,32 have been hypothesized to be the dominant mechanism, but the theories behind this interesting phenomenon are insufficient. Consequently, applying optothermally generated bubbles for particle manipulation usually relies on forces from external sources, such as acoustics30 or solid structures,26 rather than the bubble itself.
In this article, we conducted comprehensive studies on particle trapping and manipulation based on optothermally generated bubbles. Our studies involve a theoretical analysis, simulations, and experiments which reveal that the particle-trapping process is governed by a combined effect of drag, pressure, and surface tension forces. When particles are introduced into a flow field around an optothermally generated bubble, the particles are first driven towards the bubble surface by the heat-induced convective flow. The particles are then trapped on the bubble’s surface by a balance of a surface tension force and a pressure force. Our proposed mechanism has been confirmed by computational fluid dynamics (CFD) simulations, theoretical calculations, and experiments.
Based on our understanding of this mechanism, we further demonstrated a novel particle-manipulation technique, in which particles are carried by an optothermally generated bubble without the use of any external forces. Our technique has excellent control over the particle trajectory: the position of the bubble and the attached particles can be precisely controlled by moving the laser spot along a prescribed route. Our particle-manipulation approach uses a combination of both long-range forces (the drag force arising from the convective flow) and short-range forces (surface tension and pressure forces) to trap and manipulate particles. This combination of forces enables attracting particles that are located both near and far away from the bubble and manipulation to any predefined location. This technique has excellent versatility. It can be used to manipulate either single particles or clusters of particles at the same time. The experimental setup does not require a high-powered laser, a complicated optical setup, or an objective with a high numerical aperture, which is typically required in an optical tweezers setup. Our system is easy to design and operate. With its advantages in functionality, versatility, and simple device setup, we expect that this bubble-based particle manipulation technique can be valuable in many disciplines in science and engineering.57,58
Experiments
The optical setup is schematically shown in Fig. 1a. A continuous wave diode laser (405 nm wavelength, 200 mW power) passing through a variable neutral density filter (Filter 2) and a beam splitter was focused on the sample using an objective (10x, NA=0.3) in an upright microscope (Eclipse LV-100, Nikon). The focal spot on the sample had an area of about 1,200 μm2. The laser power was measured on the sample plane, and tunable from 0 to 45 mW using the variable neutral density filter (Filter 2 in Fig. 1a). The sample was illuminated from below with a white light source and finally imaged with the same objective and Lens 1 onto a CCD (DS-Fi1, Nikon). A notch filter (Filter 1) was placed before the CCD to reject the laser light reflected directly from the sample surface. In our experiment, the sample was a microfluidic chamber (Fig. 1b) formed by a wrapping-film spacer between two cover glasses. The resulting thickness of the chamber was 60–70 μm. The length and width of the chamber was approximately 2 cm. A 50 nm thin-film layer of gold was evaporated on the top glass surface before assembling the chamber. Polystyrene (PS) beads (Polyscience Inc.) with a diameter of 15 μm were used to demonstrate the particle-manipulation capability. The particles were suspended in deionized water and injected into the chamber before the experiment. A motorized stage (PRIOR, Model type C152V2) was used to automatically move the position of the laser spot on the sample for particle manipulation. The lateral resolution of the motorized stage is 1 μm. The laser was continuously kept on during the process of particle manipulation.
Fig. 1.

(a) Schematic of the optical setup to generate bubbles via the optothermal effect. (b) Illustration showing the particle manipulation process: particles are trapped onto the bubble’s surface; particle manipulation is achieved by moving the laser beam.
Simulations
In order to provide theoretical guidance for the optothermal bubble-based particle trapping and manipulation process, CFD simulations were conducted using the ANSYS Fluent software. The goal of the simulations was to reveal the temperature distribution, the convective flow pattern, and drag forces on the particles.
A two-dimensional (2D) model was applied to calculate the flow pattern in the chamber after a bubble was generated. To simplify the simulation, only the heat transfer and convective flow in the liquid domain were considered. The simulation domain we used was 1000 μm (width) × 70 μm (depth). A constant temperature of 80 °C was applied to the bubble-liquid interface as shown in Fig. 2c. The top and bottom surfaces were set as free convective boundaries with a room temperature of 27 °C with a conductivity h = 10 W/(m2·K). The temperatures on other surfaces far away from the bubble were also set to room temperature. The variations in water density and viscosity with temperature were accounted for in the model.
Fig. 2.
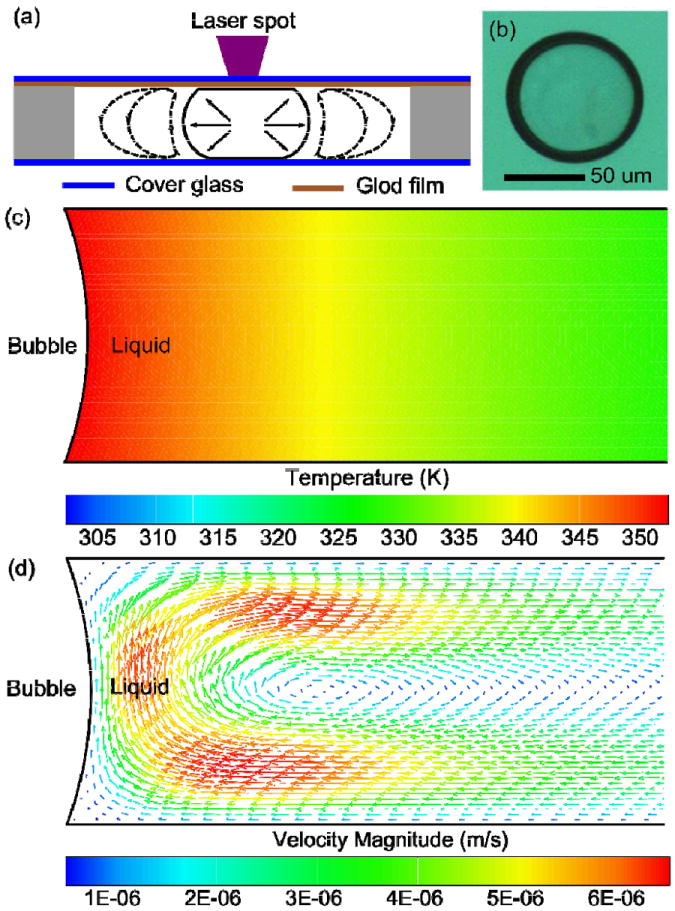
(a) Schematic of the bubble-generation process; (b) Microscope image of a bubble generated by the optothermal effect. (c) Simulation result for the temperature distribution around an optothermally generated bubble. (d) Simulation result for the convective flow pattern around an optothermally generated bubble.
Another 2D model was applied to study the drag force on particles due to the convective flow. In this simulation, a sphere with a diameter of 15 μm was included in the 2D flow field model, representing the microparticle. Several different distances from the particle to the bubble were used to calculate the drag force on the particle. The other simulation parameters were the same as in the simulation of the convective flow pattern.
A three-dimensional (3D) model was applied to more accurately simulate the asymmetric temperature distribution on the bubble’s surface when the laser spot moved away from the bubble’s center. The dimensions of the simulation domain were 1000 μm (length) × 1000 μm (width) × 70 μm (depth). The radius of the surface bubble was 60 μm. In order to simulate the scenario when the laser was moved away from the bubble’s center, a non-uniform temperature profile was imposed on the spherical bubble-liquid interface as the boundary condition. The area with the highest temperature, located at the surface of the gold film (where the laser spot was focused), was set to 100 °C. The temperature decreased both along the radial and axial directions from the hottest region to the coolest region on the bubble-liquid interface. The other boundary conditions and material properties were the same as used in the 2D model.
Results and discussion
Convective flow around a bubble
When the diode laser was focused onto the gold-liquid interface (Fig. 2a), the gold film at the laser focal spot was quickly heated up due to effective absorption of the laser energy. When the temperature of the water near the laser focal spot reached its boiling point, a vapor micro-bubble formed on top of the gold film (Fig. 2b). The change in the bubble’s size with respect to the laser power and time is described in the Supplementary Information (Fig. S1). Unlike the bubbles suspended in a liquid medium,59-61 the optothermally generated bubble remained in contact with the gold film, resulting in a hemisphere-shaped bubble sitting on the surface of the gold film. This surface bubble was not influenced by the surrounding fluid flow, and as a result, it was convenient to control both its position and size.
Once the bubble was generated, a temperature gradient and convective flow were formed around the bubble. The simulation result of the temperature distribution around an optothermally generated bubble is shown in Fig. 2c. The temperature decreased along the radial direction because of convective cooling along the top and bottom surfaces. The corresponding convective flow caused by this temperature gradient is shown in Fig. 2d. The flow formed a clockwise flow pattern near the bubble-liquid interface due to the density difference in water with respect to temperature. Water flowed toward the bubble near the bottom surface of the chamber, moved upward to the top surface (the surface with the gold-coated layer), and finally flowed away. This convective flow played an important role in attracting particles, which was an important step in the particle manipulation process.
Attracting particles to the bubble
Once a particle was introduced in the flow field, it was attracted towards the bubble surface (Fig. 3a-b). A particle, at distances up to 500 μm away from the bubble, could be attracted to the bubble, and the particle moved towards the bubble with a velocity approaching 90 μm/s. In addition, the top surface of the chamber (i.e., the surface with the gold-coated layer) was in the focal plane of the imaging system during the experiment. On the other side, the particle was out-of-focus as it approached the bubble, as shown in Fig. 3a-b, which indicated that the particle was dragged towards the bubble along the bottom surface.
Fig. 3.
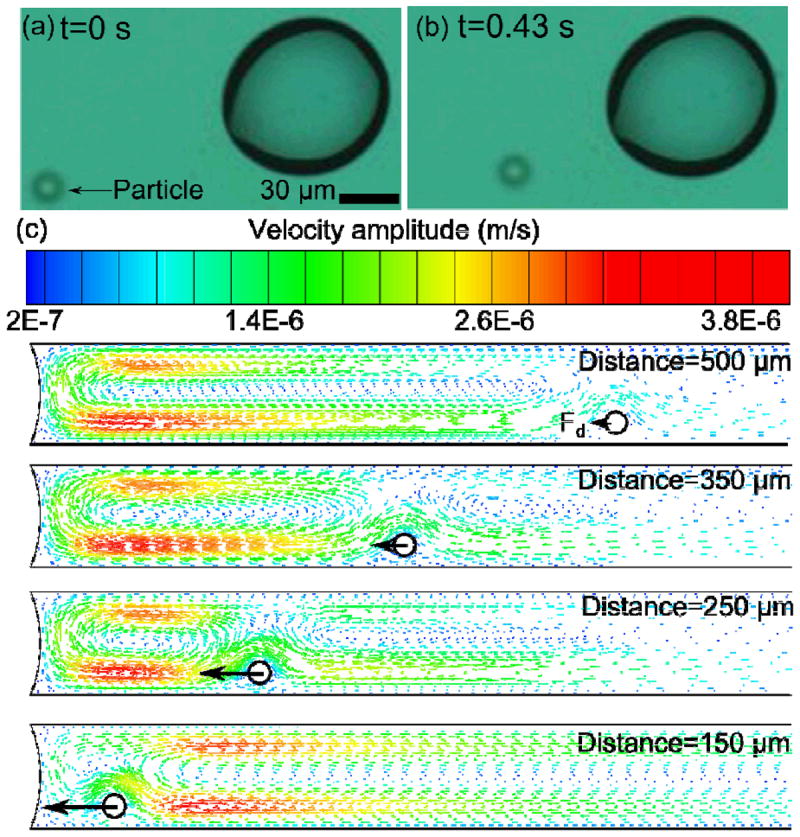
(a, b) Experimental results show that the particle is attracted to the bubble. (c) Simulation results show that the particle is attracted to the bubble due to the drag force.
The process of particles being attracted to the bubble could be explained by using a CFD simulation (Fig. 3c). To calculate the drag force on a particle, a circle with a diameter of 15 μm was used to represent the particle in 2D. The particle was placed near the bottom surface of the chamber at different distances (150–500 μm) from the bubble. Fig. 3c shows that the particle experienced a horizontal drag force with its direction pointing towards the bubble (the black arrow). This force dragged the particle towards the bubble, and its magnitude increased as the particle moved closer to the bubble. In the simulation, if the particle was near the top surface, it experienced a drag force (Fig. S4, Supplemental Information) which finally pushed the particle to the bottom of the chamber and the particle was recaptured by the convective flow at the bottom surface. The simulation also showed the convective flow can exert a force on the particle at a relatively far distance from the bubble (about 500 μm), which matched the experimental results and indicated that the drag force was a long-range force. The discrepancy between the velocity in the simulation results (~10 μm/s) and from experimental measurement (~90 μm/s) was probably because our computational model did not consider the complex two-phase gas-liquid system. Thus the simulated convection at the bubble-liquid interface was not exactly the same as that in the experiment. Overall, the simulation explained the process by which the particle was attracted towards the bubble by the convective flow.
Trapping particles on the bubble
After the particle approached the bubble, it attached to the bubble’s surface (Fig. 4a). Furthermore, by focusing the microscope on the top surface of the chamber, we found that the particle was also in-focus. This is different from the particle-attracting process where the particle was out of focus. This indicated that the particle was trapped near the top surface although it approached the bubble along the bottom surface. The trapping mechanism cannot be simply explained by the convective flow since the circulating convective flow formed around the bubble would finally push the particle away at the top surface, if no other forces were present in this process. This would directly contradict the experimental observations.
Fig. 4.
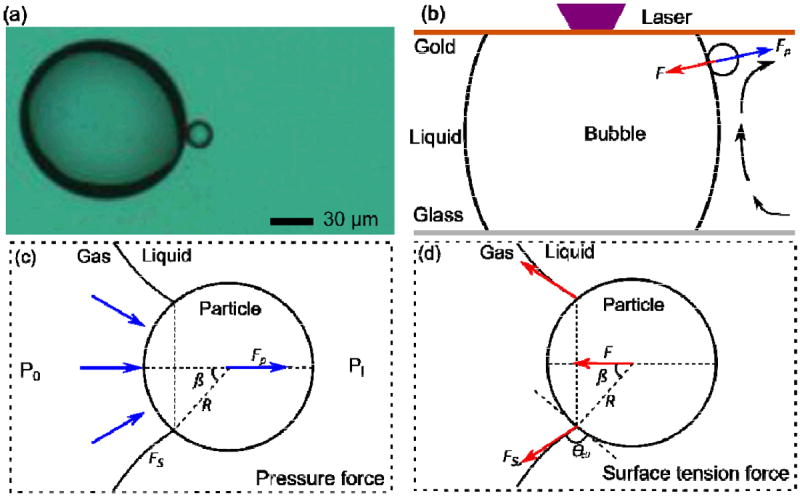
(a) A particle is trapped on a bubble near the top surface of the chamber; (b) The surface tension force and the pressure force balance in the radial direction of the bubble which stabilizes the particle on the bubble; (c) A diagram defining the pressure force when the particle attaches to the bubble’s surface; (d) A diagram of the surface tension force when the particle attaches to the bubble’s surface.
We believe that there are other forces, namely surface tension and pressure forces, which play an important role in this process. The balance of these forces along the radial direction of the bubble was the reason why particles were trapped on the bubble’s surface, as shown in Fig. 4b. When a particle was located at the bubble-liquid interface, the following forces have components along the radial direction: surface tension force (F), pressure force (Fp), and drag force (Fd). The balance of these forces can be described with the following equation:
| (1) |
When the particle was located at the bubble-liquid interface, the pressure difference (ΔP) between the gas (Po) and liquid (Pi) is: 62
| (2) |
where γ is the surface tension and RB is the radius of the bubble at the cross section. The resulting pressure difference exerted a pressure force (Fp) on the particle. Using the notations shown in Fig. 4c, the pressure force can then be described as:
| (3) |
where β is the half central angle, and R is the radius of the particle. In addition, once the particle came in contact with the bubble-liquid interface, a meniscus was formed around the particle; thus, a surface tension force was induced against the pressure force. A cross-sectional diagram of the surface tension force acting on a bubble-liquid-solid interface is shown in Fig. 4d. The surface tension force (Fs) is tangential to the bubble’s surface at the contact point and points towards the inside of the bubble. The components of Fs tangential to the cross section of the bubble-liquid-solid interface are cancelled out because of the symmetric circular shape. This results in a net force F pointing towards the inside of the bubble as shown in Fig. 4d. By using the notations shown in Fig. 4d, Fs can be described as:
| (4) |
And F is estimated as:
| (5) |
where θc0 is the contact angle among the particle and the liquid-gas interface.
Comparing the order of F and Fp can provide more information about the force balance on the particle:
| (6) |
Eqn. 6 demonstrates that the ratio between F and Fp is highly dependent on the wettability of the particles. In the experiment, R, RB, and β were estimated to be 7.5 μm, 40 μm, and 10°–20°. This estimation is reasonable based on the results shown in Fig. 4a, where only a small portion of the particle was attached to the bubble. To keep F and Fp on the same order of magnitude, the calculated θc0 was 30°–40°, which is in the experiment. Under this condition, both forces are on the order of 10-8 N.
The drag force due to the convective flow can also be calculated using Stokes’ law:
| (7) |
where η is the viscosity of medium, and ν is the relative velocity between the particle and the fluid. The upper limit of ν is the velocity of the flow, which was less than 100 μm/s. The calculated upper limit of the drag force was about 10-10 N in a vector direction away from the bubble.
The above analysis on pressure, surface tension, and drag forces reveals the following properties of a particle trapped by an optothermal bubble:
since the surface tension force dominates over the drag force, the wettability between particles and liquids is critical for optothermal bubble-based particle trapping. This is consistent with previous observations that when a surfactant was added to the liquid, the surface tension coefficient between the particle and the liquid changed, so that particles were not effectively trapped at the bubble’s surface.32
The calculated drag force is significantly smaller than the pressure force and surface tension force, indicating the balance between the latter two is the main reason particles remain attached to the bubble. However, if the drag force drastically increases; it will become important and break the force balance between the surface tension and pressure force. This happens when the bubble moves at a high speed (greater than 500 μm/s, as shown in Fig. S3, Supplementary Information). Above this speed, the particle was pulled off the bubble by the drag force, indicating that the drag force had increased enough to break the force balance.
The force analysis described here is similar to other process such as when using an atomic force microscope to press a particle into a gas-liquid interface where a net detachment force arising from surface tension and the pressure force can be calculated.63,64 In Pickering emulsions, where particles are trapped at an oil-aqueous interface, the system is theoretically described from the surface energy point of view.65
Other effects, such as optical trapping, the thermophoretic effect, buoyancy and gravity do not play a major role in this process. The optical trapping effect has been excluded by performing a control experiment (Fig. S5, Supplementary Information). The thermophoretic effect can be excluded because it would drive particles towards the region with a lower temperature which is away from the bubble. This is contrary to our experimental results. Buoyancy and gravitational forces do not dominate in this process because their directions are perpendicular to the direction of the particle motion.
In summary, the particle trapping process is explained based on the above theoretical analysis and experimental results. The convective flow brings the particle towards the bubble, when initially separated by large distances, along the bottom of the chamber. Once the particle is brought into contact with the bubble, the convective flow pushes the particle upwards to the top surface of the chamber. At this point, the surface tension and pressure force dominate and the balance between these two forces traps the particle tightly against the bubble surface and prevents the convective flow from pulling the particle away. As a result, the particle is trapped on the bubble surface near the top surface of the chamber, as observed in the experiment.
Controlling the particle’s position on the bubble
The position of the particle on the optothermal bubble can be controlled by moving the laser-focusing spot within the bubble. When the laser spot is located at the center of the bubble, the convective flow is symmetric about the bubble (Fig. 2a), causing an equal probability of trapping a particle at every position on the bubble. However, if the laser spot moves to the boundary of the surface bubble, the convective flow becomes asymmetric. The temperature profile (Fig. 5a) and convective flow pattern (Fig. 5b) were calculated by using a 3D CFD model, in which a heat source was placed near one boundary of the bubble. It shows that the convective flow was directed to a region where the temperature was highest, which corresponds to the location of the laser spot. Therefore, particles attached to the bubble will follow the flow direction and be attracted to the region with the highest temperature.
Fig. 5.
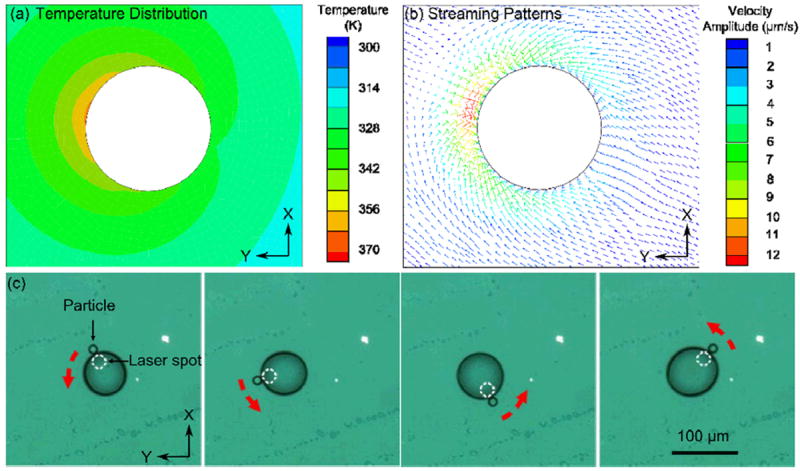
(a) Simulation results showing the asymmetrical temperature distribution in the fluid around the bubble when the laser is not focused at the center of the bubble. (b) A convective stream forms around the bubble due to the asymmetric temperature distribution. The direction of the convective flow is toward the hottest area. (c) A microparticle was pushed to the laser focusing spot due to streaming. When the laser spot moves, the particle follows the motion and attaches to the bubble’s surface.
This phenomenon was verified by our experiment (Fig. 5c). In the experiment, after trapping one particle on the bubble, the position of the laser spot (white dashed circle in Fig. 5c) was changed by a motorized stage. The stage was programmed to move the laser spot along the inner boundary of the bubble (red dashed arrow indicates the rotation motion). Fig. 5c shows that a particle is trapped at the region with the highest temperature on the surface bubble where the laser spot is located, and follows the trajectory of the laser spot. It should be noted that this method is not limited to the manipulation of a single particle; multiple particles can also be simultaneously manipulated on the bubble’s surface. In our experiment, two particles can also be manipulated separately depending on the position of the laser spot (Fig. S2, Supplementary Information). This method can be conveniently extended to multiple-particle manipulation.
Collecting multiple particles and manipulating single particles along an arbitrary trajectory
To demonstrate the particle manipulation capability using the optothermal bubble-based particle trapping mechanism, we demonstrated two applications here: (1) the collection of randomly distributed particles, and (2) manipulation of a single particle along a well-defined trajectory. The particle-collection results are shown in Fig. 6a–f. The white dashed circle represents the laser spot and the red dashed arrow indicates the direction of the laser movement. The bubble closely followed the laser spot and moved in a well-controlled manner.
Fig. 6.
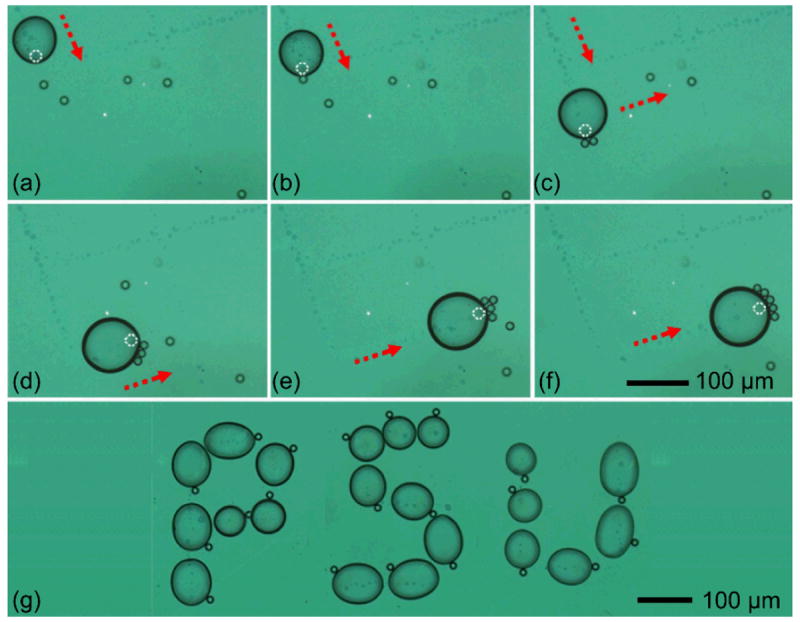
(a)–(f) Collecting randomly distributed polystyrene particles; (g) Single particle manipulation following three trajectories to trace the letters “P”, “S”, and “U,” from left to right.
When the laser spot moved in front of the bubble, a convective stream formed around the bubble due to the asymmetric temperature distribution, as shown in Fig. 5b. This resulted in a net force directed towards the front bubble. surface (in the direction of the laser movement).
The final bubble movement depended on the relative magnitude of this thermally-generated force and the interfacial forces between the bubble and gold surface. If the laser-induced asymmetric thermal force was smaller than the interfacial forces, the bubble remained stationary, such as in the case shown in Fig. 5c. This was the case when the laser spot remained inside of the bubble. If the laser spot moved further out in front of the bubble surface, as the case shown in Fig. 6a-f, the water at the laser spot was quickly heated and evaporated. Then, this thermally-induced force exceeded the interfacial forces and this pushed the bubble forwards. The net effect was that the bubble appeared to follow the laser spot. Besides the bubble’s motion, the particles (polystyrene, 15 μm diameter) located along the bubble’s trajectory became trapped on the bubble’s surface, following the mechanism described above. In addition, the trapped particles were carried in front of the surface bubble along the direction of motion. This observation further confirmed that particles will be trapped near the location of the focused laser, where the temperature was the highest. After the particles were delivered to a desired position, they could be unloaded by turning off the laser and allowing the bubble to shrink until it finally disappeared.
To illustrate the ability of single particle manipulation with this technique, three letters “P”, “S”, and “U” were written with three surface bubbles, respectively. Fig. 6g shows a time-lapsed, composite image of a bubble following the trajectory of each letter. The maximum velocity of the particle was ~500 μm/s. Above this threshold, the particle was dragged away from the bubble. As discussed in the particle-trapping section, this is because the increased drag force breaks the balance between the surface tension and the thermally-induced force. In addition, our technique can effectively manipulate particles in a large working area up to the centimeter scale.
Conclusion
In conclusion, through a theoretical analysis, numerical simulations, and experiments, we have revealed the mechanism behind the manipulation of a particle via an optothermal bubble. In addition, we developed a novel particle-manipulation technique based on this mechanism. After generating a bubble with a low-power diode laser, microparticles were attracted to the bubble’s surface from relatively long distances away due to the convective flow. Once entrained by the flow, the particles were trapped on the bubble surface and were carried along with the hemispherical bubble to any desired location, as the result of a balance between surface tension and pressure forces. This approach to particle manipulation was demonstrated with two examples: by collecting randomly distributed microparticles and by moving single particles along a prescribed trajectory. Due to the effectiveness and simplicity of this particle-manipulation technique, it could be valuable in many applications where high-precision particle manipulation is needed.
Supplementary Material
Acknowledgments
This research was supported by the National Institutes of Health (Director’s New Innovator Award, 1DP2OD007209-01), the National Science Foundation, and the Penn State Center for Nanoscale Science (MRSEC) under grant DMR-0820404. Components of this work were conducted at the Penn State node of the NSF-funded National Nanotechnology Infrastructure Network.
Footnotes
Electronic Supplementary Information (ESI) available.
References
- 1.Hashmi A, Yu G, Reilly-Collette M, Heiman G, Xu J. Lab Chip. 2012;12:4216–4227. doi: 10.1039/c2lc40424a. [DOI] [PubMed] [Google Scholar]
- 2.Prosperetti A. Phys Fluids. 2004;16:1852–1865. [Google Scholar]
- 3.Zwaan E, Gac SL, Tsuji K, Ohl CD. Phys Rev Lett. 2007;98:254501. doi: 10.1103/PhysRevLett.98.254501. [DOI] [PubMed] [Google Scholar]
- 4.Günther A, Jensen KF. Lab Chip. 2006;6:1487–1503. doi: 10.1039/b609851g. [DOI] [PubMed] [Google Scholar]
- 5.Marmottant P, Raven JP, Gardeniers H, Bomer JG, Hilgenfeldt S. J Fluid Mech. 2006;568:109–118. [Google Scholar]
- 6.Zhao Y, Cho SK. Lab Chip. 2007;7:273–280. doi: 10.1039/b616845k. [DOI] [PubMed] [Google Scholar]
- 7.Zhang K, Jian A, Zhang X, Wang Y, Li Z, Tam H. Lab Chip. 2011;11:1389. doi: 10.1039/c0lc00520g. [DOI] [PubMed] [Google Scholar]
- 8.Ryu K, Chung SK, Cho SK. J Assoc Lab Autom. 2010;15:163–171. [Google Scholar]
- 9.Tovar AR, Patel MV, Lee AP. Microfluid Nanofluid. 2011;10:1269–1278. [Google Scholar]
- 10.Tovar AR, Lee AP. Lab Chip. 2009;9:41–43. doi: 10.1039/b812435c. [DOI] [PubMed] [Google Scholar]
- 11.Ahmed D, Mao XL, Shi JJ, Juluri BK, Huang TJ. Lab Chip. 2009;9:2738–2741. doi: 10.1039/b903687c. [DOI] [PubMed] [Google Scholar]
- 12.Ahmed D, Mao XL, Juluri BK, Huang TJ. Microfluid Nanofluid. 2009;7:727–731. [Google Scholar]
- 13.Xie Y, Ahmed D, Lapsley M, Lin SCS, Nawaz AA, Wang L, Huang TJ. Anal Chem. 2012;84:7495–7501. doi: 10.1021/ac301590y. [DOI] [PMC free article] [PubMed] [Google Scholar]
- 14.Mao X, Juluri BK, Lapsley MI, Stratton ZS, Huang TJ. Microfluid Nanofluid. 2010;8(1):139–144. [Google Scholar]
- 15.Ahmed D, Chan CY, Lin SSC, Muddana HS, Nama N, Benkovic SJ, Huang TJ. Lab Chip. 2013;13:328–331. doi: 10.1039/c2lc40923b. [DOI] [PMC free article] [PubMed] [Google Scholar]
- 16.Marmottant P, Hilgenfeldt S. Proc Natl Acad Sci USA. 2004;101:9523–9527. doi: 10.1073/pnas.0307007101. [DOI] [PMC free article] [PubMed] [Google Scholar]
- 17.Marmottant P, Hilgenfeldt S. Nature. 2003;423:153–156. doi: 10.1038/nature01613. [DOI] [PubMed] [Google Scholar]
- 18.Rogers P, Neild A. Lab Chip. 2011;11:3710–3715. doi: 10.1039/c1lc20459a. [DOI] [PubMed] [Google Scholar]
- 19.Xu Y, Hashmi A, Yu G, Lu X, Kwon H-J, Chen XL, Xu J. Appl Phys Lett. 2013;102:023702. [Google Scholar]
- 20.Fujii S, Kobayashi K, Kanaizuka K, Okamoto T, Toyabe S, Muneyuki E, Haga M. Chem Lett. 2010;39:92–93. [Google Scholar]
- 21.Xie Y, Ahmed D, Lapsley MI, Lu M, Li S, Huang TJ. J Lab Autom. 2013 doi: 10.1177/2211068213485748. [DOI] [PubMed] [Google Scholar]
- 22.Marmottant P, Biben T, Hilgenfeldt S. Proc R Soc London, Ser A. 2008;464:1781–1800. [Google Scholar]
- 23.Peyman SA, Abou-Saleh RH, McLaughlan JR, Ingram N, Johnson BRG, Critchley K, Freear S, Evans JA, Markham AF, Coletta PL, Evans SD. Lab Chip. 2012;12:4544–4552. doi: 10.1039/c2lc40634a. [DOI] [PubMed] [Google Scholar]
- 24.Wang S, Dhanaliwala AH, Chen JL, Hossack JA. Biomicrofluidics. 2013;7:014103. doi: 10.1063/1.4774069. [DOI] [PMC free article] [PubMed] [Google Scholar]
- 25.Park JI, Nie Z, Kumachev A, Abdelrahman AI, Binks BP, Stone HA, Kumacheva E. Angew Chem Int Ed Engl. 2009;48(29):5300–5304. doi: 10.1002/anie.200805204. [DOI] [PubMed] [Google Scholar]
- 26.Hu W, Ishii KS, Fan Q, Ohta AT. Lab Chip. 2012;12:3821–3826. doi: 10.1039/c2lc40483d. [DOI] [PubMed] [Google Scholar]
- 27.Jiang L, Erickson D. Langmuir. 2011;27:11259–11264. doi: 10.1021/la2019617. [DOI] [PubMed] [Google Scholar]
- 28.Wang C, Jalikop SV, Hilgenfeldt S. Appl Phys Lett. 2011;99:034101. [Google Scholar]
- 29.Zagolla V, Tremblay E, Moser C. Opt Express. 2012;20:A924–931. [PubMed] [Google Scholar]
- 30.Xie Y, Zhao C, Zhao Y, Li S, Rufo J, Yang S, Guo F, Huang TJ. Lab Chip. 2013;13:1772–1779. doi: 10.1039/c3lc00043e. [DOI] [PMC free article] [PubMed] [Google Scholar]
- 31.Uwada T, Fujii S, Sugiyama T, Usman A, Miura A, Masuhara H, Kanaizuka K, Haga M. ACS Appl Mater Interfaces. 2012;4:1158–1163. doi: 10.1021/am201799b. [DOI] [PubMed] [Google Scholar]
- 32.Fujii S, Kanaizuka K, Toyabe S, Kobayashi K, Muneyuki E, Haga M. Langmuir. 2011;27:8605–8610. doi: 10.1021/la201616s. [DOI] [PubMed] [Google Scholar]
- 33.Hu W, Ishii KS, Ohta AT. Appl Phys Lett. 2011;99:094103. [Google Scholar]
- 34.Zhao C, Liu Y, Zhao Y, Fang N, Huang TJ. Nat Comm. 2013;4:2305. doi: 10.1038/ncomms3305. [DOI] [PMC free article] [PubMed] [Google Scholar]
- 35.Liu YJ, Hao Q, Smalley JST, Liou J, Khoo IC, Huang TJ. Appl Phys Lett. 2010;97:091101. [Google Scholar]
- 36.Zheng YB, Huang TJ, Desai AY, Wang SJ, Tan LK, Gao H, Huan ACH. Appl Phys Lett. 2007;90:183117. [Google Scholar]
- 37.Zhang B, Zhao Y, Hao Q, Kiraly B, Khoo I, Chen S, Huang TJ. Optics Express. 2011;19(16):15221–15228. doi: 10.1364/OE.19.015221. [DOI] [PubMed] [Google Scholar]
- 38.Zheng Y, Liu H, Wang Y, Zhu C, Wang S, Cao J, Zhu S. Lab chip. 2011;11:3816–3820. doi: 10.1039/c1lc20478e. [DOI] [PubMed] [Google Scholar]
- 39.Nilsson J, Evander M, Hammarström B, Laurell T. Anal Chim Acta. 2009;649:141–157. doi: 10.1016/j.aca.2009.07.017. [DOI] [PubMed] [Google Scholar]
- 40.Jonás A, Zemánek P. Electrophoresis. 2008;29:4813–4851. doi: 10.1002/elps.200800484. [DOI] [PubMed] [Google Scholar]
- 41.Chiou PY, Ohta AT, Wu MC. Nature. 2005;436:370–372. doi: 10.1038/nature03831. [DOI] [PubMed] [Google Scholar]
- 42.Čižmár T, Šiler M, Šerý M, Zemánek P, Garcés-Chávez V, Dholakia K. Phys Rev B. 2006;74:035105. [Google Scholar]
- 43.Landenberger B, Höfemann H, Wadle S, Rohrbach A. Lab Chip. 2012;12:3177–3183. doi: 10.1039/c2lc21099a. [DOI] [PubMed] [Google Scholar]
- 44.Shi J, Mao X, Ahmed D, Colletti A, Huang TJ. Lab Chip. 2008;8:221–223. doi: 10.1039/b716321e. [DOI] [PubMed] [Google Scholar]
- 45.Ding X, Lin SCS, Lapsley MI, Li S, Guo X, Chan CYK, Chiang I, McCoy JP, Huang TJ. Lab Chip. 2012;12:4228–4231. doi: 10.1039/c2lc40751e. [DOI] [PMC free article] [PubMed] [Google Scholar]
- 46.Kim SB, Yoon SY, Sung HJ, Kim SS. Anal Chem. 2008;80:2628–2630. doi: 10.1021/ac8000918. [DOI] [PubMed] [Google Scholar]
- 47.Tang SKY, Derda R, Mazzeo AD, Whitesides GM. Adv Mater. 2011;23:2413–2418. doi: 10.1002/adma.201100067. [DOI] [PubMed] [Google Scholar]
- 48.Tang SKY, Derda R, Quan Q, Loncar M, Whitesides GM. Opt Express. 2011;19:2204–2215. doi: 10.1364/OE.19.002204. [DOI] [PubMed] [Google Scholar]
- 49.Ding X, Lin SCS, Kiraly B, Yue H, Li S, Shi J, Benkovic SJ, Huang TJ. Proc Nat Acad Sci USA. 2012;109:11105–11109. doi: 10.1073/pnas.1209288109. [DOI] [PMC free article] [PubMed] [Google Scholar]
- 50.Grier DG. Curr Opin Colloid Interface Sci. 1997;2:264–270. [Google Scholar]
- 51.Misawa H, Kitamura N, Masuhara H. J Am Chem Soc. 1991;113:7859–7863. [Google Scholar]
- 52.Wang MD, Yin H, Landick R, Gelles J, Block SM. Biophys J. 1997;72:1335–1346. doi: 10.1016/S0006-3495(97)78780-0. [DOI] [PMC free article] [PubMed] [Google Scholar]
- 53.Zhao Y, Stratton ZS, Guo F, Lapsley MI, Chan CY, Lin SCS, Huang TJ. Lab Chip. 2013;13:17–24. doi: 10.1039/c2lc90127g. [DOI] [PMC free article] [PubMed] [Google Scholar]
- 54.Mao X, Huang TJ. Lab Chip. 2012;12:4006–4009. doi: 10.1039/c2lc90100e. [DOI] [PMC free article] [PubMed] [Google Scholar]
- 55.Liao GB, Bareil PB, Sheng Y, Chiou A. Opt Express. 2008;16:1996–2004. doi: 10.1364/oe.16.001996. [DOI] [PubMed] [Google Scholar]
- 56.Hsu H, Ohta AT, Chiou P-Y, Jamshidi A, Neale SL, Wu MC. Lab Chip. 2010;10:165–172. doi: 10.1039/b906593h. [DOI] [PubMed] [Google Scholar]
- 57.Neuzil P, Giselbrecht S, Laenge K, Huang TJ, Manz A. Nat Rev Drug Discov. 2012;11(8):620–632. doi: 10.1038/nrd3799. [DOI] [PMC free article] [PubMed] [Google Scholar]
- 58.Mao X, Huang TH. Lab Chip. 2012;12:1412–1416. doi: 10.1039/c2lc90022j. [DOI] [PMC free article] [PubMed] [Google Scholar]
- 59.Garstecki P, Fuerstman MJ, Stone HA, Whitesides GM. Lab Chip. 2006;6:437–446. doi: 10.1039/b510841a. [DOI] [PubMed] [Google Scholar]
- 60.Talu E, Hettiarachchi K, Powell RL, Lee AP, Dayton PA, Longo ML. Langmuir. 2008;24:1745–1749. doi: 10.1021/la703065v. [DOI] [PMC free article] [PubMed] [Google Scholar]
- 61.Prakash M, Gershenfeld N. Science. 2007;315:832–835. doi: 10.1126/science.1136907. [DOI] [PubMed] [Google Scholar]
- 62.Adamson AW, Alice GP. Physical Chemistry of Surfaces. 6. Wiley Interscience; 1997. [Google Scholar]
- 63.Shang J, Flury M, Deng Y. Water Resour Res. 2009;45:W06420. [Google Scholar]
- 64.Ally J, Kappl M, Butt H, Amirfazli A. Langmuir. 2010;26(23):18135–18143. doi: 10.1021/la103242e. [DOI] [PubMed] [Google Scholar]
- 65.Levine S, Bowen BD, Partridge SJ. Colloids Surfaces. 1989;38:325–343. [Google Scholar]
Associated Data
This section collects any data citations, data availability statements, or supplementary materials included in this article.