

Abstract
We have developed a planar, optofluidic Mach–Zehnder interferometer for the label-free detection of liquid samples. In contrast to most on-chip interferometers which require complex fabrication, our design was realized via a simple, single-layer soft lithography fabrication process. In addition, a single-wavelength laser source and a silicon photodetector were the only optical equipment used for data collection. The device was calibrated using published data for the refractive index of calcium chloride (CaCl2) in solution, and the biosensing capabilities of the device were tested by detecting bovine serum albumin (BSA). Our design enables a refractometer with a low limit of detection (1.24 × 10⁻⁴ refractive index units (RIU)), low variability (1 × 10⁻⁴ RIU), and high sensitivity (927.88 oscillations per RIU). This performance is comparable to state-of-the-art optofluidic refractometers that involve complex fabrication processes and/or expensive, bulky optics. The advantages of our device (i.e. simple fabrication process, straightforward optical equipment, low cost, and high detection sensitivity) make it a promising candidate for future mass-producible, inexpensive, highly sensitive, label-free optical detection systems.
Introduction
In the past few decades, a significant effort has been put forth to develop optical detection systems for biochemical and biological analysis.1–5 To date, the most commonly used transduction signals in optical detection are fluorescence and refractive index.6 Fluorescence-based optical detection methods offer high sensitivity; however, they require labeling processes that are not only tedious and inconvenient but can also disrupt the kinetics of chemical reactions. On the other hand, refractive index-based methods (refractometry) provide powerful, label-free detection without altering the analytes from their natural forms.7,8 Thus far, many refractometers have been developed utilizing mechanisms such as long-period gratings (LPGs),8–10 fiber Bragg gratings,11,12 interference,13,14 and optical waveguides.15–18
Optofluidics, the merger of optics and microfluidics, appears to be an ideal platform for realizing fully integrated refractometers. Recent work in the field of optofluidics has produced unique fluid-related optical systems, such as a liquid director,19 lenses,20–24 waveguides,25–31 attenuators,32,33 gratings,34,35 photonic crystals,36 and sensors.37–49 Microfluidic networks allow liquid samples to be processed via on-chip pumping, mixing, separation, etc., while conveniently delivering liquid samples to the refractometer. To date, optofluidic techniques have been employed to produce compact refractometers using diffraction gratings,50,51 prisms,52 and interferometers.53–55 These designs enable highly sensitive and compact microfluidic refractometers. Unfortunately, most of these devices involve complex fabrication processes and/or expensive, bulky optics. Ideally, fully integrated, sensitive refractometers would be fabricated using simple and inexpensive fabrication techniques. Furthermore, simple optical systems should be implemented to facilitate the integration of compact optical elements with microfluidic components.
In this work, we introduce a simple design for an on-chip, label-free, optofluidic Mach–Zehnder interferometer. Our design achieves good performance and is easy to implement. The high sensitivity inherent to optical interferometry has allowed our device to achieve a low limit of detection (1.24 × 10⁻⁴ RIU), low variation (1 × 10⁻⁴ RIU), and high sensitivity (927.88 oscillations per RIU). To promote low-cost production and to facilitate integration with other lab-on-a-chip systems, our device consists of a simple, single-layer polydimethylsiloxane (PDMS) micro-channel system that was fabricated with the commonly used soft lithography process. Standard optical equipment, such as a single-wavelength laser source and a silicon photodetector, was utilized to promote integration with miniaturized optics and further facilitate the compact integration of this system. Opto-fluidic devices of this kind could lead to fully integrated, sensitive, label-free, optical detection in inexpensive, mass-producible lab-on-a-chip systems.
Methods
Device fabrication
A schematic of our device, including both microfluidic and optical components, is given in Fig. 1. A single-layer microfluidic device with a height of 159 μm was fabricated with PDMS via standard soft-lithography.56 The microfluidic system consisted of two fluid inputs, a passive micro-mixer, a microchannel, and a fluid output. The two inlets allow the infusion of two different solutions via syringe pumps, referred to as Solution 1 and Solution 2 (Fig. 1a). A series of curves in the channel act as a passive micro-mixer to homogenize the liquid in the channel. The optical system included a laser beam with a 488 nm wavelength from an argon ion laser, two collimating micro-lenses, and two optical fibers. The fibers were multimode with 50 μm cores and a numerical aperture of 0.22. An experimental image of the device indicates the alignment of the optical fibers via fiber insertion channels fabricated during the soft-lithography process (Fig. 1b). Laser light was coupled to the input optical fiber which guided the light to the first PDMS micro-lens where it was collimated. The collimated light traveled through the device and was focused into the output optical fiber by the second micro-lens. A silicon photodetector captured the output intensity.
Fig. 1.

(a) Schematic of the device with arrows depicting the familiar light path of a Mach–Zehnder interferometer. (b) An experimental image of the device, post-insertion of optical fibers.
Working principle
The function of our Mach–Zehnder interferometer device can be described by the wave-interference theory.57 Half of the collimated beam traveled through the microfluidic channel while the other half traveled through PDMS; this arrangement split the initial beam, Iin, into two beams of equal intensity, I1 and I2. The two beams recombined in the output optical fiber, and any phase difference between them will cause interference in Iout as described by:
| (1) |
where Φ1 and Φ2 are the phases of I1 and I2 respectively. Since the optical path is short (d = 500 μm) and the optical absorption coefficients for water and PDMS at 488 nm are low,58,59 we assume that the intensity of I1 and I2 are equivalent and the sum of the two equals Iin (ESI†). Therefore, eqn (1) simplifies to:
| (2) |
The refractive index of the medium through which light travels has an impact on its phase velocity causing a change in its phase. Denoting the initial phase as zero, the phase of a wave after traveling through such a medium is described by:
| (3) |
where D is the thickness of the material, n is the refractive index of the material, and λ is the wavelength of the light. I2 travels through PDMS, the refractive index of which remains constant at room temperature, meaning Φ2 is constant. On the contrary, I1 travels through the microfluidic channel containing a liquid solution. Changes in the refractive index of the solution will alter Φ1 as described by:
| (4) |
where d is the interaction length depicted in Fig. 1 (500 μm for our device) and n1 is the refractive index of the fluid. The multimode fibers cause the interference to manifest as an interference pattern. This interference is accounted for by the Φmode term in eqn (2). Since the geometry of the waveguides remains constant, Φmode is a constant for a given position in the interference pattern.
Each of the phase terms impacts the output intensity. Given that Φ2 and Φmode are constants, any changes observed in the interference pattern indicate changes in Φ1 and, by extension, the refractive index of the solution in the channel. Therefore, changes in the refractive index of a solution in the channel can be monitored by recording data from a single point in the interference pattern. The interference pattern is projected from the output fiber and a pinhole is used to segregate a small region of the interference pattern for detection.
The output intensity recorded in our experiments will be dependent on the dynamics of how Solution 2 replaces Solution 1; however, the interference theory which describes this process is independent of time. In order to verify that our experimental oscillations are predicted by interference theory, these dynamics must be studied. A solution of ink was used to visualize and characterize this fluid-replacement process. For this experiment, DI water was used for Solution 1 and ink was used for Solution 2 to provide a visual marker to track the dynamics of fluid replacement during the experiment. Initially, the channel was filled with Solution 1 flowing at a rate of 5 μl min−1. The flow of Solution 1 was abruptly halted, and instantly the flow of Solution 2 was initiated at a rate of 5 μl min−1. A series of images of the device were captured during the replacement period, some of which are displayed as insets in Fig. 2. The brightness of the functional region of the device (indicated by dotted rectangles in Fig. 2) decreased as the channel was infused with Solution 2. Therefore, the brightness of the channel indicated the percentage of Solution 2 within the channel.
Fig. 2.

The dynamics of Solution 2 replacing Solution 1, using ink as a visible marker for characterization.
As observed in Fig. 2, Solution 1 was not abruptly replaced by Solution 2; rather, there was a period of transition caused by residual pressure on the Solution 1 inlet. The passive micro-mixer, shown in Fig. 1, maintained a homogeneous mixture of the two fluids throughout the transition period. During the transition, the percentage of Solution 2 within the channel gradually increased, eventually filling the entire channel with Solution 2 once the residual pressure in Solution 1 had receded. The dynamics of this transition period were visualized through a normalized, inverted plot of the intensity extracted from the images (Fig. 2).
Characterization
We characterized the detection properties of our interferometer using several solutions with known concentrations of calcium chloride (CaCl2). As our device measures a relative difference in refractive index, Solution 1 should have a known refractive index to serve as a reference for the derivation of the refractive index of Solution 2. In these experiments, Solution 1 was DI water and at 488 nm its refractive index is 1.3372672 (RIU) as derived by linear interpolation of published data.60 Solution 2 was a test solution of CaCl2, a commonly used fluid in optofluidic studies because its refractive index is directly related to its concentration.23,27 The overall dynamics of the water–CaCl2 test were similar to those described previously in the water–ink test. Therefore, as Solution 2 gradually replaces Solution 1, the refractive index of the fluid in the interferometer transitions fromn1 to n2.
The interference theory introduced earlier adequately explains the signals detected by our device during these tests. The relationship described by eqn (4) indicates that the gradual change in refractive index also changes Φ1. The cosine function in eqn (2) predicts that changes in the Φ1 (and by extension the refractive index) will cause cyclical oscillations of the intensity, Iout. The cosine function indicates that oscillations repeat at intervals of ΔΦ1 = 2πq (where q is an integer). Therefore, the number of oscillations of Iout was equivalent to ΔΦ1/2π. This parameter was recorded for analysis, as it can be numerically calculated and easily approximated via visual inspection of the data plot. The oscillations of Iout were recorded by monitoring a single point of the output interference pattern using a silicon photodetector that outputs a voltage signal.
Results and discussion
The voltage signal from a single experiment in which Solution 2 had a CaCl2 concentration of 100 mM is plotted as the solid curve in Fig. 3. The voltage signal experiences a cyclical oscillation as the water in the channel is replaced by the CaCl2 solution. The oscillatory nature of eqn (2) indicates that an intensity change from a minimum value to a maximum value corresponds to a phase shift of π. Based on this understanding, the oscillations were calculated by summing the absolute value of the normalized difference in the voltage of adjacent data points using:
| (5) |
where ΔΦ1(tk)/2π is the number of oscillations, V is the voltage of a data point, t is the time, k is the index for all of the data points in the series, and VPP is the peak-to-peak voltage of the data.
Fig. 3.

Voltage output from the optical detector during a single experiment analyzing a 100 mM solution of CaCl2 (solid line). Number of oscillations (ΔΦ1/2π) in the experimental data calculated over the duration of the experiment (dashed line).
A program was written in Matlab to calculate the number of oscillations of the solid curve in Fig. 3 based on eqn (5) and the result was plotted as the dashed curve in Fig. 3. This plot demonstrates the dynamics of the change in refractive index as Solution 2 replaces Solution 1. We observed by inspection that these dynamics match with those in the water–ink test in Fig. 2. The water–ink experiment, detailed in Fig. 2, was used to convert the time values in the experimental data to refractive index, in order to directly compare experimental data with theoretical values. Since the initial and final refractive index values were known (from eqn (4)) for a particular experimental case, the y-axis in Fig. 2 (Solution 2 %) was converted to refractive index (relating refractive index with time). Using this relationship, the time axis of the experimental data (Fig. 3) was converted to refractive index. Thus, the experimental data, sampled at every 10 data points, were directly compared with a plot of eqn (2) in Fig. 4. Satisfactory agreement was observed between the experimental and theoretical plots (Fig. 4), indicating that our experimental results were consistent with the expected theoretical trend. The slight discrepancies between the theory and experiment were mainly due to the difference in viscosity between the ink solution and the CaCl2 solution.
Fig. 4.

Comparison between the augmented experimental data and a plot of the theoretical equation.
Similar tests were conducted for solutions with 5, 10, 50, 100, 250, and 500 mM concentrations of CaCl2. Signals from the detection of each concentration were compiled on the same plot for comparison in Fig. 5. It is clearly observed that the number of oscillations in the signal increases with the concentration of CaCl2. At concentrations below 50 mM, less than half an oscillation was observed. In this range, the signal was still determined using eqn (5), though a reference VPP was needed. A reference VPP of 100 mV was used because this was the approximate value of VPP in all experiments using CaCl2 concentrations above 50 mM.
Fig. 5.
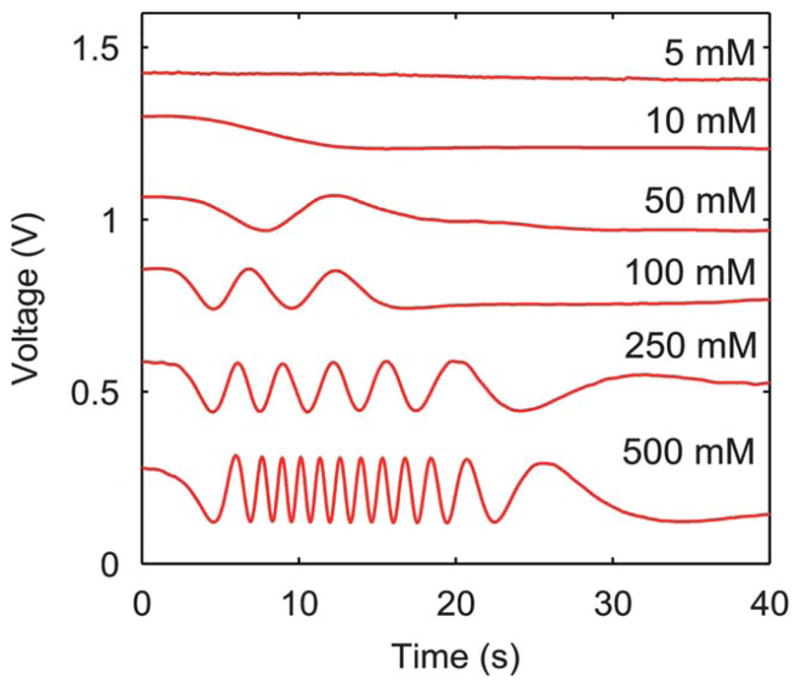
Comparison of signals acquired for solutions with various concentrations of CaCl2.
Each concentration was tested 5 times to develop a sample size which could be statistically analyzed. The results of these experiments were compiled into Fig. 6. The data points are the statistical mean for each concentration, with an interval of four standard deviations (4σ) represented by the error bars. Standard data for the refractive index of CaCl2 were used to calibrate the device.61 Using a linear fit of the published data, the concentration of CaCl2 was converted to refractive index. Therefore, the top independent axis displays the change in refractive index. A linear regression, as depicted in Fig. 6, was used to calibrate the number of oscillations derived from experiments to a change in refractive index. The slope of the calibration curve indicated that the sensitivity of the device was 927.88 oscillations per RIU. The sensitivity was dependent on the interaction length, d, of the device as described in eqn (6). Based on this relationship, it seems that the sensitivity could be continuously increased by lengthening d. The sensitivity would have a maximum limitation due to factors such as optical absorption and the development of a concentration gradient along the length of the channel (ESI†).
Fig. 6.
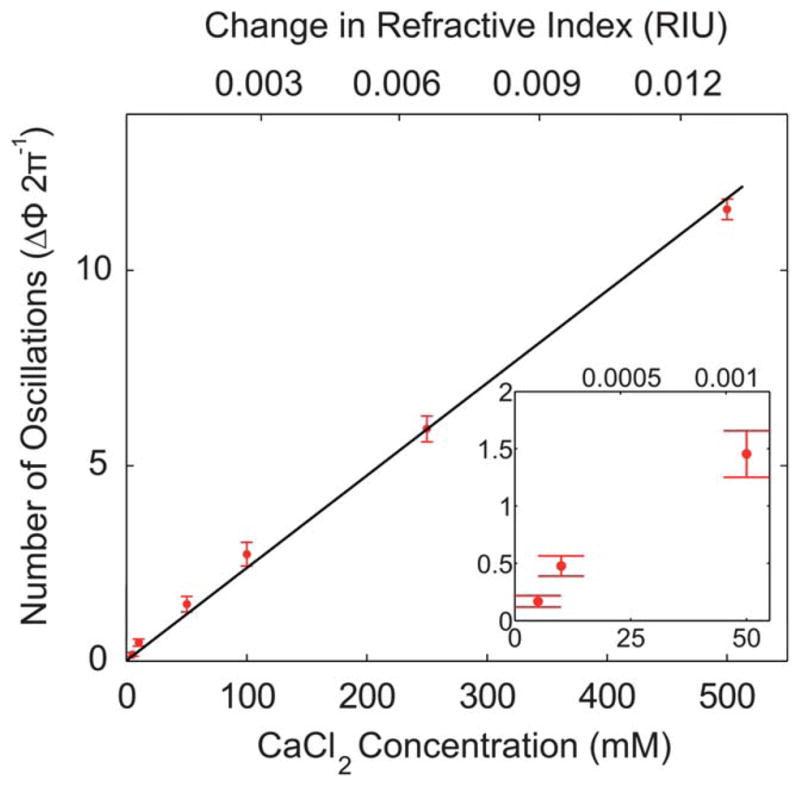
The number of oscillations for given concentrations of CaCl2 from experiments. The separation between horizontal bars indicates a spread of four standard deviations.
| (6) |
The effects of optical dispersion were considered as a possible source of inaccuracy in our device. Our device used a wavelength of 488 nm; however, the published data used for calibration reports refractive index at a wavelength of 589.29 nm. Once our data were calibrated with the standard data, it essentially reported refractive index values at a wavelength of 589.29 nm. Discrepancies due to dispersion would only emerge if the refractive index was directly calculated using eqn (4). Calibrations of this kind are typical for standardizing detectors.62
Limit of detection, limit of quantification, and data variability are standard criteria for expressing the quality of a detector.62 The limit of detection was determined by recording a baseline signal from the device with only water in the channel and analyzing the deviation of this baseline.62 The limit of detection and limit of quantification are defined as:
| (7) |
where Sb and σb are the mean and standard deviation of the baseline, respectively, and Kb is a coefficient of confidence. Kb is 3 for determining the limit of detection and 10 for limit of quantification. We calculated a limit of detection of 1.24 × 10⁻⁴ RIU (0.115 oscillations) and a limit of quantification of 4.14 × 10⁻⁴ RIU (0.385 oscillations). Additionally, the variability of the device was determined via calculation of the standard deviation (σ) of the experimental data and multiplying it by a coefficient of confidence (Kσ). At 5 mM, σ was 2.67 × 10⁻⁵ RIU (0.0248 oscillations) and using a coefficient of confidence of K = 4, the variability was determined to be 1 × 10⁻⁴ RIU (0.1 oscillations). This variability was of the same order of magnitude or better than existing optofluidic, interferometric refractometers that involve more complicated optics and fabrication processes.53–55
Once calibrated, the label-free sensing capabilities of the device were tested by detecting the protein Bovine Serum Albumin (BSA). DI water was used as the solvent for BSA and the reference solution for these experiments. Various concentrations of the protein were tested, and the results are displayed in Fig. 7. Again, error bars indicate the 4σ variation in the data. The variation was substantially higher for the protein test. This was attributed to the strong surfactant effects of the protein. These surfactant effects cause the protein to slowly deposit on the wall of the channel, altering the uniformity of the refractive index in the channel and the dynamics of the refractive index variation over time. Protein detection could be improved by coating the surface of the microchannel with a layer that would neutralize the surfactant effects of the protein. Despite the increased variation in the signal during detection of BSA, a linear trend was observed in the data indicating accurate detection of the various concentrations of protein.
Fig. 7.

Detection of BSA protein using our device. The separation between horizontal bars indicates a spread of four standard deviations.
While the simplicity of our device is desirable for lab-on-a-chip integration,2,6,63–70 it produces some limitations. Our device detects small changes in the refractive index, but it cannot distinguish between increases and decreases. This limits our device to detect only continuous changes. Another limitation deals with the detection volume of the device. Our device averages the refractive index of a volume of fluid, the majority of which is in the bulk flow of the fluid. This limitation makes our device unsuitable for applications, such as immunoassays, in which refractive index change on a surface is a major concern. Our device could be improved by decreasing the width of our light beam and increasing the interaction length. The use of multimode, rather than single mode, optical fibers is the final limitation of our device, as they complicate the data analysis process. With more development our device could implement single mode fibers which would further advance the compact integration of our system.
Conclusion
In conclusion, we have developed an on-chip, optofluidic interferometer for sensitive, label-free measurement of the refractive index of fluids. In contrast to most microfluidic interferometers that involve complex fabrication processes and/or expensive, bulky optical elements, our interferometer was a simple, single-layer PDMS device. It was fabricated through a standard soft-lithography process and thus can be conveniently integrated with other microfluidic components. Furthermore, the use of simple optical detection equipment makes it promising to further develop the current device into a fully integrated and highly compact system. The response of our device was well supported by the interference theory. The limit of detection and variation for the device were found to be 1.24 × 10⁻⁴ RIU and 1 × 10⁻⁴ RIU, respectively. The detection sensitivity was 927.88 oscillations per RIU. The label-free detection capabilities of the device were tested by detecting the refractive index of various concentrations of BSA. The performance of our device is comparable with state-of-the-art optofluidic refractometers which require more complex fabrication processes and equipment. We believe that with further optimization, our device can be valuable for many lab-on-a-chip systems that require cost-effective, sensitive, label-free detection mechanisms.
Acknowledgments
This research was supported by the NIH Director’s New Innovator Award (1DP2OD007209-01), the National Science Foundation (ECCS-0824183 and ECCS-0801922) and the Penn State Center for Nanoscale Science (MRSEC). Components of this work were conducted at the Penn State node of the NSF-funded National Nanotechnology Infrastructure Network (NNIN). The authors would like to thank Pamela Ade, Sz-Chin Steven Lin, Brian Kiraly, and Ahmad Ahsan Nawaz for their assistance in preparing the manuscript.
Footnotes
Electronic supplementary information (ESI) available.
References
- 1.Mairhofer J, Roppert K, Ertl P. Sensors. 2009;9:4804–4823. doi: 10.3390/s90604804. [DOI] [PMC free article] [PubMed] [Google Scholar]
- 2.Vilkner T, Janasek D, Manz A. Anal Chem. 2004;76:3373–3386. doi: 10.1021/ac040063q. [DOI] [PubMed] [Google Scholar]
- 3.Hunt H, Wilkinson J. Microfluid Nanofluid. 2008;4:53–79. doi: 10.1007/s10404-007-0223-y. [DOI] [PMC free article] [PubMed] [Google Scholar]
- 4.Psaltis D, Quake SR, Yang C. Nature. 2006;442:381–386. doi: 10.1038/nature05060. [DOI] [PubMed] [Google Scholar]
- 5.Monat C, Domachuk P, Eggleton BJ. Nat Photonics. 2007;1:106–114. [Google Scholar]
- 6.Dittrich PS, Manz A. Anal Bioanal Chem. 2005;382:1771–1782. doi: 10.1007/s00216-005-3335-9. [DOI] [PubMed] [Google Scholar]
- 7.Gauglitz G, Proll G. Strategies for Label-Free Optical Detection. 2008:395–432. doi: 10.1007/10_2007_076. [DOI] [PubMed] [Google Scholar]
- 8.Patrick H, Kersey A, Bucholtz F. J Lightwave Technol. 1998;16:1606–1612. [Google Scholar]
- 9.Ding J, Zhang A, Shao L, Yan J, He S. IEEE Photonics Technol Lett. 2005;17:1247–1249. [Google Scholar]
- 10.Falciai R, Mignani AG, Vannini A. Sens Actuators, B. 2001;74:74–77. [Google Scholar]
- 11.Chryssis A, Lee S, Lee S, Saini S, Dagenais M. IEEE Photonics Technol Lett. 2005;17:1253–1255. [Google Scholar]
- 12.Schroeder K, Ecke W, Mueller R, Willsch R, Andreev A. Meas Sci Technol. 2001;12:757. [Google Scholar]
- 13.Wang X, Cooper KL, Wang A, Xu J, Wang Z, Zhang Y, Tu Z. Appl Phys Lett. 2006;89:163901. [Google Scholar]
- 14.Wang Y, Cooper K, Wang A. J Lightwave Technol. 2008;26:3181–3185. [Google Scholar]
- 15.Dumais P, Callender C, Noad J, Ledderhof C. IEEE Sens J. 2008;8:457–464. [Google Scholar]
- 16.Hradetzky D, Mueller C, Reinecke H. J Opt A: Pure Appl Opt. 2006;8:S360–S364. [Google Scholar]
- 17.Schmitt K, Schirmer B, Hoffmann C, Brandenburg A, Meyrueis P. Biosens Bioelectron. 2007;22:2591–2597. doi: 10.1016/j.bios.2006.10.016. [DOI] [PubMed] [Google Scholar]
- 18.Sepulveda B, del Rio JS, Moreno M, Blanco FJ, Mayora K, Dominguez C, Lechuga LM. J Opt A: Pure Appl Opt. 2006;8:S561–S566. [Google Scholar]
- 19.Liu GL, Kim J, Lu Y, Lee LP. Nat Mater. 2006;5:27–32. doi: 10.1038/nmat1528. [DOI] [PubMed] [Google Scholar]
- 20.Tang SKY, Stan CA, Whitesides GM. Lab Chip. 2008;8:395–401. doi: 10.1039/b717037h. [DOI] [PubMed] [Google Scholar]
- 21.Shi J, Stratton Z, Lin SCS, Huang H, Huang T. Microfluid Nanofluid. 2010;9:313–318. [Google Scholar]
- 22.Mao X, Waldeisen JR, Juluri BK, Huang TJ. Lab Chip. 2007;7:1303–1308. doi: 10.1039/b708863a. [DOI] [PubMed] [Google Scholar]
- 23.Mao X, Lin SCS, Lapsley MI, Shi J, Juluri BK, Huang TJ. Lab Chip. 2009;9:2050–2058. doi: 10.1039/b822982a. [DOI] [PubMed] [Google Scholar]
- 24.Huang H, Mao X, Lin SCS, Kiraly B, Huang Y, Huang TJ. Lab Chip. 2010;10:2387–2393. doi: 10.1039/c005071g. [DOI] [PubMed] [Google Scholar]
- 25.Schmidt H, Hawkins A. Microfluid Nanofluid. 2008;4:3–16. doi: 10.1007/s10404-007-0199-7. [DOI] [PMC free article] [PubMed] [Google Scholar]
- 26.Hawkins A, Schmidt H. Microfluid Nanofluid. 2008;4:17–32. doi: 10.1007/s10404-007-0194-z. [DOI] [PMC free article] [PubMed] [Google Scholar]
- 27.Wolfe DB, Conroy RS, Garstecki P, Mayers BT, Fischbach MA, Paul KE, Prentiss M, Whitesides GM. Proc Natl Acad Sci U S A. 2004;101:12434–12438. doi: 10.1073/pnas.0404423101. [DOI] [PMC free article] [PubMed] [Google Scholar]
- 28.Vazquez RM, Osellame R, Nolli D, Dongre C, Vlekkert Hvd, Ramponi R, Pollnau M, Cerullo G. Lab Chip. 2009;9:91–96. doi: 10.1039/b808360f. [DOI] [PubMed] [Google Scholar]
- 29.Bellini N, Vishnubhatla KC, Bragheri F, Ferrara L, Minzioni P, Ramponi R, Cristiani I, Osellame R. Opt Express. 2010;18:4679–4688. doi: 10.1364/OE.18.004679. [DOI] [PubMed] [Google Scholar]
- 30.Vazquez RM, Osellame R, Cretich M, Chiari M, Dongre C, Hoekstra H, Pollnau M, van den Vlekkert H, Ramponi R, Cerullo G. Anal Bioanal Chem. 2009;393:1209–1216. doi: 10.1007/s00216-008-2399-8. [DOI] [PubMed] [Google Scholar]
- 31.Kee JS, Poenar DP, Neuzil P, Yobas L. Sens Actuators, B. 2008;134:532–538. [Google Scholar]
- 32.Domachuk P, Grillet C, Ta’eed V, Magi E, Bolger J, Eggleton BJ, Rodd LE, Cooper-White J. Appl Phys Lett. 2005;86:024103. doi: 10.1364/opex.12.005440. [DOI] [PubMed] [Google Scholar]
- 33.Lapsley MI, Lin SCS, Mao X, Huang TJ. Appl Phys Lett. 2009;95:083507. [Google Scholar]
- 34.Yu JQ, Yang Y, Liu AQ, Chin LK, Zhang XM. Opt Lett. 2010;35:1890–1892. doi: 10.1364/OL.35.001890. [DOI] [PubMed] [Google Scholar]
- 35.Chin LK, Liu AQ, Zhang JB, Lim CS, Soh YC. Appl Phys Lett. 2008;93:164107. [Google Scholar]
- 36.Erickson D, Rockwood T, Emery T, Scherer A, Psaltis D. Opt Lett. 2006;31:59–61. doi: 10.1364/ol.31.000059. [DOI] [PubMed] [Google Scholar]
- 37.Choi D, Kang T, Cho H, Choi Y, Lee LP. Lab Chip. 2009;9:239–243. doi: 10.1039/b812067f. [DOI] [PubMed] [Google Scholar]
- 38.Lau AY, Lee LP, Chan JW. Lab Chip. 2008;8:1116–1120. doi: 10.1039/b803598a. [DOI] [PubMed] [Google Scholar]
- 39.Liu KJ, Brock MV, Shih IM, Wang TH. J Am Chem Soc. 2010;132:5793–5798. doi: 10.1021/ja100342q. [DOI] [PMC free article] [PubMed] [Google Scholar]
- 40.Rane TD, Puleo CM, Liu KJ, Zhang Y, Lee AP, Wang TH. Lab Chip. 2010;10:161–164. doi: 10.1039/b917503b. [DOI] [PMC free article] [PubMed] [Google Scholar]
- 41.Li XC, Wu J, Liu AQ, Li ZG, Soew YC, Huang HJ, Xu K, Lin JT. Appl Phys Lett. 2008;93:193901. [Google Scholar]
- 42.Llobera A, Demming S, Wilke R, Buttgenbach S. Lab Chip. 2007;7:1560–1566. doi: 10.1039/b704454b. [DOI] [PubMed] [Google Scholar]
- 43.Llobera A, Cadarso VJ, Darder M, Dominguez C, Fernandez-Sanchez C. Lab Chip. 2008;8:1185–1190. doi: 10.1039/b801152d. [DOI] [PubMed] [Google Scholar]
- 44.Llobera A, Demming S, Joensson HN, Vila-Planas J, Andersson-Svahn H, Buttgenbach S. Lab Chip. 2010;10:1987–1992. doi: 10.1039/c003575k. [DOI] [PubMed] [Google Scholar]
- 45.Bliss CL, McMullin JN, Backhouse CJ. Lab Chip. 2008;8:143–151. doi: 10.1039/b711601b. [DOI] [PubMed] [Google Scholar]
- 46.Bliss CL, McMullin JN, Backhouse CJ. Lab Chip. 2007;7:1280–1287. doi: 10.1039/b708485d. [DOI] [PubMed] [Google Scholar]
- 47.Yin D, Lunt EJ, Rudenko MI, Deamer DW, Hawkins AR, Schmidt H. Lab Chip. 2007;7:1171–1175. doi: 10.1039/b708861b. [DOI] [PubMed] [Google Scholar]
- 48.Mandal S, Erickson D. Opt Express. 2008;16:1623–1631. doi: 10.1364/oe.16.001623. [DOI] [PMC free article] [PubMed] [Google Scholar]
- 49.Mandal S, Goddard JM, Erickson D. Lab Chip. 2009;9:2924–2932. doi: 10.1039/b907826f. [DOI] [PubMed] [Google Scholar]
- 50.Lei L, Li H, Shi J, Chen Y. Rev Sci Instrum. 2010;81:023103. doi: 10.1063/1.3280226. [DOI] [PubMed] [Google Scholar]
- 51.Yu H, Zhou G, Chau FS, Lee F. Opt Lett. 2009;34:1753–1755. doi: 10.1364/ol.34.001753. [DOI] [PubMed] [Google Scholar]
- 52.Llobera A, Wilke R, Buttgenbach S. Lab Chip. 2005;5:506–511. doi: 10.1039/b416633g. [DOI] [PubMed] [Google Scholar]
- 53.Domachuk P, Littler ICM, Cronin-Golomb M, Eggleton BJ. Appl Phys Lett. 2006;88:093513. [Google Scholar]
- 54.Chin LK, Liu AQ, Soh YC, Lim CS, Lin CL. Lab Chip. 2010;10:1072–1078. doi: 10.1039/b920412a. [DOI] [PubMed] [Google Scholar]
- 55.Crespi A, Gu Y, Ngamsom B, Hoekstra HJWM, Dongre C, Pollnau M, Ramponi R, Vlekkert HHvd, Watts P, Cerullo G, Osellame R. Lab Chip. 2010;10:1167–1173. doi: 10.1039/b920062b. [DOI] [PubMed] [Google Scholar]
- 56.Duffy DC, McDonald JC, Schueller OJA, Whitesides GM. Anal Chem. 1998;70:4974–4984. doi: 10.1021/ac980656z. [DOI] [PubMed] [Google Scholar]
- 57.Saleh B, Teich M, Masters B. Fundamentals of Photonics. 2008;13:049901. [Google Scholar]
- 58.Wu M, Paul K, Whitesides G. Appl Opt. 2002;41:2575–2585. doi: 10.1364/ao.41.002575. [DOI] [PubMed] [Google Scholar]
- 59.Pope R, Fry E. Appl Opt. 1997;36:8710–8723. doi: 10.1364/ao.36.008710. [DOI] [PubMed] [Google Scholar]
- 60.Daimon M, Masumura A. Appl Opt. 2007;46:3811–3820. doi: 10.1364/ao.46.003811. [DOI] [PubMed] [Google Scholar]
- 61.Lide D. CRC Handbook of Chemistry and Physics. CRC press; 1993. [Google Scholar]
- 62.MacDougall D, Crummett WB. Anal Chem. 1980;52:2242–2249. [Google Scholar]
- 63.Mao X, Waldeisen JR, Huang TJ. Lab Chip. 2007;7:1260–1262. doi: 10.1039/b711155j. [DOI] [PubMed] [Google Scholar]
- 64.Mao X, Lin SCS, Dong C, Huang TJ. Lab Chip. 2009;9:1583–1589. doi: 10.1039/b820138b. [DOI] [PubMed] [Google Scholar]
- 65.Shi J, Huang H, Stratton Z, Lawit A, Huang Y, Huang TJ. Lab Chip. 2009;9:3354–3359. doi: 10.1039/b915113c. [DOI] [PubMed] [Google Scholar]
- 66.Huang TJ, Liu M, Knight LD, Grody WW, Miller JF, Ho CM. Nucleic Acids Res. 2002;30:e55. doi: 10.1093/nar/gnf054. [DOI] [PMC free article] [PubMed] [Google Scholar]
- 67.Hsiao VKS, Waldeisen JR, Zheng Y, Lloyd PF, Bunning TJ, Huang TJ. J Mater Chem. 2007;17:4896–4901. [Google Scholar]
- 68.Zheng Y, Huang TJ, Desai AY, Wang SJ, Tan LK, Gao H, Huan A. Appl Phys Lett. 2007;90:183117. [Google Scholar]
- 69.Shi J, Lin SCS, Huang TJ. Appl Phys Lett. 2008;92:111901. [Google Scholar]
- 70.Lin SCS, Huang TJ, Sun JH, Wu TT. Phys Rev B: Condens Matter Mater Phys. 2009;79:094302. [Google Scholar]