

Abstract
Objectives
recently, OTOG and OTOGL were identified as human deafness genes. Currently, only four families are known to have autosomal recessive hearing loss based on mutations in these genes. Since the two genes code for proteins (otogelin and otogelin-like) that are strikingly similar in structure and localization in the inner ear, this study is focused on characterizing and comparing the hearing loss caused by mutations in these genes.
Design
To evaluate this type of hearing, an extensive set of audiometric and vestibular examinations was performed in the 13 patients from four families.
Results
all families show a flat to downsloping configuration of the audiogram with mild to moderate sensorineural hearing loss. Speech recognition scores remain good (>90%). Hearing loss is not significantly different in the four families and the psychophysical test results also do not differ between the families. Vestibular examinations show evidence for vestibular hyporeflexia.
Conclusion
since otogelin and otogelin-like are localized in the tectorial membrane, one could expect a cochlear conductive hearing loss, as was previously shown in DFNA13 (COL11A2) and DFNA8/12 (TECTA) patients. Results of psychophysical examinations, however, do not support this. Furthermore, the authors can conclude that there are no phenotypic differences between hearing loss based on mutations in OTOG or OTOGL. This phenotype description will facilitate counseling of hearing loss caused by defects in either of these two genes.
Keywords: Otogelin, otogelin-like, autosomal recessive hearing loss, tectorial membrane, psychophysics
Introduction
Hearing impairment is the most common sensorineural disorder in humans and has many underlying causes e.g. infection, trauma or genetic defects. The latter are responsible for at least half of the cases with an early onset (van Laer et al. 2003). For hereditary early onset hearing loss the inheritance pattern is recessive in about 80% of the cases. Different techniques are available to identify the causative gene. An example is linkage analysis in which parental consanguinity and large family size enable easier identification of causative genes (Duman & Tekin 2012). Since these family characteristics are not common in Western populations, it was difficult to identify new loci and genes for autosomal recessive deafness in these populations in the past. The introduction of novel screening techniques including exome sequencing has led to an increase in the number of identified genetic causes of recessively inherited hearing loss also in the Western population (Rehman et al. 2010). So far, over 60 genes harboring more than 1,000 mutations were identified for non-syndromic hearing impairment (Shearer et al. 2011; Sivakumaran et al. 2013).
OTOG (DFNB18B) is one of the novel human deafness genes. It codes for otogelin, which is a non-collagenous protein that was found to be specific to the inner ear in mice by Cohen-Salmon et al. (1997). Subsequently, Simmler et al. (2000b) indicated OTOG to be a mouse deafness gene. Otogelin is held responsible for binding of the otoconial membrane and cupula to the neuroepithelium. In the tectorial membrane, otogelin might be important for the interaction or stabilization of the type-A and B fibers (Simmler et al. 2000a). OTOG was therefore also considered to be a candidate gene for hereditary non-syndromic hearing impairment in humans (Simmler et al. 2000b). The gene was mapped to chromosome 11 of the human genome by Cohen-Salmon et al. (1999) and we recently confirmed that mutations in OTOG cause deafness in humans (Schraders et al. 2012).
Shahin et al. (2010) described a gene homologous to OTOG, which is called OTOGL (DFNB84B). The predicted product of this gene is otogelin-like and 33.3% of the amino acid sequence is identical to that of otogelin (Yariz et al. 2012). Furthermore, otogelin-like is a component of the tectorial membrane, as is otogelin. When expression of otogl is knocked down in zebrafish, it leads to sensorineural hearing loss. Recently, we also have shown that OTOGL is a human deafness gene (Yariz et al. 2012).
Because of the striking similarities between otogelin and otogelin-like in terms of structure and expression, we wanted to evaluate whether the phenotypes of mutations in OTOG and OTOGL are also similar. This study presents an extensive audiometric and vestibular evaluation of the patients currently known with recessive sensorineural hearing loss caused by mutations in either OTOG or OTOGL (Schraders et al. 2012; Yariz et al. 2012). This description facilitates the identification of causative genetic defects in the outpatient clinic and improves counseling of patients on prognosis and rehabilitation of their hearing loss.
Patients and methods
Family Data
Eleven patients, from four different families were included in this study. Families A (W11-0186) and C (W00-384) are of Dutch origin, family B originates in Turkey and family D (S1778) is of Spanish origin. An autosomal recessive type of inheritance is apparent in the pedigrees, which show hearing loss in only one generation (figure 1). In family B a consanguineous marriage is present as the parent are first cousins.
Fig. 1.

Pedigrees of families participating in this study. A square indicates a male, a circle indicates a female. A filled symbol means affected, an open symbol means unaffected.
All participants voluntarily participated in this study and informed consent was obtained from the patients or parents when the patient was a minor. This study was approved by the local medical ethical committee. All hearing impaired family members filled in a standardized questionnaire on audiovestibular symptoms and underwent ENT examination, including otoscopy and external ear inspection, to exclude external ear deformities, previous surgery and other possible causes of hearing impairment. A computed tomography (CT) scan of the temporal bone was performed in one member of family B (II:7) and family C (II:3), in order to screen for possible anatomical causes of congenital hearing loss.
Genetic analysis of families A and B has been described by Yariz et al. (2012). Mutation analysis of OTOGL was initiated in family A and two compound heterozygous mutations were identified, a nonsense mutation (c.547C>T (p.Arg183X)) and a splice site mutation (c.5238+5G>A). They found a mutation in a homozygous state in OTOGL in family B (c.1430delT (p.Val477Glufs*25)).
Genetic results for families C and D have been described by Schraders et al. (2012). In family C a homozygous region containing OTOG was identified by homozygosity mapping and therefore, Sanger sequencing was applied to OTOG. A deletion (c.5508delC) was found in a homozygous state. This deletion is predicted to cause a frameshift and a premature stopcodon (p.Ala1838ProfsX31). In family D two pathogenic compound heterozygous mutations in OTOG (c.6347C>T (p.Pro2116Leu) and c.6559C>T (p.Arg2187X)) were identified.
Audiovestibular Examination
Pure tone audiometry
Pure tone audiometry was performed according to current standards to determine hearing thresholds at frequencies of 0.25, 0.5, 1, 2, 4 and 8 kHz. To exclude conductive hearing impairment, air and bone conduction thresholds were determined.
Speech recognition test
In families A and C standard Dutch phonetically balanced word lists (NVA Dutch CVC lists, Bosman 1992) were used to measure speech recognition scores. The average of the maximum percentage correct for both ears is the maximum phoneme score. These scores were obtained from monaural performance versus intensity curves.
Otoacoustic emissions (OAEs) and acoustic reflexes
OAEs were assessed in individual II:1 from family C. In all members of families A, B and C acoustic reflexes were measured contralateral and ipsilateral at 0.5, 1, 2 and 4 kHz up to the loudness discomfort level.
Vestibular function tests
Unterberger stepping test, Romberg test, head thrust test, head shake test and smooth pursuit eye movements were used to roughly evaluate vestibular function in family A. The parents of family A did not give consent for more extensive vestibular testing. Vestibular function was evaluated in family B, C and D by electronystagmography. This involved calorics in families C and D and a velocity-step test in all three families. Calorisation was performed by bithermal (30 and 44 °C) water irrigation of the external auditory canal. The velocity step test was performed with patients seated in a rotary chair and their head anteflexed at 30°. The chair was accelerated and when the rotatory nystagmus had subsided during constant rotation the chair was suddenly stopped. Areflexia was defined as no responses during vestibular function tests. Hyporeflexia was defined when responses are below normal ranges (i.e. velocity step test: gain < 33%, slow phase velocity < 30°/s, time constant < 11 s; caloric tests: < 7°/s and <10°/s for cold and warm irrigation respectively). This test was previously described by Theunissen et al. (Theunissen et al. 1986).
Psychophysical Examination
In order to try to distinguish further than a mere conductive or sensorineural hearing loss we performed the following psychophysical examinations to families A and C: loudness scaling, gap detection, difference limen for frequency and speech reception in noise. The latter was measured in the soundfield, the other tests were measured with a headphone at the best performing ear. Results of loudness scaling, gap detection and difference limen for frequency were compared to results psychophysical examination of normal hearing individuals. The data of normal hearing individuals were previously described by de Leenheer et al. (2004) and Plantinga et al. (2007). The results of speech reception in noise were also compared to those of presbyacusis patients (Bosman & Smoorenburg 1995) and normal hearing individuals.
Loudness scaling was measured with the Würzburger Hörfeld Skalierung developed by Moser (1987). Pure tones that ranged from threshold level (category 1) to loudness discomfort level (category 7) were presented with duration of one second. Patients were asked to rate the perceived loudness of stimuli on a scale from one to seven. Loudness scaling was performed with 0.5 kHz and 2 kHz pure tones. At these two frequencies, each stimulus level was presented four times in a random order.
Gap detection was performed as described by De Leenheer et al. (2004). Unfiltered white noise, octave band filtered white noise with 0.5 kHz centre frequency and with 2 kHz centre frequency were used to test the patient's ability to perceive a period of silence between two noise bursts. These bursts are of equal duration and intensity and were presented at the most comfortable listening level (MCL). Gap widths of 0 (no gap), 2, 2.8, 4, 5.6, 8, 11.2, 16 and 22.4 ms were randomly presented. The random gap procedure was repeated four times for each type of noise.
Difference limen for frequency (DLF) was measured at 0.5 kHz and 2 kHz with randomly emitted frequency modulated pure tones generated by an Interacoustics AC-40 audiometer. Frequency fluctuations were 0 (no fluctuation), 0.2, 0.4, 0.6, 0.8, 1, 2, 3 and 5%. All the stimuli were presented three times at the MCL. The lowest percentage of fluctuation that was detected by the patient was designated to be the DLF.
The speech reception thresholds in noise (SRT), i.e. the presentation level at which a score of 50% correct is achieved for whole sentences, were determined as described by de Leenheer et al. (2004). To define these SRTs, sentences in noise in the soundfield, according to Plomp and Mimpen, were used (Plomp & Mimpen 1979). The noise level was fixed at the MCL and the adaptive procedure described by Plomp and Mimpen was used to set the level of the sentences. Both speech and noise were presented via one loudspeaker facing the patient who was not wearing hearing aids. Outcome measure in this experiment was the signal-to-noise ratio (S/N ratio), which is the difference in decibels between the SRT and the noise level.
The youngest member of family A did not participate in the psychophysical examinations since these tests were too difficult for his age.
Statistic Analyses
To evaluate progression of hearing impairment linear regression analysis was performed with Prism 5.0 (Graphpad, San Diego, Ca, USA). For each measured frequency it was tested whether the regression coefficient differed significantly from 0. Loudness scaling was evaluated with linear regression analysis as well. To compare hearing loss between all four families a mean audiogram was calculated and compared by means of an unpaired Students T-test. When more than two groups were compared a one-way ANOVA was used.
Results
Clinical Data
Family A consists of three hearing impaired boys in one generation aged five to eight years at first visit. Follow-up comprised 1.8 years. In family B, four siblings were analyzed. At first visit, II:1 was 34 years old, II:4 33 years, II:6 14 years and II:7 was 10 years old. Two audiograms were available of three of the four family members each (II:1, II:6 and II:7). The time between both audiograms is about eight years. Only one audiogram was available of individual II:4. In family C, one generation consisting of four affected male siblings was analyzed. They were three to seven years old at first visit and were followed for on average 11.5 years. Family D consists of two hearing impaired siblings aged 4.9 and 6.7 years at first visit. Follow-up comprised on average 21 years. The onset of hearing loss is potentially prelingual in families A, C and D. One member (AII:3) of family A failed neonatal hearing screening. Subsequently, the two older brothers were diagnosed with hearing loss at the age of two (II:2) and three (II:1) years. Speech development was delayed in families C (II:1, II:2 and II:4) and D (both affected members). Physical examination did not demonstrate any dysmorphic features. CT scans of the temporal bone in subjects of family B (II:7) and family C (II:3) did not show any abnormalities.
Audiometric Results
Overall, affected individuals in family A-D have a mild to moderate sensorineural hearing loss with a configuration that is flat to gently downsloping from the low- to the mid-frequencies (Stephens 2001). This is equivalent to the results recently presented by Bonnet et al. (2013) for a patient with mutations in OTOGL. Figure 2A-E shows the mean audiograms for each family separately, as well as combined. Hearing loss varies between 25 and 65 dB HL, depending on the frequency. Hearing thresholds do not significantly differ between the four families. Affected individuals of families A, B and C do not report progression of hearing loss. Longitudinal regression analysis indeed does not show progression. In family D, significant increase of thresholds at frequencies 0.25 kHz (0.63 dB/yr), 1 kHz (0.53 dB/yr), 2 kHz (0.85 dB/yr) and 4 kHz (1.17 dB/ yr) is seen in II:1 and at 1 kHz (0.35 dB/yr) and 2 kHz (0.50 dB/yr) in II:2 (figure 2F-G). This progression predominantly occurs after the age of twenty years. Cross-sectional analysis of speech recognition scores shows that speech recognition remains stable and above the 90% score.
Fig. 2.

A. Audiogram with the average air conduction thresholds of all affected family members of family A. Standard deviations are indicated by vertical lines. Air conduction did not differ from bone conduction thresholds. B. All affected family members of family B. C. Family C. D. Family D. E. All four mean audiograms combined. F. All audiograms (mean of both ears) of individual II.1 of family D combined (6.7-24 years of age). G. All audiograms (mean of both ears) individual II.2 of family D combined (4.9-30.4 years of age).
OAEs could not be detected in II:1 from family C. Average reflex thresholds for normal hearing individuals and patients with a hearing loss up to 50 dB HL are 85 dB HL. There is an interindividual standard deviation of 7 dB (Silman and Gelfand 1981). Reflexes within the normal range were detected in all individuals, except for II:4 of family C. His reflex thresholds were beyond the loudness discomfort level.
Psychophysical Results of Both Dutch Families
Individuals of family A had an average age of 9.3 years and those in family C 16.5 years at psychophysical examination. Mean results for loudness scaling experiments at 0.5 and 2 kHz are depicted in figure 3. For 0.5 kHz, the curves of loudness growth run almost parallel to or slightly steeper than those of normal hearing individuals. For 2 kHz, the curves are clearly steeper in the affected individuals as compared to those of controls. This suggests recruitment at 2 kHz, which holds for both families. The slopes for both frequencies do not differ significantly between both families (0.5 kHz p=0.62; 2 kHz p=0.57).
Fig. 3.
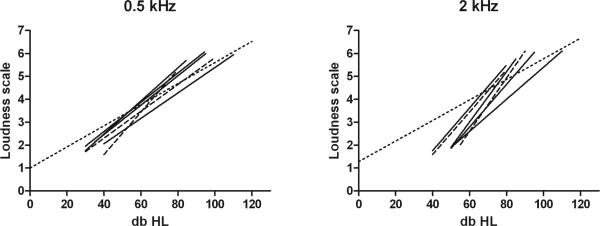
A. Loudness scaling at 0.5 kHz, dotted line indicates mean results of normal hearing individuals, dashed lines represent the results of family A, solid lines indicate family C. B. Similar results of loudness scaling at 2 kHz.
The results of average gap detection for unfiltered white noise stimuli and for filtered white noise stimuli with 0.5 kHz and 2 kHz centre frequencies are displayed in figure 4. Results of the youngest family member of family C (II:4, aged 13.9) were qualified as unreliable since he failed to understand the explanation of the test and therefore the results were excluded. For unfiltered white noise stimuli, the average gap width was a little higher for patients than for normal hearing individuals (one way ANOVA, F(2,20)=280, p<0.001). This was more prominent in family A compared to family C, although the two families did not differ significantly from one another (p=0.30). For filtered white noise stimuli with 0.5 kHz centre frequency the average values for families A and C were both smaller than for the average normal hearing individual (one way ANOVA, F(2,18)=0.82, p=0.45). On the other hand, for the filtered white noise stimuli with 2 kHz centre frequency the average value for family A was higher than for the average normal hearing individual and the average value for family C was lower than for the average normal hearing individual (one way ANOVA. F(2,19)=0.12, p=0.89). Between both families the differences were not significant (0.5 kHz p=0.67; 2 kHz p=0.43).
Fig. 4.

Gap detection measured in milliseconds (ms) for unfiltered white noise stimuli and for filtered white noise stimuli with 0.5 kHz and 2 kHz centre frequencies. Mean results for families A and C compared to those of normal hearing individuals.
The average results for the difference limen for frequency experiments with 0.5 kHz and 2 kHz stimuli are compared between the affected individuals and controls in figure 5. Individuals with normal hearing achieve an average DLF of 0.5% in response to a 0.5 kHz tone. The DLF averages of families A and C were slightly higher at 0.5 kHz than normal hearing individuals. As for the 2 kHz stimuli, the average DLF values of families A and C were clearly higher than the average value of normal hearing individuals. Again, both families did not differ from one another (0.5 kHz, p=0.34; 2 kHz, p=1).
Fig. 5.

Difference Limen for Frequency (DLF) measured in percentage (%) for 0.5 kHz and 2 kHz. Mean results for families A and C and the results for normal hearing individuals are presented.
The average values of speech reception thresholds in noise are higher, i.e. worse, for both families than for the average normal hearing individual. This is more prominent in family A, but does not differ significantly from family C (p=0.07) (figure 6).
Fig. 6.

SRT in noise in signal/ noise ratio. Mean results for families A and C compared to those for normal hearing individuals, presbyacusis patients and presbyacusis corrected for audibility.
Vestibular Examination
In family A, individual II:1 reported delayed motor development. He could only roll over at 12 months of age and started walking after 21 months. The head thrust test showed signs of hyporeflexia of the right vestibulum. In family C, delayed motor development was reported for two boys. Individuals II:2 and II:4 were able to sit at 12 months, could stand at 14 months, crawled at 12 and 11 months respectively and walked after 18 and over 24 months, respectively. The rotatory tests revealed hyporeflexia and calorisation showed bilateral weakness in all affected males of this family. Both members of family D underwent vestibular testing and calorisation showed a bilateral deficit. In family B one member (II:7) underwent calorisation and showed vestibular hypofunction of the left vestibulum.
Discussion
Recently, OTOG and OTOGL were identified as novel human deafness genes and their striking similarities in protein structure and localization in the tectorial membrane were emphasized (Schraders et al. 2012; Yariz et al. 2012). In the present study, the phenotypic characteristics of two families with OTOG mutations and two families with OTOGL mutations are evaluated to compare both phenotypes. All affected family members show a mild to moderate hearing loss and a flat to gently downsloping audiogram, no differences between the four families were noted. Mild progression may be seen in families with hearing loss caused by mutations in OTOG when long term follow-up is present. This progression occurs mainly in the mid frequencies and mainly after twenty years of age.
In one family with mutations in OTOG and one family with mutations in OTOGL additional psychophysical tests were performed. The results are similar in both families, but differ from results of normal hearing individuals. Vestibular examination showed evidence of hyporeflexia in all tested and affected family members. In addition, delayed motor development was noticed in three individuals (AII:1, CII:2 and CII:4).
Mutations in Genes Encoding Components of the Tectorial Membrane Give a Similar Hearing Loss
Otogelin and otogelin-like are components of the tectorial membrane. TECTA (DFNA8/12 and DFNB21), CEACAM16 (DFNA4B) and COL11A2 (DFNA13 and DFNB53), are human deafness genes that code for other proteins of the tectorial membrane (McGuirt et al. 1999; Verhoeven et al. 1998; Zheng et al. 2011). The phenotypic characteristics of these inherited types of sensorineural hearing loss are summarized in table 1. Non-syndromic hearing impairment caused by defects in one of the tectorial membrane proteins is usually characterized by a flat to U-shaped audiogram, has an early onset and is often not progressive, especially when the defects are inherited in an autosomal recessive way. These characteristics are comparable to those of the patients described here.
Table 1.
| Onset | Affected frequencies | Severity | Progression | |
|---|---|---|---|---|
| Autosomal dominant inheritance | ||||
| DFNA4 (CEACAM16) (Zheng et al. 2011) | Postlingual | All | Moderate | Yes, +/- 50 dB HL |
| DFNA8/12 (TECTA) (Hildebrand et al. 2011; Plantinga et al. 2006) | Variable (depending on affected domain) | Mid or high, depending on affected protein domain. | Mild to severe | Variable (depending on cysteine-replacing substitutions) |
| DFNA13 (COLL11A2) (De Leenheer et al. 2002; McGuirt et al. 1999) | Congenital | Mid, occasionally high | Mild to moderate | None |
| Autosomal recessive inheritance | ||||
| DFNB21 (TECTA) (Meyer et al. 2007) | Prelingual | All, mid frequency dip | Moderate to profound | None |
| DFNB53 (COLL11A2) (Chen et al. 2005) | Prelingual | All | Profound | None |
| DFNB18B (OTOG) | Prelingual | All | Mild to moderate | Mild |
| DFNB84B (OTOGL) | Prelingual | All | Mild to moderate | None |
Hearing Loss Is Not of a Cochlear Conductive Type Despite Suspected Tectorial Membrane Involvement
Psychophysical evaluation in patients with a defect in the tectorial membrane due to mutations in TECTA and COL11A2 revealed a clear cochlear conductive hearing loss. This type of hearing loss is characterized by performance in the (near-)normal range for the gap detection test, difference limen for frequency test and speech reception in noise test, elevated acoustic reflex thresholds and a parallel shift of the curve for loudness scaling (Plantinga et al. 2007; de Leenheer et al. 2004).
Otogelin and otogelin-like are also components of the tectorial membrane and Simmler et al. (2000a) stated that the resistance of the tectorial membrane to mechanical stress produced by sound wave pressure is reduced in the absence of otogelin. Therefore, we also predicted a cochlear conductive hearing loss in patients with mutations in OTOG or OTOGL. The present psychophysical and audiological data, however, do not support this. On the other hand, the S/N value is obviously better (mean value OTOG/OTOGL patients: −1.8 dB) than that found in presbyacusis patients (+0.7 dB) (figure 6) which contradicts a sensorineural type of hearing loss. This discrepancy is possibly caused by an audibility problem: speech and noise have a broad frequency spectrum. When carrying out the speech in noise test in hearing impaired subjects, amplification should enable full audibility. This is easily acquired in case of a relatively flat hearing loss, as is found in phenotypes caused by mutations in OTOG and OTOGL. Typically, hearing loss in presbyacusis is not flat but downsloping, affecting predominantly the higher frequencies. In such patients, whenever amplification is acceptable in the low and mid-frequencies, speech sounds might still be poorly audible in the high frequencies. As shown by Killion and Christensen (1998), corrections can be made to deal with this audibility problem. Following their method, the S/N ratio for the studied group of presbyacusis corrected for audibility, is approximately −1.3 dB instead of +0.7 dB. That S/N value is comparable with the mean S/N value of the patients with mutations in OTOG and OTOGL. This strengthens the suggestion that, although the defect is located in the tectorial membrane, it does not cause hearing loss of the cochlear conductive type. A possible explanation might be that the outer hair cells, with their stereocilia in contact with the tectorial membrane, do not function normally because of an ineffective connection.
One should keep in mind that psychophysical tests are not easy to perform and require good concentration. Therefore, the young age of the participants might have influenced the reliability of the results of psychophysical examinations. This might explain the minor, although not significant, differences between families A and C, since the affected individuals of family A are younger than those of family C. A more accurate description can and must be made when larger numbers of (older) patients with OTOG and OTOGL mutations are available, however, so far these are the only four families known worldwide.
Consequences of Impaired Otogelin Function for Hearing And Balance
In OTOG knock-out mice, detachment of the otoconial membrane and cupulae from the neuroepithelia endorses the requirement of otogelin for anchoring the acellular membrane to the underlying neuroepithelia (Simmler et al. 2000a). This detachment of the otoconial membrane and cupula may explain the impaired vestibular function in the affected individuals and thereby the delayed motor development in AII:1, CII:2 en CII:4. Because of compensatory mechanisms, vestibular dysfunction will probably not have any further clinical consequences (Street et al. 2008).
Mice with a mutation in OTOG have progressive moderate to profound hearing loss. However, in histology the tectorial membrane of these mice appears to be normal. Otogelin does not seem to be involved in anchoring the tectorial membrane to the spiral limbus. However, in transmission electron microscopy some abnormal fibrillar or rod-like structures roughly parallel to the axis of the tectorial membrane were detected. Simmler et al. (2000b) stated that the resistance of the tectorial membrane might be reduced in the absence of otogelin, which might reduce sound transduction and leads to sound attenuation. However the results of psychophysical testing in the patients point towards a defect in the hair cells or the connection between the stereocilia and tectorial membrane. Further research is necessary to unravel a possible of role of otogelin and otogelin-like in these defects.
Progression of Hearing Loss
Progression of hearing loss is not seen nor reported in three out of four families. In family D, which carries mutations in OTOG, progression is mainly seen after the age of twenty and is relatively mild. The individuals of family C are too young to make a statement on progression in this family. The slow progression might be explained by the fact that otogelin transcription almost vanishes in the cochlea in adult mice, but otogelin labeling persists. This suggests a slow turnover process of otogelin in the cochlea (El-Amraoui et al. 2001). Yariz et al. (2012) also describe high levels of OTOGL transcripts in early development and down regulation in later development, which suggests involvement in the development of the structure, but a low turnover. Further follow-up or identification of older patients with hearing loss caused by mutations in OTOG or OTOGL will reveal how hearing loss presents over time.
Conclusion
In this paper, the audiovestibular phenotypes of two families with autosomal recessively inherited mutations in OTOG are compared with two families with mutations in OTOGL, because of the striking similarities in structure of the proteins and their localization in the tectorial membrane. So far, these are the only four families known with hearing loss with underlying mutations in OTOG or OTOGL. The present results show that there are no significant phenotypic differences between all examined families. Overall one can conclude that mutations in either OTOG or OTOGL lead to a mild-to-moderate sensorineural hearing loss with a flat to gently downsloping audiogram. So far, mild progression is only seen in one family with mutations in OTOG. Clear evidence of vestibular hyporeflexia is found with relatively mild clinical consequences. Additional psychophysical examinations in two Dutch families also do not show any differences between the phenotypic expression of OTOG and OTOGL mutations. Since otogelin and otogelin-like are detected in the tectorial membrane, one could expect a cochlear conductive hearing loss, as was shown in DFNA13 and DFNA8/12 patients. However, present results of psychophysical examinations do not support this. Further research is needed to determine the exact role of otogelin and otogelin-like in the cochlea. Meanwhile, present results will improve genetic counseling of patients with mutations in OTOG or OTOGL.
Acknowledgements
The authors thank the family members for their participation in this study. This work was funded by the Heinsius Houbolt Foundation to H.K., the Oticon Foundation (09-3742) to H.K., ZON MW (to H.K.: 40-00812-98-09047 to R.J.E.P.: 90700388) and National Institutes of Health grant (R01DC009645) to M.T.
Footnotes
Financial Disclosures/ Conflict of Interest:
The authors declare that they have no conflict of interest.
References
- Bonnet C, Louha M, Loundon N, et al. Biallelic nonsense mutations in the otogelin-like gene (OTOGL) in a child affected by mild to moderate hearing impairment. Gene. 2013;527(2):537–540. doi: 10.1016/j.gene.2013.06.044. [DOI] [PubMed] [Google Scholar]
- Bosman AJ, Smoorenburg GF. Intelligibility of Dutch CVC syllables and sentences for listeners with normal hearing and with three types of hearing impairment. Audiology. 1995;34:260–284. doi: 10.3109/00206099509071918. [DOI] [PubMed] [Google Scholar]
- Chen W, Kahrizi K, Meyer NC, et al. Mutation of COL11A2 causes autosomal recessive non-syndromic hearing loss at the DFNB53 locus. J Med Genet. 2005;42(10):e61. doi: 10.1136/jmg.2005.032615. doi:10.1136/jmg.2005.032615. [DOI] [PMC free article] [PubMed] [Google Scholar]
- Cohen-Salmon M, El-Amraoui A, Leibovici M, et al. Otogelin: A Glycoprotein specific to the aellular membranes of the inner ear. Proc Natl Acad Sci USA. 1997;94:14450–14455. doi: 10.1073/pnas.94.26.14450. [DOI] [PMC free article] [PubMed] [Google Scholar]
- Cohen-Salmon M, Mattei MG, Petit C. Mapping of the otogelin gene (OTGN) to mouse Chromosome 7 and human Chromosome 11p14.3: a candidaye for human autosomal recessive nonsyndromic deafness DFNB18. Mamm Genome. 1999;10:520–522. doi: 10.1007/s003359901033. [DOI] [PubMed] [Google Scholar]
- de Leenheer EMR, Bosman AJ, Huygen PLM, et al. Audiological characteristics of some affected members of a dutch DFNA13/ COL11A2 family. Ann Otol Rhinol Laryngol. 2004;113:922–929. doi: 10.1177/000348940411301112. [DOI] [PubMed] [Google Scholar]
- De Leenheer EMR, McGuirt WT, Kunst HPM, et al. The phenotype of DFNA13/COL11A2. Adv Otorhinolaryngol. 2002;61:85–91. doi: 10.1159/000066804. [DOI] [PubMed] [Google Scholar]
- Duman D, Tekin M. Autosomal recessive nonsyndromic deafness genes: a review. Front Biosci. 2012;17:2213–2236. doi: 10.2741/4046. [DOI] [PMC free article] [PubMed] [Google Scholar]
- El-Amraoui A, Cohen-Salmon M, Petit C, et al. Spatiotemporal expression of otogelin in the developing and adult mouse inner ear. Hear Res. 2001;158:151–159. doi: 10.1016/s0378-5955(01)00312-4. [DOI] [PubMed] [Google Scholar]
- Hildebrand MS, Morin M, Meyer NC, et al. DFNA8/12 caused by TECTA mutations is the most identified subtype of nonsyndromic autosomal dominant hearing loss. Hum Mutat. 2011;32(7):825–834. doi: 10.1002/humu.21512. [DOI] [PMC free article] [PubMed] [Google Scholar]
- Killion M, Christensen L. The case of the missing dots: Al and SNR loss. Hear J. 1998;51(5):32–47. [Google Scholar]
- McGuirt WT, Prasad SD, Griffith AJ, et al. Mutations in COL11A2 cause non-syndromic hearing loss (DFNA13). Nat genet. 1999;23:413–419. doi: 10.1038/70516. [DOI] [PubMed] [Google Scholar]
- Meyer NC, Alasti F, Nishimura CJ, et al. Identification of three novel TECTA mutations in Iranian families with autosomal recessive nonsyndromic hearing impairment at the DFNB21 locus. Am J Med Genet A. 2007;143A(14):1623–1629. doi: 10.1002/ajmg.a.31718. doi:10.1002/ajmg.a.31718. [DOI] [PubMed] [Google Scholar]
- Moser MM. Das Würzburger Hörfeld, ein Test für prothetische Audiometrie. HNO. 1987;35:318–321. [PubMed] [Google Scholar]
- Plantinga RF, Brouwer APMd, Huygen PLM, et al. A novel TECTA mutation in a Dutch DFNA8/12 family confirms genotype–phenotype correlation. JARO. 2006;7:173–181. doi: 10.1007/s10162-006-0033-z. [DOI] [PMC free article] [PubMed] [Google Scholar]
- Plantinga RF, Cremers CWRJ, Huygen PLM, et al. Audiological evaluation of affected members from a Ducth DFNA8/12 (TECTA) family. JARO. 2007;8:1–7. doi: 10.1007/s10162-006-0060-9. [DOI] [PMC free article] [PubMed] [Google Scholar]
- Plomp R, Mimpen AM. Improving the reliabilty of testing the speech reception threshold for sentences. Audiology. 1979;18:43–52. doi: 10.3109/00206097909072618. [DOI] [PubMed] [Google Scholar]
- Rehman AU, Morell RJ, Belyantseva IA, et al. Targeted Capture and Next-Generation Sequencing Identifies C9orf75, Encoding Taperin, as the Mutated Gene in Nonsyndromic Deafness DFNB79. Am J Hum Genet. 2010;86(3):378–388. doi: 10.1016/j.ajhg.2010.01.030. doi:10.1016/j.ajhg.2010.01.030. [DOI] [PMC free article] [PubMed] [Google Scholar]
- Schraders M, Ruiz-Palmero L, Kalay E, et al. Mutations of the gene encoding otogelin are a cause of autosomal-recessive nonsyndromic moderate hearing impairment. Am J Hum Genet. 2012;91(5):883–889. doi: 10.1016/j.ajhg.2012.09.012. doi:10.1016/j.ajhg.2012.09.012. [DOI] [PMC free article] [PubMed] [Google Scholar]
- Shahin H, Rahil M, Rayan AA, et al. Nonsense mutation of the stereociliar membrane protein gene PTPRQ in human hearing loss DFNB84. J Med Genet. 2010;47:643–645. doi: 10.1136/jmg.2009.075697. [DOI] [PubMed] [Google Scholar]
- Shearer AE, Hildebrand M, Sloan CM, et al. Deafness in the genomics era. Hear Res. 2011;282(1-2):1–9. doi: 10.1016/j.heares.2011.10.001. [DOI] [PMC free article] [PubMed] [Google Scholar]
- Silman S, Gelfand SA. The relationship between magnitude of hearing loss and acoustic reflex threshold levels. J Speech Hear Disord. 1981;46(3):312–316. doi: 10.1044/jshd.4603.312. [DOI] [PubMed] [Google Scholar]
- Simmler MC, Cohen-Salmon M, El-Amraoui A, et al. Targeted disruption of Otog results in deafness and severe imbalance. Nat genet. 2000a;24:139–143. doi: 10.1038/72793. [DOI] [PubMed] [Google Scholar]
- Simmler MC, Zwaenepoel I, Verpy E, et al. Twister mutant mice are defective for otogelin, a component specific to inner ear acellular membranes. Mamm Genome. 2000b;11:961–966. doi: 10.1007/s003350010197. [DOI] [PubMed] [Google Scholar]
- Sivakumaran TA, Husami A, Kissell D, et al. Performance Evaluation of the Next-Generation Sequencing Approach for Molecular Diagnosis of Hereditary Hearing Loss. Otolaryngol Head Neck Surg. 2013 doi: 10.1177/0194599813482294. doi:10.1177/0194599813482294. [DOI] [PubMed] [Google Scholar]
- Stephens D. Audiological terms. In: Martini A, Read A, Stephens D, Mazzoli M, editors. Definitions, Protocols and Guidelines in Genetic Hearing Impairments. Vol. 1. Whurr Publishers; 2001. [Google Scholar]
- Street VA, Kallman JC, Strombom PD, et al. Vestibular function in families with inherited autosomal dominant hearing loss. J Vestib Res. 2008;18(1):51–58. [PMC free article] [PubMed] [Google Scholar]
- Theunissen EJ, Huygen PL, Folgering HT. Vestibular hyperreactivity and hyperventilation. Clin Otolaryngol Allied Sci. 1986;11(3):161–169. doi: 10.1111/j.1365-2273.1986.tb00123.x. [DOI] [PubMed] [Google Scholar]
- van Laer L, Cryns K, Smith RJ, et al. Nonsyndromic hearing loss. Ear Hear. 2003;24(4):275–288. doi: 10.1097/01.AUD.0000079805.04016.03. [DOI] [PubMed] [Google Scholar]
- Verhoeven K, van Laer L, Kirschhofer K, et al. Mutations in the human -tectorin gene cause autosomal dominant non-syndromic hearing impairment. Nat genet. 1998;19:60–62. doi: 10.1038/ng0598-60. [DOI] [PubMed] [Google Scholar]
- Yariz KO, Duman D, Seco CZ, et al. Mutations in OTOGL, Encoding the Inner Ear Protein Otogelin-like, Cause Moderate Sensorineural Hearing Loss. Am J Hum Genet. 2012;91(5):872–882. doi: 10.1016/j.ajhg.2012.09.011. doi:10.1016/j.ajhg.2012.09.011. [DOI] [PMC free article] [PubMed] [Google Scholar]
- Zheng J, Miller KK, Yang T, et al. Carcinoembryonic antigen-related cell adhesion molecule 16 interacts with alpha-tectorin and is mutated in autosomal dominant hearing loss (DFNA4). Proc Natl Acad Sci USA. 2011;108(10):4218–4223. doi: 10.1073/pnas.1005842108. doi:10.1073/pnas.1005842108. [DOI] [PMC free article] [PubMed] [Google Scholar]