Abstract
Background
Plasma or circulating miRNAs (cirmiRNAs) have potential diagnostic value as biomarkers for a range of diseases. Based on observations that ethanol altered intracellular miRNAs during development, we tested the hypothesis that plasma miRNAs were biomarkers for maternal alcohol exposure, and for past in utero exposure, in the neonate.
Methods
Pregnant sheep were exposed to a binge model of ethanol consumption resulting in an average peak blood alcohol content of 243 mg/dl, for a three-trimester equivalent period from gestational day (GD) 4 to GD 132. MiRNA profiles were assessed by quantitative PCR analysis in plasma, erythrocyte and leukocytes obtained from non-pregnant ewes, and plasma from pregnant ewes 24 hours following the last binge ethanol episode, and from newborn lambs, at birth on ~GD 147.
Results
Pregnant ewe and newborn lamb cirmiRNA profiles were similar to each other and different from non-pregnant female plasma, erythrocyte or leukocyte miRNAs. Significant changes in cirmiRNA profiles were observed in the ethanol-exposed ewe, and at birth, in the in utero, ethanol-exposed lamb. CirmiRNAs including miR-9, -15b, -19b and -20a were sensitive and specific measures of ethanol exposure in both pregnant ewe and newborn lamb. Additionally, ethanol exposure altered guide to passenger strand cirmiRNA ratios in the pregnant ewe, but not in the lamb.
Conclusion
Shared profiles between pregnant dam and neonate suggest possible maternal-fetal miRNA transfer. CirmiRNAs are biomarkers for alcohol exposure during pregnancy, in both mother and neonate, and may constitute an important shared endocrine biomarker that is vulnerable to the maternal environment.
Keywords: Plasma miRNAs, passenger strand miRNA, miRNA*, maternal alcohol exposure, fetal alcohol exposure
Introduction
Maternal alcohol consumption during pregnancy can result in a range of anatomical defects and behavioral deficits, collectively termed the “Fetal Alcohol Spectrum Disorder” or FASD (Mattson et al., 2011). Fetal Alcohol Syndrome (FAS) represents the severe end of the FASD continuum, and is diagnosed by the presence of craniofacial dysmorphology among other anatomical features (Jones and Smith, 1975). The prevalence of FAS varies geographically, and within ethnic groups, reportedly 0.02–0.15% (Centers for Disease Control and Prevention (CDC), 2012) in the United States, but as high as 5.9–9.1% in South Africa (May et al., 2013). Estimates for the prevalence of FASD range from 2–5% of the school age population in the US and Western Europe (May et al., 2009), to 13.6–20.9% in South Africa (May et al., 2013). FASD is a significant public health and economic burden (Popova et al., 2012).
Early diagnosis of FASD is important to mitigate secondary disabilities that arise later in life (Hellemans et al., 2010). However, key elements in the diagnosis including the presence of facial dysmorphology, accompanied by a documented history of maternal alcohol consumption are difficult to ascertain. Not all developmentally exposed children exhibit overt anatomical evidence of exposure (Kvigne et al., 2012), and a documented history of drinking during pregnancy is only moderately correlated with dysmorphology (May et al., 2013). Several promising biomarkers for fetal alcohol exposure, including fatty acid ethyl ester in neonatal meconium (Peterson et al., 2008), ethyl glucuronide in placenta (Matlow et al., 2012), and phosphatidylethanol in newborn blood (Bakhireva et al., 2013) have been identified. Each of these is useful, but subject to potential limitations due to turnover of these metabolites with time following exposure. Furthermore, given the variable relationship between alcohol exposure and outcome severity, there is a clear need for biomarkers of ‘fetal alcohol effect’ in addition to markers of ‘fetal exposure’.
In this study we assessed circulating microRNAs (cirmiRNAs) as a biomarker for ‘alcohol effect’ in the pregnant mother and the infant. MiRNAs, a class of small non-protein-coding RNAs, that control protein translation, have recently been found to be secreted into plasma and other fluid compartments, either within exosomes (Gallo et al., 2012), or coupled to chaperones like the Argonaut proteins (Arroyo et al., 2011) or low density lipoprotein (Vickers et al., 2011). Early reports suggested that cirmiRNAs are useful biomarkers for pregnancy and for human diseases like cancer and trisomy-21 (Chim et al., 2008; Go et al., 2008; Mitchell et al., 2008). cirmiRNAs have recently been reported to be altered following alcohol-induced liver damage and inflammation (Bala et al., 2012). We previously showed that ethanol altered miRNA expression patterns in developing neural tissues (Balaraman et al., 2012; Sathyan et al., 2007) and in whole animal models (Pappalardo-Carter et al., 2013). We therefore tested the hypothesis, in a model of gestational alcohol exposure in sheep (Ovis Aries), that exposure would also alter cirmiRNA profiles in the pregnant mother, and lead to persistent alterations in the neonate.
Materials and Methods
Animals and breeding
All experimental procedures were approved by the Texas A&M University IACUC. Sheep were chosen as a model system because of their history as an experimental model for human pregnancy (Barry and Anthony, 2008), because a majority of expressed sheep miRNAs are conserved mammalian miRNAs (Zhang et al., 2013), and because sheep, like humans, are generally uniparous, and all three trimester equivalent periods of fetal development occur in utero. General Sheep husbandry protocols are described in Supplementary Methods 1.
Experiment protocol
Pregnant ewes were divided into alcohol (1.75 g/kg body weight) and control (0.9% saline at a volume and infusion rate equivalent to that of the alcohol dose) groups. Experiments began on gestational day (GD) 4 and ended on GD 132 (i.e., over all three trimester equivalent periods of pregnancy (Ramadoss et al., 2007)). On GD4, an intravenous catheter (16 gauge, 5.25 in Angiocath™ Becton Dickinson, Sandy, UT, USA) was placed percutaneously into the jugular vein. Infusion solutions were delivered intravenously using a Grady Medical VetFlo® 7701B IV automated infusion pump. On the day of infusions, ewes were connected to the infusion pump and alcohol (40% w/v) or saline was infused continuously over 1 hour. Alcohol or saline was administered on three consecutive days followed by four days without alcohol to mimic a binge-drinking pattern (i.e., three times a week from GD4-GD132, Figure 1 (Caetano et al., 2006; Ebrahim et al., 1999; Gladstone et al., 1996)). Jugular vein catheters were maintained and replaced as needed to maintain aseptic conditions and patency. Using a Vacutainer® needle (Becton Dickinson, Sandy, UT, USA), blood was collected by jugular venipuncture directly into Vacutainer® sterile glass tubes containing ethylenediaminetetraacetic acid (EDTA, Becton Dickinson, Sandy, UT, USA), from the ewe, at 24 hours following the final episode of ethanol exposure, and from the lamb within one hour of birth (GD 147±2). Methodologies for assessing blood alcohol concentration (BAC) are outlined in Supplementary Methods 2. The mean BACs in the alcohol group across the 5 months of the study (three trimester equivalent periods) was 243.18+20.26 mg/dl (Figure 1), and there was no statistical difference in BACs between animals (ANOVA, F(5,24)=0.294, p=0.91).
Figure 1.
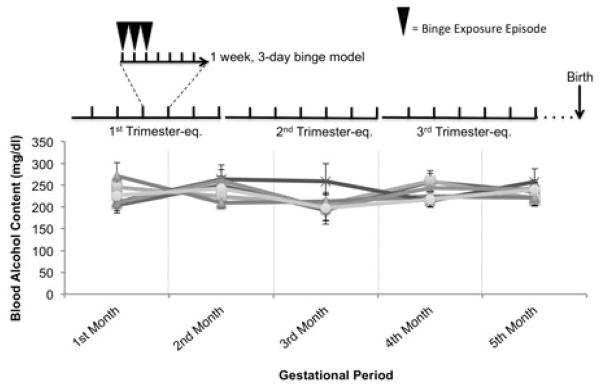
Average peak blood alcohol levels attained in binge-ethanol-exposed ewes over the three trimester-equivalent period of pregnancy. Pregnant ewes were exposed to ethanol or saline from GD4 to GD132 on a weekly schedule of three days exposure and 4 days of non-exposure. Lambs were born on GD147±2, i.e., two weeks after the last maternal ethanol exposure.
Sample Preparation
Plasma samples were separated from whole blood by centrifugation, and freeze-dried to capture all plasma miRNAs, irrespective of their association with vesicles or chaperone proteins (Arroyo et al., 2011; Gallo et al., 2012; Vickers et al., 2011). Erythrocytes were isolated after removal of plasma and the leukocyte-containing buffy coat. Leukocytes were purified by Ficoll-Paque PLUS (GE Healthcare Bio-Sciences, Uppsala, Sweden) gradient centrifugation according to the manufacturer’s instructions. Plasma and erythrocyte hemoglobin content was analyzed by NanoDrop® ND-1000 UV-Vis Spectrophotometer (Thermo Scientific, MA) for the presence of oxy-hemoglobin (500 and 600 nm) and deoxy-hemoglobin (~550nm) (Zijlstra and Buursma, 1997) and free hemoglobin (~414nm) (Kirschner et al., 2011).
RNA Extraction
Total RNA was extracted using the MagMAX Viral RNA isolation kit (Ambion, Austin, TX). Yield and purity were evaluated with a NanoDrop ND-1000 spectrophotometer. A260/A280 ratios between 1.96 and 2.04 were obtained for all samples of isolated RNA, confirming purity. RNA samples were stored at −80°C before use.
MiRNA and mRNA Expression Analysis
Most expressed ovine miRNAs are conserved mammalian miRNAs, while species-specific miRNAs constitute <1.0% of expressed miRNAs (Zhang et al., 2013). We therefore used the Exiqon miRCURY LNA Universal RT miRNA PCR panels (Exiqon miRNA Ready-to-use PCR Human Panel I+II V2. M/R, Exiqon, Denmark) of pre-aliquoted LNA PCR primer sets on 384 well plates arrays used for high throughput miRNA expression profiling of conserved mammalian miRNA content in sheep. One caveat for the use of human miRNA panels is that miRNAs containing ovine-specific polymorphisms within the priming region would fail to amplify, and consequently be assessed as ‘absent’. The miRCURY LNA Universal RT cDNA synthesis kit were used for cDNA synthesis from total RNA (25ng). 1:1 mix of diluted cDNA template and SYBR Green master mix were loaded on to the PCR plates for real time, qPCR analysis on an Applied Biosystems 7900HT fast Real-time PCR system (ABI/Life Technologies, Grand Island, NY). QPCR analysis for the mRNA for erythrocyte-specific band-3 membrane protein (SLC4A1) was conducted to assess erythrocyte contamination of plasma samples using published (Perrotta et al., 2005) forward (5′-aacgagtgggaacgtagctg-3′) and reverse (5′-cttcatattcctcctgctccag-3′) primers.
Data Analysis
Exiqon Panel 1 and Panel 2 miRNAs were analyzed separately, since they constituted distinct populations of miRNAs that were segregated onto plates based on their level of expression in cells, their regulation in disease and commonality in the published literature. Cycle Thresholds (CTs) were determined using SDS2.4 (ABI/Life Technologies), and data calculated as ΔCT (CTmiRNAx-CTaverage_for_sample), i.e., normalized to the average CT value for all of the expressed miRNAs in that sample. CTaverage_for_sample values were not significantly altered by ethanol exposure (Supplementary Figure 1a,b). In contrast, CTaverage_for_sample values were significantly lower in cell-derived miRNA samples (erythrocytes and leukocytes) compared to plasma-derived samples (non-pregnant and pregnant ewes, showing that miRNA content in total RNA was significantly higher in cells compared to plasma (Supplementary Figure 1c). Data (ΔCTs) were analyzed with GeneSifter® Analysis Edition (GSAE, Geospiza/Perkin Elmer, Seattle, WA), or by SPSS (ver. 20, IBM, Armonk, New York). Data were subjected to Analysis of Variance (ANOVA) or T-tests, with Benjamini and Hochberg false discovery rate (FDR) correction for multiple comparisons (α=0.05). For graphical representation, expression of individual miRNAs and mRNAs was calculated as 2^-ΔΔCT (where ΔΔCT = ΔCTsample-meanΔCTReference_Group). Additional methodologies for cluster, principal component (PCA) and receiver-operator characteristic (ROC) analyses, and bioinformatics analyses are described in Supplementary Methods 3.
Results
CirmiRNA profiles are distinct from erythrocyte and leukocyte miRNAs and change with pregnancy
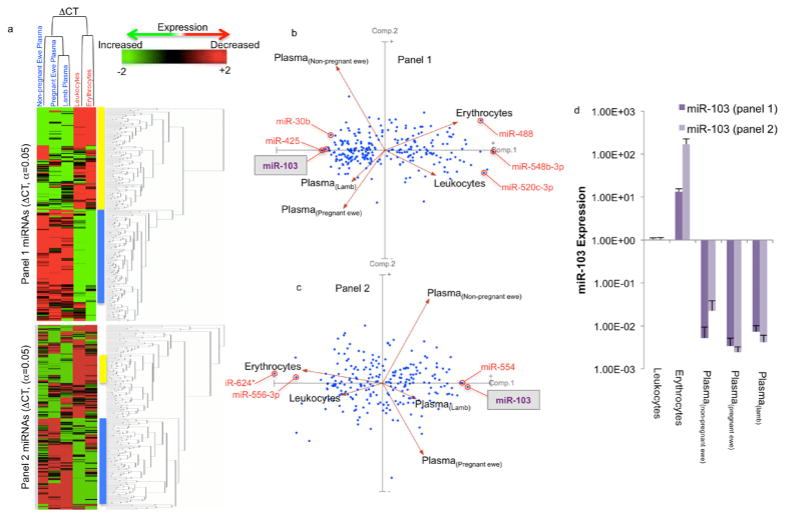
Damaged leukocytes and erythrocytes may leak miRNAs into plasma (Pritchard et al., 2012). This possibility was assessed in five steps. Firstly, spectrometric assessment showed that erythrocytes-specific peaks corresponding to oxy- and deoxy-hemoglobin (Zijlstra and Buursma, 1997) and peaks corresponding to free hemoglobin (Kirschner et al., 2011) were spectrometrically undetectable in plasma samples (Supplementary Figure 2a). Secondly, the erythrocyte-specific mRNA encoding SLC4A1, the band-3 trans-membrane protein, was expressed in erythrocytes but not leukocytes or plasma (Supplementary figure 2b). Thirdly, the highly abundant nuclear RNA, U6 snRNA was 4.3 × 10³–fold more highly expressed in leukocytes compared to plasma of non-pregnant ewes (p<1.23E-06). Fourthly, miRNAs that were previously identified as enriched in erythrocytes, lymphocytes or myeloid cells (Kirschner et al., 2011; Pritchard et al., 2012), were found to be enriched in erythrocyte (200- to 6,500-fold) and leukocyte samples (20- to 470-fold), relative to plasma samples (Supplementary Figure 2c). Finally, to further examine the specificity of plasma miRNA profiles, we compared the expression of erythrocyte and leukocyte miRNAs, and cirmiRNAs in non-pregnant female ewes to cirmiRNA expression in control third trimester-equivalent pregnant ewes and control newborn lamb. Statistical analyses indicate that 55.66% (418/751 miRNAs from panels 1 and 2, Supplementary Data 1) of miRNAs were significantly different when controlling for FDR (α=0.05), suggesting high variance in miRNA expression between blood compartments (erythrocytes, leukocytes and plasma), compared to within-compartment variance. Cluster analysis by sample showed that both erythrocyte and leukocyte miRNAs were dissimilar to cirmiRNAs obtained from all sources, and that cirmiRNA profiles in the newborn lamb were most closely related to cirmiRNA profiles in third trimester-equivalent pregnant ewes (Figure 2a). Clustering by miRNAs showed a similar outcome, that most statistically significant miRNAs could be broadly clustered into two groups, those that were expressed at low levels in erythrocytes and leukocytes, and a high levels in plasma (yellow bar), and those that exhibited high expression in cells relative to plasma (blue bar).
Figure 2.
Evidence for distinct cellular (leukocyte and erythrocyte) and plasma miRNA expression profiles. (a) MiRNAs that passed FDR-corrected ANOVAs (α=0.05) were subjected to Euclidean Cluster analysis with average linkage and rows centering on miRNAs, showing that leukocyte and erythrocyte miRNAs were distinct from plasma miRNAs. (b,c) Principal component analysis of both panel 1 and 2 miRNAs (ΔCTs) showed that PCA(component-1) separated leukocyte and erythrocyte miRNAs from all plasma miRNA samples, while PCA(component-2) separated the non-pregnant ewe from both the pregnant ewe and the newborn lamb. CirmiRNA samples from the pregnant ewe at GD132 were most similar to plasma samples from neonatal lamb on postnatal day 1. (d) Expression of miR-103 in Panel 1 and Panel 2. Data (mean±SEM) expressed as 2^-ΔΔCT (where ΔΔCT = ΔCTsample-meanΔCTReference_Group, and the meanΔCTReference_Group was the mean ΔCT in leukocytes). Sample size = 6 each for erythrocyte, leukocyte, non pregnant ewe and lamb plasma and = 4 for pregnant ewe plasma.
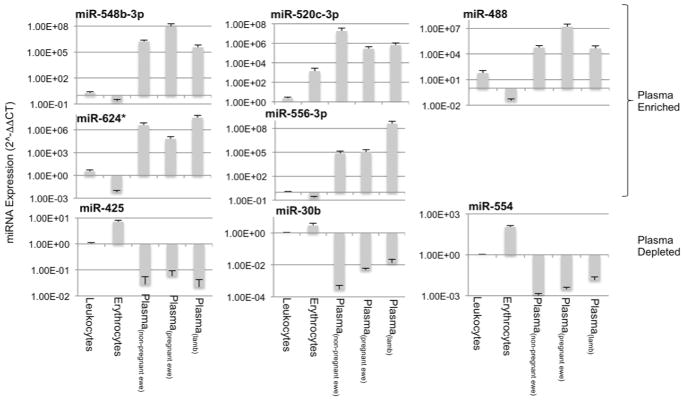
PCA of statistically significant miRNAs shows that PCA(component-1) (Comp. 1, Figure 2b), which accounts for most of the variability, discriminates between cellular (erythrocyte and leukocyte) miRNAs and all plasma miRNA samples. PCA(component-1) miRNAs like miR548b-3p, and miR-548b-3p were expressed at higher levels in plasma compared to leukocytes and erythrocytes, whereas miRNAs like miR-30b were expressed at lower levels in plasma compared to leukocytes and erythrocytes (Figure 3 shows additional examples of PCA(component-1) loaded miRNAs, for fold-change values relative to leukocytes, see Supplementary Figure 3a). Importantly, in non-pregnant female samples, two Panel-2 miRNAs, miR-1264, miR-124*, were undetected in leukocytes, but detected in plasma, and several miRNAs including for example, miR-224*, were detected in leukocytes, but not in plasma (Supplementary Data 1). These data collectively indicate that cirmiRNAs constitute a distinct, unique pool. Additionally, PCA(component-2) discriminates between plasma samples from non-pregnant ewes compared to both pregnant ewes and lamb, (Comp.2, Figure 2) but was unable to discriminate between lamb and pregnant ewes. This indicates that cirmiRNAs of the ewe near the end of pregnancy are similar to cirmiRNA content of the newborn lamb. These data show firstly, that damaged leukocytes and erythrocytes are not the source of cirmiRNAs. Secondly, cirmiRNA profiles change with pregnancy. Thirdly, cirmiRNA profiles in the newborn lamb are similar to the profile in the pregnant dam at the end of the third trimester-equivalent period.
Figure 3.
Expression patterns of sample PCA component-1, -2 and -3 miRNAs in leukocyte, erythrocyte and plasma miRNAs. Data (mean±SEM) are expressed as 2^-ΔΔCT (where ΔΔCT = ΔCTsample-meanΔCTReference_Group, and the meanΔCTReference_Group was the mean ΔCT in leukocytes).
Lastly, these data provide evidence for measurement reliability. Two miRNAs, miR-103 and miR-199, represented within the content of both panel 1 and 2, exceeded the FDR criterion of α=0.05. MiR-103 loads onto PCA(component-1) in both panels 1 and 2, discriminating similarly between plasma and cellular miRNAs (Figures 2b and 2c). Figure 2d shows that in panels 1 and 2, miR-103 is significantly overexpressed in erythrocytes and reduced in plasma, compared to leukocytes. Further analysis (Supplementary Figure 2d) shows high intra-sample correlation for miR-103 and miR-199 expression on panels 1 and 2 (Pearson’s r=0.92, p<4.02E-11 and r=0.8, p<1.42E-06 respectively).
Ethanol exposure results in significant changes in cirmiRNAs in third trimester-equivalent pregnant ewes and in newborn lambs
Ethanol exposure resulted in decreased plasma RNA content (F(1,20)=7.26, p<0.014). Post-hoc examination of the data showed that the ethanol-exposed ewe specifically exhibited decreased plasma RNA content (p<0.004, Figure 4), without a persistent effect in the ethanol-exposed lamb.
Figure 4.
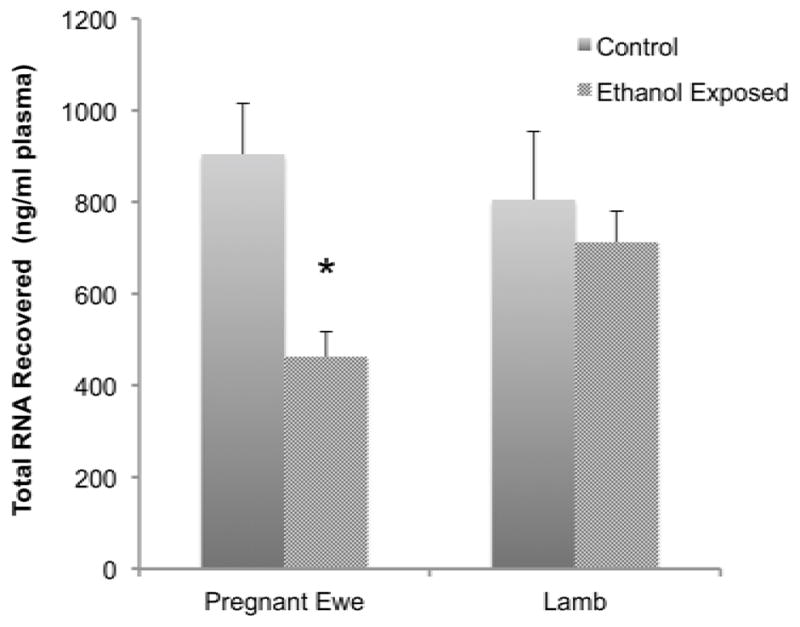
Plasma RNA content in control and ethanol exposed ewes and neonatal lambs. Data shows that in utero ethanol exposure resulted in a significant decrease in maternal plasma RNAs. Data expressed as mean±SEM.
Analysis of cirmiRNA expression in control and ethanol-exposed pregnant ewes and lambs showed that a total of 7.3% of sampled cirmiRNAs (52/378 miRNAs from panel 1 and 3/373 from panel 2, Supplementary Data 2) were significantly altered as a function of treatment, with FDR-corrected α=0.05. Panel-2 contributed only three miRNAs, miR-432*, miR-600, and miR-548c-5p, to the total pool of regulated cirmiRNAs, indicating that common rather than rare cellular miRNAs contribute to the cirmiRNA response to alcohol exposure. However, panel-2 also contained 8 additional cirmiRNAs, like miR-190b (Supplementary Data 2) that were expressed at high levels in the control pregnant ewe, but completely undetectable in the ethanol-exposed ewe (and therefore excluded from statistical analysis). These cirmiRNAs may constitute binary biomarkers for maternal alcohol exposure.
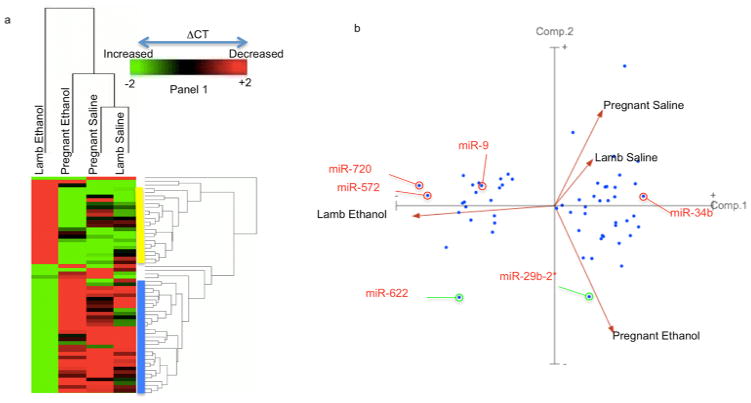
Hierarchical clustering of panel 1 miRNAs by sample (Figure 5a) showed that the cirmiRNA profiles from saline control third-trimester pregnant ewes and newborn lambs were most similar to each other, and that the next closest relationship was with samples from ethanol-exposed pregnant ewes. The cirmiRNA profiles newborn lambs exposed in utero to ethanol were the most dissimilar to all other groups. Clustering by panel 1 miRNAs (Figure 5a) showed two main groups of cirmiRNAs that were induced (blue bar), or suppressed (yellow bar) in the newborn lamb exposed in utero to ethanol, compared to all other groups.
Figure 5.
Effects of maternal ethanol exposure on cirmiRNA profiles in 3rd-trimester-equivalent pregnant ewe and newborn lamb. (a) CirmiRNAs that passed FDR-corrected ANOVAs (α=0.05) were subjected to Euclidean Cluster analysis with average linkage and rows centering on miRNAs, showing that the in utero ethanol-exposed newborn lamb was different from all other groups. (b) PCA(component-1) separated the in utero ethanol exposed lamb from all other groups, whereas PCA(component-2) separated the ethanol-exposed pregnant ewe from both control groups (pregnant ewe and newborn lamb). Sample size = 4 each for ethanol-treated and control pregnant ewes and = 6 each for control and in utero ethanol-treated lamb.
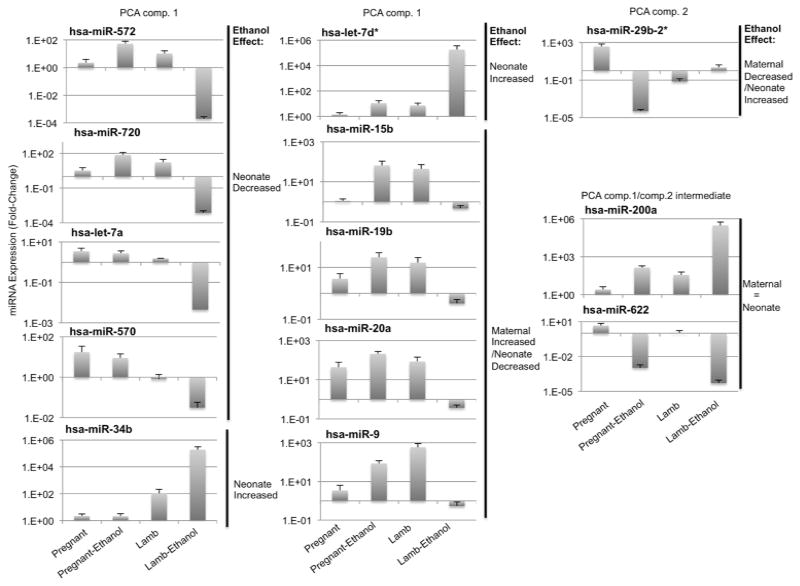
PCA of panel-1 miRNAs showed that PCA(component-1), accounting for 72% of the variance, discriminated between prenatally ethanol-exposed lambs and all other groups (Figure 5b). This indicates that the largest variance in cirmiRNA expression in the dataset was due to the effects of in utero ethanol exposure in the neonatal lamb. PCA(component-2), accounting for 18% of the variance, separated the pregnant ethanol-exposed ewe from both saline-treated control groups. In contrast, PCA(component 3), accounting for 7% the variance in the dataset, separated the two saline control groups (Supplementary Figure 4), indicating that the cirmiRNA complement of the third trimester-equivalent pregnant ewe and the newborn lamb are similar to each other. PCA(component-1) miRNAs, like miR-720 and miR-572 were suppressed, while miR-34b was induced in the plasma of newborn lambs exposed in utero to ethanol, compared to all other groups (Figure 6, for fold-change values, see Supplementary Figure 3b). Other PCA(component-1) miRNAs additionally discriminated between ethanol exposure in the pregnant ewe and in utero exposure in the newborn lamb. For example, cirmiRNAs like miR-9, miR-15b, -19b, and -20a were induced in the ethanol exposed pregnant ewe, but suppressed in the ethanol-exposed lamb (Figure 6). In silico analysis (DIANA-mirpath) indicated that PCA(component-1) miRNAs are significantly associated with developmentally relevant signal transduction pathways including PI3k-Akt, Neurotrophin and Wnt signaling pathways (Supplementary Data 3). These predicted associations between PCA(component-1) miRNAs and target pathways need to be validated, but they collectively advance a hypothesis that these miRNAs constitute an ethanol-sensitive endocrine signal for fetal and neonatal growth. Other PCA(component-2) miRNAs like miR29b-2* discriminated between ethanol exposed ewes on one hand and control ewes and lambs on the other. In contrast miRNAs like miR-622, and miR-200a, which exhibit an intermediate fit between PCA(component-1) and PCA(component-2), were suppressed and induced respectively in ethanol exposed pregnant dams as well as newborn lambs (Figure 6). To determine the possibility of using PCA(component-1) cirmiRNAs as biomarkers, we conducted ROC analysis for miR-9, miR-15b, miR-19b and miR-20a. ‘Area under the curve’ (AUC) values for these selected miRNAs were greater than 0.938 + 0.09 (all asymptotic significance values, p<0.043), for both the pregnant ewe and the lamb. These data indicate that PCA(component-1) cirmiRNAs are potentially sensitive and specific measures of alcohol exposure.
Figure 6.
Expression patterns of sample PCA component-1, and -2 cirmiRNAs. Data (mean±SEM) are expressed as 2^-ΔΔCT (where ΔΔCT = ΔCTsample-meanΔCTReference_Group, and the meanΔCTReference_Group was the mean ΔCT in saline-treated pregnant females.
One caveat to the data showing that in utero ethanol exposure had a significant persistent effect on lamb plasma miRNAs is that we were unable to control the sex of the lambs assigned to treatment and control groups. Because pregnant ewes were assigned to ethanol or control groups at GD4, i.e., before fetal sex determination was possible, there was an asymmetric distribution of sexes in control (2 male and 4 female) and ethanol exposed groups (5 male and 1 female). Therefore, to assess the effect of sex on cirmiRNA profiles, we re-grouped panel-1 and panel-2 miRNAs by sex (7 male vs. 5 female neonatal lambs). T-tests comparing cirmiRNA profiles in lambs categorized by sex, were computed and compared to T-tests between lambs categorized by ethanol-exposure. With an uncorrected p<0.05 cutoff, ethanol exposure resulted in ~5-fold more miRNAs, that reached criterion compared to sex, with only 2 miRNAs shared between each set of comparisons. With an FDR corrected α=0.05, or even with a relaxed cutoff of α=0.3, there were no statistically significant differences due to sex in either panel-1 or panel-2 miRNAs, whereas 42 miRNAs met criterion (FDR-corrected α =0.05) in the in utero ethanol exposed lamb compared to control. Box-plots for the distribution of cirmiRNA expression by sex are shown in Supplementary Figure 5. While these data indicate that sex of the neonatal lamb did not significantly contribute to differences in cirmiRNA content, and consequently, to the ethanol response, this assumption needs to be verified in future, in carefully stratified human studies.
cirMiRNA/miRNA* and cir5p/3p mRNA ratios
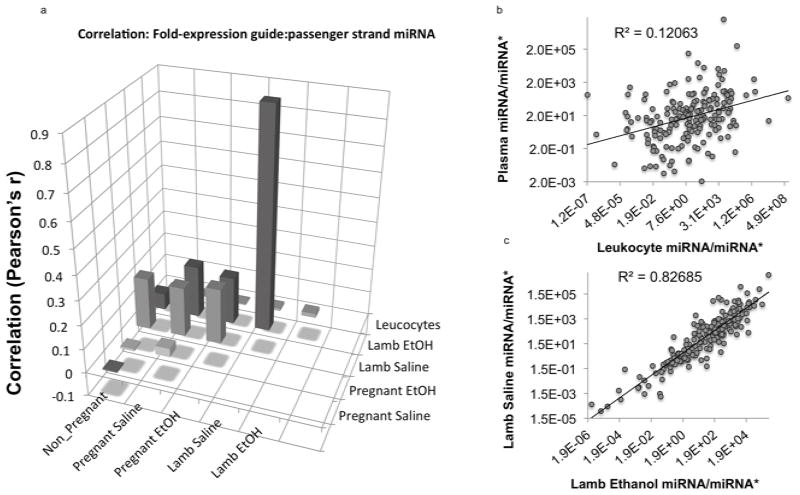
Within the cytoplasm, Dicer cleaves pre-miRNA transcripts to generate shorter 5′ and 3′ single stranded RNA molecules (miRNA-3p and miRNA-5p). In many cases one strand, the guide strand, is typically retained by cells, while the other, the passenger strand or miRNA*, is thought to be preferentially degraded (Matranga et al., 2005). Changes in the retention of passenger strand miRNAs, resulting in altered miRNA/miRNA* ratios have been shown to result in altered regulation of mRNA targets (Yang et al., 2011). Because of inadequate ovine data, we used sequencing data for human miRNAs from miRBase (www.mirbase.org, release 19) to identify miRNA/miRNA* pairs in our dataset of 5p and 3p cirmiRNAs. CirmiRNA pairs that could not be assigned to guide and passenger strand identities in miRBase were analyzed separately. Ratios of miRNA/miRNA* and 5p-miRNA/3p-mRNA were determined. Pearson’s correlation analyses indicated a low correlation in miRNA/miRNA* ratios (Figure 7a,b, Pearson’s r=−0.006, p<0.94) and 5p/3p (r=−0.053, p<0.79) between plasma and leukocytes derived from non-pregnant females, again indicating that plasma miRNAs are not derived from cell damage. There was also no correlation in cirmiRNA/miRNA* (Figure 7a, Pearson’s r=0.036, p<0.63) or cir5′/3′ (r=0.217, p<0.29) ratios between pregnant ethanol-exposed and control ewes. This suggests that ethanol exposure results in altered maternal miRNA processing and guide strand selection of secreted miRNAs. In contrast, to the low correlation between control and ethanol exposed mothers, there was a strong, significant correlation between cirmiRNA/miRNA* ratios in control and in utero ethanol exposed lambs (Figure 7a,c, r=0.9, p<0.0000001), indicating that in utero ethanol exposure did not persistently alter miRNA processing or guide strand selection in tissues that contribute cirmiRNA/miRNA* pairs to neonatal plasma. Interestingly, there was no correlation between control and in utero ethanol exposed lamb cir5p/3p mRNA ratios (r=0.047, p<0.818), indicating that plasma expression of miRNA 5p/3p pairs that are free from active guide strand selection is dysregulated, in contrast to miRNA/miRNA* pairs.
Figure 7.
Analysis of the ratio of guide to passenger strand (miRNA/miRNA*) expression. (a) Bar graph of correlation matrix. ‘Y’ axis indicates Pearson’s ‘r’. Data show that leukocyte miRNA/miRNA* ratios do not correlate with ratios in plasma samples. There was also not a statistically significant correlation between plasma miRNA samples from control and ethanol-exposed pregnant ewes (r=0.036, p<0.63), but a strong correlation between control and in utero ethanol exposed neonatal lamb r=0.9, p<0.0000001). (b,c) miRNA/miRNA* correlations between (b) plasma and leukocytes, and (c) between control and in utero exposed neonatal lambs.
Despite overall high correlation in cirmiRNA/miRNA* ratios between control and ethanol-exposed lambs, individual cirmiRNA/miRNA* ratios may be selectively altered by ethanol. We reported above, that cirmiRNA-432* was significantly increased in the ethanol-exposed lamb. This miRNA is localized within the RTL1 imprinted genomic locus, associated with fetal and neonatal growth defects (Kagami et al., 2008). We therefore examined the effects of ethanol exposure on the ratio of miR432/miR432* in pregnant ewes and newborn lambs. Analysis of variance indicated an overall statistically significant effect on this ratio (F(3,16)=7.52, p<0.002), and post-hoc tests indicated that the control lamb plasma expressed a significantly higher ratio of miR-432/432* compared to the ethanol-exposed lamb, and pregnant control and ethanol-exposed ewes (Figure 8, all ‘p’ values < 0.02). These data indicated that the newborn lamb plasma exhibits miR-432 guide strand dominance, but this dominance is reduced in the plasma of the pregnant dam, and in the in utero ethanol-exposed lamb.
Figure 8.
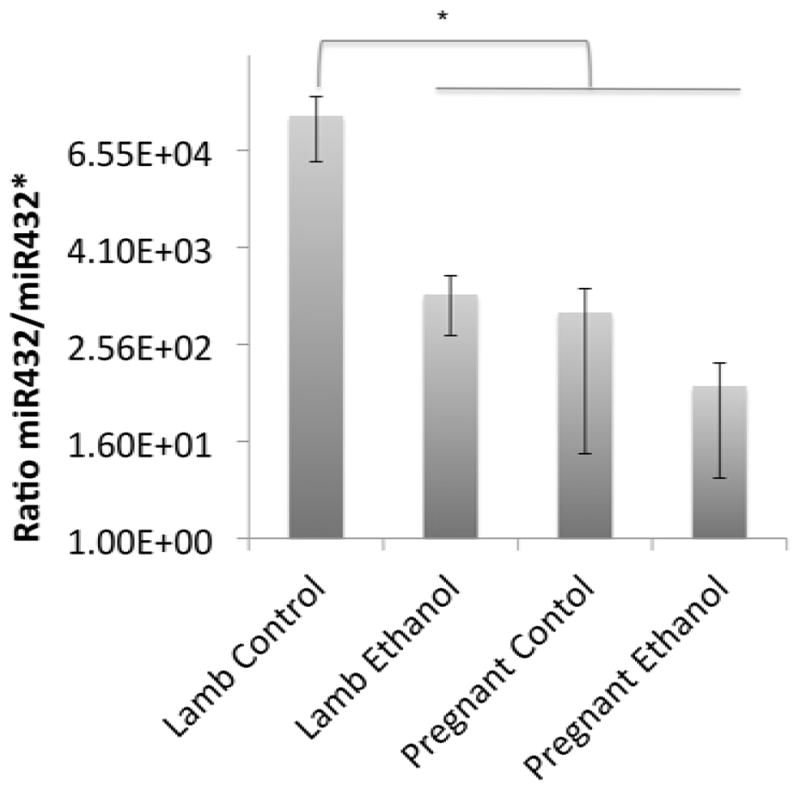
Ratio of miR432/miR432* expression in neonatal lamb relative to pregnant ewe. Asterisk indicates statistically significant comparison.
Discussion
CirmiRNAs have emerged as diagnostic biomarkers in a variety of diseases, including cancer (Mitchell et al., 2008), neurological diseases (Go et al., 2008; Siegel et al., 2012), brain damage (Redell et al., 2010), and alcoholic liver damage (Bala et al., 2012). We (Balaraman et al., 2012; Pappalardo-Carter et al., 2013; Sathyan et al., 2007) and others (Tal et al., 2012; Wang et al., 2009) showed that ethanol influences cellular miRNA expression during development. We therefore tested the hypothesis that alcohol exposure during pregnancy also alters cirmiRNAs in the pregnant mother, and leads to persistent alterations in cirmiRNAs, in the neonate.
An initial screen indicated that blood cells (leukocytes and erythrocytes) and plasma express different miRNAs. Moreover, erythrocyte-specific mRNAs and hemoglobin could not be observed in plasma. Therefore, at least under normal physiological conditions, cirmiRNAs are a unique pool, not derived from leaky blood cells. However, alcoholism is associated with hemolytic anemias (Ballard, 1997), and consequently, despite lack of evidence for contamination in the ovine model, cirmiRNAs in alcoholic mothers may well include erythrocyte miRNAs. CirmiRNA profiles were also significantly altered by pregnancy. Surprisingly, the cirmiRNA complement of the pregnant ewe was most similar to the newborn lamb. Such similarity raises a strong possibility that miRNAs are shared between mother and fetus. Placental trophoblast RNA products (Go et al., 2008) and miRNAs (Chim et al., 2008) are indeed shed into maternal circulation, and the possibility that the maternal compartment sheds miRNAs into fetal circulation also deserves consideration. Moreover, it is likely that these miRNAs are functional, since secreted miRNAs have been shown to mediate intercellular communication (Montecalvo et al., 2012), and to promote developmentally important biological endpoints like angiogenesis (Zhang et al., 2010). Consequently, shared maternal-fetal cirmiRNAs may constitute a novel endocrine signal that coordinates maternal-fetal physiology.
Binge ethanol exposure during pregnancy resulted in decreased maternal plasma RNA content and significant alterations in cirmiRNAs, 24 hours following the final binge, showing that cirmiRNAs are useful biomarkers for maternal ethanol exposure. MiRNAs like miR-190b, which were completely suppressed in the ethanol-exposed ewe, are also decreased by the opioid agonist fentanyl (Zheng et al., 2010), suggesting that they represent a common signature for drug exposure. In contrast, other suppressed cirmiRNAs like miR-29b-2* may serve as a specific biomarker for ethanol exposure during pregnancy.
Significant cirmiRNA alterations due to three-trimester-equivalent in utero alcohol exposure were also observed in the neonatal lamb, i.e., 15–17 days following the last exposure episode. This altered cirmiRNA profile represents a persistent effect of prenatal alcohol exposure. Moreover, statistical comparisons between lamb and mother showed that plasma samples of the in utero ethanol exposed newborn lamb were most different from all other groups. PCA(component-1) miRNAs represent a lamb-specific response to in utero alcohol exposure and, as supported by ROC analysis, serve as sensitive and specific biomarkers for an exposure history. It is important to note that the newborn lamb is developmentally more mature than the end-of-third-trimester human neonate. It is possible therefore, that cirmiRNA changes due to in utero ethanol exposure may also persist in the human for an extended developmentally equivalent period.
Importantly while PCA(component-1) cirmiRNAs like miR-572 and miR-720 were decreased in the lamb compared to all other groups, other cirmiRNAs like miR-34b were significantly induced in the lamb by previous in utero ethanol exposure. These data imply that the neonate’s cirmiRNA response does not passively mirror the pregnant ewe’s response. Moreover, PCA(component-1) cirmiRNAs also appear to constitute a unique disease signature that distinguishes between fetal alcohol exposure, and several other neurological and psychiatric disorders including multiple sclerosis (Siegel et al., 2012), schizophrenia (Lai et al., 2011), and neural tube defects (Gu et al., 2012). These data support the feasibility of using cirmiRNA profiles in the neonate, as a unique biomarker of fetal alcohol exposure.
Importantly, cirmiRNAs are also functional (Zhang et al., 2010), and may therefore contribute to the pathophysiology of FASD. For example, members of the miR-34 family inhibit osteoblast proliferation and differentiation (Wei et al., 2012) and consequently the persistent induction of cirmiR-34b in the in utero ethanol exposed neonate, would be predicted to result in decreased skeletal growth, a feature associated with in utero alcohol exposure in animal models (Sawant et al., 2013) and in humans (Habbick et al., 1998).
Other PCA(component-1) cirmiRNAs like miR-9, miR-15b, and members of the miR17–92 cluster were induced in the pregnant ethanol-exposed ewe, but decreased in the neonate. Clearly. cirmiRNA responses in the neonate do not passively reflect maternal responses to ethanol, though some do represent common targets of maternal and neonatal vulnerability. For example, mir-15b expression is decreased in placenta following preeclampsia (Mayor-Lynn et al., 2011), a condition which increases the risk for both maternal mortality and fetal growth retardation. Continued decreased expression of this miRNA in plasma of the in utero ethanol-exposed neonate may be a biomarker for earlier fetal as well as maternal distress. A second example is miR-9, which is important for neural stem cell maturation and brain development (Leucht et al., 2008; Shibata et al., 2011). MiR-9 knockdown in a zebrafish model resulted in microcephaly (Pappalardo-Carter et al., 2013). In utero ethanol resulted in decreased plasma miR-9 in lamb, consistent with several reports showing that ethanol decreases the expression of miR-9 in developmental models (Balaraman et al., 2012; Pappalardo-Carter et al., 2013; Sathyan et al., 2007; Tal et al., 2012). In contrast, the observed induction of miR-9 in maternal plasma following ethanol exposure recapitulates other findings (Pietrzykowski et al., 2008), that miR-9 induction in the adult mediates acute tolerance to alcohol. Consequently, the increased cirmiR-9 expression in the ethanol-exposed mother may represent a peripheral trace of neural tolerance, while cirmiR-9 suppression in neonatal plasma may represent a persistent trace of ethanol’s suppressive effects on fetal brain growth. One caveat to these data showing a persistent effect of in utero ethanol exposure on neonatal plasma miRNAs, is that we were unable, in this uniparous model of pregnancy, to control for fetal sex, because ethanol treatment was initiated before sex determination was technically feasible. Re-categorizing animals by sex rather than treatment showed that none of the assessed, FDR-corrected miRNAs were expressed in a sexually dimorphic manner in neonatal plasma. These data however, do not eliminate the possibility of an interaction between sex and ethanol exposure history, a factor that needs to be assessed further. Analysis of cirmiRNA/miRNA* and cirmiRNA-5p/3p ratios indicates that in the pregnant dam, ethanol appears to directly interfere with the process of guide and passenger strand selection in cells that contribute cirmiRNAs to plasma. However, this effect does not appear to persist within the plasma compartment of the neonate. In this context, the persistent decrease in the ratio of cirmiR432/miR432* in the ethanol exposed neonate is very interesting. The mechanism underlying selective alteration of miRNA/miRNA* ratios is unclear. However, miR432/432* is coded within an imprinted genomic region which includes genes like DIO3, which have been shown to be increased in placenta following in utero ethanol exposure and have also been identified as potential biomarkers of ethanol exposure (Shukla et al., 2011).
In summary, these preclinical studies show that cirmiRNAs are candidate biomarkers for maternal ethanol exposure, as well as biomarkers in the neonate for in utero, fetal exposure. The specific cohort of ethanol-responsive miRNAs may be species specific, though some cirmiRNAs like miR-9 may well be a conserved biomarker for fetal and adult exposure. Moreover, in light of data on the effects of miRNAs like miR-9 on fetal development, cirmiRNA profiles in the neonate may represent a persistent trace of fetal alcohol ‘effect’ rather than exposure itself. This important concept is supported by a recent report demonstrating an association in the adult, between cirmiRNAs and ethanol-induced liver damage (Bala et al., 2012), and suggests that cirmiRNAs may serve as biomarkers for brain and organ damage following in utero ethanol exposure. Finally, emerging evidence for cirmiRNA functionality suggests that shared maternal-fetal cirmiRNAs, particularly PCA(component-1) miRNAs, may constitute vulnerable endocrine signals that coordinate maternal-fetal physiology.
Supplementary Material
Acknowledgments
We would like to dedicate this paper to the late Dr. Timothy Cudd, and to acknowledge his important role and significant contributions to this study. This study was supported by the Collaborative initiative on Fetal Alcohol Spectrum Disorders (CIFASD) with a pilot grant from the U24 AA014811 administrative core (PI, Edward P. Riley) to RCM/TAC, and by NIAAA Grants R01AA013440 (RCM), U01AA17120 (SEW) and K08AA18166 (SEW), and by a pilot grant from the TAMHSC, Women’s health in neuroscience program to RCM. We thank Caitlin Harrison, Alexandra Bourgis and Clint Simples for assistance with data management, and the research assistants and student workers in our laboratories for technical assistance.
References
- Arroyo JD, Chevillet JR, Kroh EM, Ruf IK, Pritchard CC, Gibson DF, Mitchell PS, Bennett CF, Pogosova-Agadjanyan EL, Stirewalt DL, Tait JF, Tewari M. Argonaute2 complexes carry a population of circulating microRNAs independent of vesicles in human plasma. Proc Natl Acad Sci U S A. 2011;108(12):5003–8. doi: 10.1073/pnas.1019055108. [DOI] [PMC free article] [PubMed] [Google Scholar]
- Bakhireva LN, Savich RD, Raisch DW, Cano S, Annett RD, Leeman L, Garg M, Goff C, Savage DD. The Feasibility and Cost of Neonatal Screening for Prenatal Alcohol Exposure by Measuring Phosphatidylethanol in Dried Blood Spots. Alcohol Clin Exp Res. 2013 doi: 10.1111/acer.12045. [DOI] [PMC free article] [PubMed] [Google Scholar]
- Bala S, Petrasek J, Mundkur S, Catalano D, Levin I, Ward J, Alao H, Kodys K, Szabo G. Circulating microRNAs in exosomes indicate hepatocyte injury and inflammation in alcoholic, drug-induced, and inflammatory liver diseases. Hepatology. 2012;56(5):1946– 57. doi: 10.1002/hep.25873. [DOI] [PMC free article] [PubMed] [Google Scholar]
- Balaraman S, Winzer-Serhan UH, Miranda RC. Opposing actions of ethanol and nicotine on microRNAs are mediated by nicotinic acetylcholine receptors in fetal cerebral cortical-derived neural progenitor cells. Alcohol Clin Exp Res. 2012;36(10):1669– 77. doi: 10.1111/j.1530-0277.2012.01793.x. [DOI] [PMC free article] [PubMed] [Google Scholar]
- Ballard HS. The hematological complications of alcoholism. Alcohol Health Res World. 1997;21(1):42–52. [PMC free article] [PubMed] [Google Scholar]
- Barry JS, Anthony RV. The pregnant sheep as a model for human pregnancy. Theriogenology. 2008;69(1):55–67. doi: 10.1016/j.theriogenology.2007.09.021. [DOI] [PMC free article] [PubMed] [Google Scholar]
- Caetano R, Ramisetty-Mikler S, Floyd LR, McGrath C. The epidemiology of drinking among women of child-bearing age. Alcohol Clin Exp Res. 2006;30(6):1023–30. doi: 10.1111/j.1530-0277.2006.00116.x. [DOI] [PubMed] [Google Scholar]
- Centers for Disease Control and Prevention (CDC) Alcohol use and binge drinking among women of childbearing age--United States, 2006–2010. MMWR Morb Mortal Wkly Rep. 2012;61(28):534–8. [PubMed] [Google Scholar]
- Chim SS, Shing TK, Hung EC, Leung TY, Lau TK, Chiu RW, Lo YM. Detection and characterization of placental microRNAs in maternal plasma. Clin Chem. 2008;54(3):482– 90. doi: 10.1373/clinchem.2007.097972. [DOI] [PubMed] [Google Scholar]
- Ebrahim SH, Diekman ST, Floyd RL, Decoufle P. Comparison of binge drinking among pregnant and nonpregnant women, United States, 1991–1995. Am J Obstet Gynecol. 1999;180(1 Pt 1):1–7. doi: 10.1016/s0002-9378(99)70139-0. [DOI] [PubMed] [Google Scholar]
- Gallo A, Tandon M, Alevizos I, Illei GG. The majority of microRNAs detectable in serum and saliva is concentrated in exosomes. PLoS One. 2012;7(3):e30679. doi: 10.1371/journal.pone.0030679. [DOI] [PMC free article] [PubMed] [Google Scholar]
- Gladstone J, Nulman I, Koren G. Reproductive risks of binge drinking during pregnancy. Reprod Toxicol. 1996;10(1):3–13. doi: 10.1016/0890-6238(95)02024-1. [DOI] [PubMed] [Google Scholar]
- Go AT, Visser A, van Dijk M, Mulders MA, Eijk P, Ylstra B, Blankenstein MA, van Vugt JM, Oudejans CB. A novel method to identify syncytiotrophoblast-derived RNA products representative of trisomy 21 placental RNA in maternal plasma. Methods Mol Biol. 2008;444:291–302. doi: 10.1007/978-1-59745-066-9_23. [DOI] [PubMed] [Google Scholar]
- Gu H, Li H, Zhang L, Luan H, Huang T, Wang L, Fan Y, Zhang Y, Liu X, Wang W, Yuan Z. Diagnostic role of microRNA expression profile in the serum of pregnant women with fetuses with neural tube defects. J Neurochem. 2012;122(3):641–9. doi: 10.1111/j.1471-4159.2012.07812.x. [DOI] [PubMed] [Google Scholar]
- Habbick BF, Blakley PM, Houston CS, Snyder RE, Senthilselvan A, Nanson JL. Bone age and growth in fetal alcohol syndrome. Alcohol Clin Exp Res. 1998;22(6):1312–6. [PubMed] [Google Scholar]
- Hellemans KG, Sliwowska JH, Verma P, Weinberg J. Prenatal alcohol exposure: fetal programming and later life vulnerability to stress, depression and anxiety disorders. Neurosci Biobehav Rev. 2010;34(6):791–807. doi: 10.1016/j.neubiorev.2009.06.004. [DOI] [PMC free article] [PubMed] [Google Scholar]
- Jones KL, Smith DW. The fetal alcohol syndrome. Teratology. 1975;12(1):1–10. doi: 10.1002/tera.1420120102. [DOI] [PubMed] [Google Scholar]
- Kagami M, Sekita Y, Nishimura G, Irie M, Kato F, Okada M, Yamamori S, Kishimoto H, Nakayama M, Tanaka Y, Matsuoka K, Takahashi T, Noguchi M, Tanaka Y, Masumoto K, Utsunomiya T, Kouzan H, Komatsu Y, Ohashi H, Kurosawa K, Kosaki K, Ferguson-Smith AC, Ishino F, Ogata T. Deletions and epimutations affecting the human 14q32.2 imprinted region in individuals with paternal and maternal upd(14)-like phenotypes. Nat Genet. 2008;40(2):237–42. doi: 10.1038/ng.2007.56. [DOI] [PubMed] [Google Scholar]
- Kirschner MB, Kao SC, Edelman JJ, Armstrong NJ, Vallely MP, van Zandwijk N, Reid G. Haemolysis during sample preparation alters microRNA content of plasma. PLoS One. 2011;6(9):e24145. doi: 10.1371/journal.pone.0024145. [DOI] [PMC free article] [PubMed] [Google Scholar]
- Kvigne VL, Randall B, Simanton EG, Brenneman G, Welty TK. Blood alcohol levels for American Indian mothers and newborns. Pediatrics. 2012;130(4):e1015–8. doi: 10.1542/peds.2011-1400. [DOI] [PubMed] [Google Scholar]
- Lai CY, Yu SL, Hsieh MH, Chen CH, Chen HY, Wen CC, Huang YH, Hsiao PC, Hsiao CK, Liu CM, Yang PC, Hwu HG, Chen WJ. MicroRNA expression aberration as potential peripheral blood biomarkers for schizophrenia. PLoS One. 2011;6(6):e21635. doi: 10.1371/journal.pone.0021635. [DOI] [PMC free article] [PubMed] [Google Scholar]
- Leucht C, Stigloher C, Wizenmann A, Klafke R, Folchert A, Bally-Cuif L. MicroRNA-9 directs late organizer activity of the midbrain-hindbrain boundary. Nat Neurosci. 2008;11(6):641–8. doi: 10.1038/nn.2115. [DOI] [PubMed] [Google Scholar]
- Matlow JN, Aleksa K, Lubetsky A, Koren G. The detection and quantification of ethyl glucuronide in placental tissue and placental perfusate by headspace solid-phase microextraction coupled with gas chromatography-mass spectrometry. J Popul Ther Clin Pharmacol. 2012;19(3):e473–82. [PubMed] [Google Scholar]
- Matranga C, Tomari Y, Shin C, Bartel DP, Zamore PD. Passenger-strand cleavage facilitates assembly of siRNA into Ago2-containing RNAi enzyme complexes. Cell. 2005;123(4):607–20. doi: 10.1016/j.cell.2005.08.044. [DOI] [PubMed] [Google Scholar]
- Mattson SN, Crocker N, Nguyen TT. Fetal alcohol spectrum disorders: neuropsychological and behavioral features. Neuropsychol Rev. 2011;21(2):81–101. doi: 10.1007/s11065-011-9167-9. [DOI] [PMC free article] [PubMed] [Google Scholar]
- May PA, Blankenship J, Marais AS, Gossage JP, Kalberg WO, Barnard R, De Vries M, Robinson LK, Adnams CM, Buckley D, Manning M, Jones KL, Parry C, Hoyme HE, Seedat S. Approaching the prevalence of the full spectrum of fetal alcohol spectrum disorders in a South african population-based study. Alcohol Clin Exp Res. 2013;37(5):818–30. doi: 10.1111/acer.12033. [DOI] [PMC free article] [PubMed] [Google Scholar]
- May PA, Gossage JP, Kalberg WO, Robinson LK, Buckley D, Manning M, Hoyme HE. Prevalence and epidemiologic characteristics of FASD from various research methods with an emphasis on recent in-school studies. Dev Disabil Res Rev. 2009;15(3):176–92. doi: 10.1002/ddrr.68. [DOI] [PubMed] [Google Scholar]
- Mayor-Lynn K, Toloubeydokhti T, Cruz AC, Chegini N. Expression profile of microRNAs and mRNAs in human placentas from pregnancies complicated by preeclampsia and preterm labor. Reprod Sci. 2011;18(1):46–56. doi: 10.1177/1933719110374115. [DOI] [PMC free article] [PubMed] [Google Scholar]
- Mitchell PS, Parkin RK, Kroh EM, Fritz BR, Wyman SK, Pogosova-Agadjanyan EL, Peterson A, Noteboom J, O’Briant KC, Allen A, Lin DW, Urban N, Drescher CW, Knudsen BS, Stirewalt DL, Gentleman R, Vessella RL, Nelson PS, Martin DB, Tewari M. Circulating microRNAs as stable blood-based markers for cancer detection. Proc Natl Acad Sci U S A. 2008;105(30):10513–8. doi: 10.1073/pnas.0804549105. [DOI] [PMC free article] [PubMed] [Google Scholar]
- Montecalvo A, Larregina AT, Shufesky WJ, Stolz DB, Sullivan ML, Karlsson JM, Baty CJ, Gibson GA, Erdos G, Wang Z, Milosevic J, Tkacheva OA, Divito SJ, Jordan R, Lyons-Weiler J, Watkins SC, Morelli AE. Mechanism of transfer of functional microRNAs between mouse dendritic cells via exosomes. Blood. 2012;119(3):756–66. doi: 10.1182/blood-2011-02-338004. [DOI] [PMC free article] [PubMed] [Google Scholar]
- Pappalardo-Carter DL, Balaraman S, Sathyan P, Carter ES, Chen WJ, Miranda RC. Suppression and Epigenetic Regulation of MiR-9 Contributes to Ethanol Teratology: Evidence from Zebrafish and Murine Fetal Neural Stem Cell Models. Alcohol Clin Exp Res. 2013 doi: 10.1111/acer.12139. In press. [DOI] [PMC free article] [PubMed] [Google Scholar]
- Perrotta S, Borriello A, Scaloni A, De Franceschi L, Brunati AM, Turrini F, Nigro V, del Giudice EM, Nobili B, Conte ML, Rossi F, Iolascon A, Donella-Deana A, Zappia V, Poggi V, Anong W, Low P, Mohandas N, Della Ragione F. The N-terminal 11 amino acids of human erythrocyte band 3 are critical for aldolase binding and protein phosphorylation: implications for band 3 function. Blood. 2005;106(13):4359–66. doi: 10.1182/blood-2005-07-2806. [DOI] [PubMed] [Google Scholar]
- Peterson J, Kirchner HL, Xue W, Minnes S, Singer LT, Bearer CF. Fatty acid ethyl esters in meconium are associated with poorer neurodevelopmental outcomes to two years of age. J Pediatr. 2008;152(6):788–92. doi: 10.1016/j.jpeds.2007.11.009. [DOI] [PMC free article] [PubMed] [Google Scholar]
- Pietrzykowski AZ, Friesen RM, Martin GE, Puig SI, Nowak CL, Wynne PM, Siegelmann HT, Treistman SN. Posttranscriptional regulation of BK channel splice variant stability by miR-9 underlies neuroadaptation to alcohol. Neuron. 2008;59(2):274–87. doi: 10.1016/j.neuron.2008.05.032. [DOI] [PMC free article] [PubMed] [Google Scholar]
- Popova S, Lange S, Burd L, Rehm J. Health care burden and cost associated with fetal alcohol syndrome: based on official Canadian data. PLoS One. 2012;7(8):e43024. doi: 10.1371/journal.pone.0043024. [DOI] [PMC free article] [PubMed] [Google Scholar]
- Pritchard CC, Kroh E, Wood B, Arroyo JD, Dougherty KJ, Miyaji MM, Tait JF, Tewari M. Blood cell origin of circulating microRNAs: a cautionary note for cancer biomarker studies. Cancer Prev Res (Phila) 2012;5(3):492–7. doi: 10.1158/1940-6207.CAPR-11-0370. [DOI] [PMC free article] [PubMed] [Google Scholar]
- Ramadoss J, Lunde ER, Pina KB, Chen WJ, Cudd TA. All three trimester binge alcohol exposure causes fetal cerebellar purkinje cell loss in the presence of maternal hypercapnea, acidemia, and normoxemia: ovine model. Alcohol Clin Exp Res. 2007;31(7):1252–8. doi: 10.1111/j.1530-0277.2007.00422.x. [DOI] [PubMed] [Google Scholar]
- Redell JB, Moore AN, Ward NH, 3rd, Hergenroeder GW, Dash PK. Human traumatic brain injury alters plasma microRNA levels. J Neurotrauma. 2010;27(12):2147–56. doi: 10.1089/neu.2010.1481. [DOI] [PMC free article] [PubMed] [Google Scholar]
- Sathyan P, Golden HB, Miranda RC. Competing interactions between micro-RNAs determine neural progenitor survival and proliferation after ethanol exposure: evidence from an ex vivo model of the fetal cerebral cortical neuroepithelium. J Neurosci. 2007;27(32):8546–57. doi: 10.1523/JNEUROSCI.1269-07.2007. [DOI] [PMC free article] [PubMed] [Google Scholar]
- Sawant OB, Ramadoss J, Hogan HA, Washburn SE. The Role of Acidemia in Maternal Binge Alcohol-Induced Alterations in Fetal Bone Functional Properties. Alcohol Clin Exp Res. 2013 doi: 10.1111/acer.12118. [DOI] [PMC free article] [PubMed] [Google Scholar]
- Shibata M, Nakao H, Kiyonari H, Abe T, Aizawa S. MicroRNA-9 regulates neurogenesis in mouse telencephalon by targeting multiple transcription factors. J Neurosci. 2011;31(9):3407–22. doi: 10.1523/JNEUROSCI.5085-10.2011. [DOI] [PMC free article] [PubMed] [Google Scholar]
- Shukla PK, Sittig LJ, Ullmann TM, Redei EE. Candidate placental biomarkers for intrauterine alcohol exposure. Alcohol Clin Exp Res. 2011;35(3):559–65. doi: 10.1111/j.1530-0277.2010.01373.x. [DOI] [PMC free article] [PubMed] [Google Scholar]
- Siegel SR, Mackenzie J, Chaplin G, Jablonski NG, Griffiths L. Circulating microRNAs involved in multiple sclerosis. Mol Biol Rep. 2012;39(5):6219–25. doi: 10.1007/s11033-011-1441-7. [DOI] [PubMed] [Google Scholar]
- Tal TL, Franzosa JA, Tilton SC, Philbrick KA, Iwaniec UT, Turner RT, Waters KM, Tanguay RL. MicroRNAs control neurobehavioral development and function in zebrafish. FASEB J. 2012;26(4):1452–1461. doi: 10.1096/fj.11-194464. [DOI] [PMC free article] [PubMed] [Google Scholar]
- Vickers KC, Palmisano BT, Shoucri BM, Shamburek RD, Remaley AT. MicroRNAs are transported in plasma and delivered to recipient cells by high-density lipoproteins. Nat Cell Biol. 2011;13(4):423–33. doi: 10.1038/ncb2210. [DOI] [PMC free article] [PubMed] [Google Scholar]
- Wang LL, Zhang Z, Li Q, Yang R, Pei X, Xu Y, Wang J, Zhou SF, Li Y. Ethanol exposure induces differential microRNA and target gene expression and teratogenic effects which can be suppressed by folic acid supplementation. Hum Reprod. 2009;24(3):562–79. doi: 10.1093/humrep/den439. [DOI] [PubMed] [Google Scholar]
- Wei J, Shi Y, Zheng L, Zhou B, Inose H, Wang J, Guo XE, Grosschedl R, Karsenty G. miR-34s inhibit osteoblast proliferation and differentiation in the mouse by targeting SATB2. J Cell Biol. 2012;197(4):509–21. doi: 10.1083/jcb.201201057. [DOI] [PMC free article] [PubMed] [Google Scholar]
- Yang JS, Phillips MD, Betel D, Mu P, Ventura A, Siepel AC, Chen KC, Lai EC. Widespread regulatory activity of vertebrate microRNA* species. RNA. 2011;17(2):312– 26. doi: 10.1261/rna.2537911. [DOI] [PMC free article] [PubMed] [Google Scholar]
- Zhang S, Zhao F, Wei C, Sheng X, Ren H, Xu L, Lu J, Liu J, Zhang L, Du L. Identification and characterization of the miRNA transcriptome of Ovis aries. PLoS One. 2013;8(3):e58905. doi: 10.1371/journal.pone.0058905. [DOI] [PMC free article] [PubMed] [Google Scholar]
- Zhang Y, Liu D, Chen X, Li J, Li L, Bian Z, Sun F, Lu J, Yin Y, Cai X, Sun Q, Wang K, Ba Y, Wang Q, Wang D, Yang J, Liu P, Xu T, Yan Q, Zhang J, Zen K, Zhang CY. Secreted monocytic miR-150 enhances targeted endothelial cell migration. Mol Cell. 2010;39(1):133–44. doi: 10.1016/j.molcel.2010.06.010. [DOI] [PubMed] [Google Scholar]
- Zheng H, Zeng Y, Zhang X, Chu J, Loh HH, Law PY. mu-Opioid receptor agonists differentially regulate the expression of miR-190 and NeuroD. Mol Pharmacol. 2010;77(1):102–9. doi: 10.1124/mol.109.060848. [DOI] [PMC free article] [PubMed] [Google Scholar]
- Zijlstra WG, Buursma A. Spectrophotometry of Hemoglobin: Absorption Spectra of Bovine Oxyhemoglobin, Deoxyhemoglobin, Carboxyhemoglobin, and Methemoglobin. Comparative Biochemistry and Physiology Part B: Biochemistry and Molecular Biology. 1997;118(4):743–749. [Google Scholar]
Associated Data
This section collects any data citations, data availability statements, or supplementary materials included in this article.


