Abstract
Objectives
Abnormal hearing tests have been noted in HIV-infected patients in several studies, but the nature of the hearing deficit has not been clearly defined. We performed a cross-sectional study of both HIV+ and HIV− individuals in Tanzania using an audiological test battery. We hypothesized that HIV+ adults would have a higher prevalence of abnormal central and peripheral hearing test results compared to HIV− controls. Additionally, we anticipated that the prevalence of abnormal hearing assessments would increase with anti-retroviral therapy (ART) use, and treatment for tuberculosis (TB).
Design
Pure-tone thresholds, distortion product otoacoustic emissions (DPOAEs), tympanometry, and a gap detection test were performed using a laptop-based hearing testing system on 751 subjects (100 HIV− in the U.S., plus 651 in Dar es Salaam Tanzania including 449 HIV+ [130 ART− and 319 ART+], and 202 HIV−, subjects. No U.S. subjects had a history of TB treatment. In Tanzania, 204 of the HIV+, and 23 of the HIV−, subjects had a history of TB treatment. Subjects completed a video and audio questionnaire about their hearing as well as a health history questionnaire.
Results
HIV+ subjects had reduced DPOAE levels compared to HIV− subjects, but their hearing thresholds, tympanometry results, and gap detection thresholds were similar. Within the HIV+ group, those on ART reported significantly greater difficulties understanding speech-in-noise, and were significantly more likely to report that they had difficulty understanding speech than the ART− group. The ART+ group had a significantly higher mean gap detection threshold compared to the ART− group. No effects of TB treatment were seen.
Conclusions
The fact that the ART+/ART− groups did not differ in measures of peripheral hearing ability (DPOAEs, thresholds), or middle ear measures (tympanometry), but that the ART+ group had significantly more trouble understanding speech and higher gap detection thresholds, indicates a central processing deficit. These data suggest that: (a) hearing deficits in HIV+ individuals could be a central nervous system (CNS) side effect of HIV infection, (b) certain ART regimens might produce CNS side effects that manifest themselves as hearing difficulties, and/or (c) some ART regimens may treat CNS HIV inadequately, perhaps due to insufficient CNS drug levels, which is reflected as a central hearing deficit. Monitoring of central hearing parameters could be used to track central effects of either HIV or ART.
Keywords: HIV, central auditory processing, DPOAEs, audiometry, gap detection testing
Introduction
Abnormal hearing tests have been noted in HIV-infected patients in several studies, but the nature of the hearing deficit is unknown. Pathologic studies have shown that HIV, and infections related to HIV, can produce problems at multiple sites within the hearing system (Kohan, Rothstein et al. 1988; Michaels, Soucek et al. 1994). Findings in clinical studies have shown various abnormalities, including abnormal tympanograms, threshold audiograms and auditory brainstem response (ABR) tests (Chandrasekhar, Connelly et al. 2000; Khoza and Ross 2002; Matas, Santos Filha et al. 2010), but no consistent pattern of hearing damage in HIV+ individuals has emerged. Several potential reasons exist for hearing problems in HIV+ individuals, ranging from middle ear infections to central nervous system damage. Overall, however, the prevalence of HIV-related hearing problems is not firmly established and the primary pathology leading to hearing difficulties is not known. To confirm that HIV+ individuals perform worse on audiological tests compared to HIV− controls, and to determine which of the potential causes of hearing problems in HIV+ individuals seen in previous studies is the most significant, we have performed a cross-sectional study of both HIV+ and HIV− individuals in Tanzania using an audiological test battery. The purpose of the study was to determine the nature of any hearing deficit that might exist in HIV+ individuals. We hypothesized that HIV+ adults would have a higher prevalence of abnormal central and peripheral hearing test results compared to HIV− controls. Additionally, we anticipated that the prevalence of abnormal hearing assessments would increase with anti-retroviral therapy (ART) use and treatment for tuberculosis.
Previous studies show abnormal hearing tests in HIV+ individuals
HIV infection can potentially affect hearing in multiple ways. The hearing deficits can be either sensorineural or conductive and can arise in different locations along the auditory pathway. The loss could result from: (a) infections such as otitis media, mastoiditis, meningitis, etc., (b) drug effects on the hearing system (either anti-retroviral drugs or anti-tuberculous drugs), (c) the direct effect of HIV and other viruses on neural pathways and structures, and (d) central nervous system neoplasms. Otitis media is a common finding in HIV+ patients (Chandrasekhar, Connelly et al. 2000) and patients with HIV take a variety of medications. Patients with HIV treated for disseminated TB may be at significant risk for hearing loss, since the aminoglycoside antibiotic streptomycin is known to be ototoxic and is used in the treatment of recurrent mycobacterial disease. The HIV virus can affect both peripheral and central neural pathways involved in hearing (Gurney and Murr 2003). HIV can affect the brain parenchyma (e.g. AIDS dementia) and this can also affect the pathways involved in the central processing of auditory information (York, Franks et al. 2001). HIV-infected children, especially those who are untreated, experience a high rate of HIV-associated encephalopathy and neurodevelopmental delay. Even in the treated state, substantial concern exists for continued CNS involvement given its compartmental nature and differential pharmacokinetic distribution of antiretrovirals (ARVs). Neurocognitive deficits are still seen in HIV+ individuals despite active antiretroviral therapy (Mirza and Rathore 2012). Taken together, existing data suggest multiple potential ways that HIV could affect hearing, but to date, no large scale study has shown which of these potential causes predominates or how frequently hearing problems occur in HIV+ individuals.
Cross-sectional study in HIV+ adults
Determining the prevalence of hearing problems in HIV+ individuals and determining the nature of the problem, requires a comprehensive study of a large cohort of HIV+ individuals with and without TB, and on and off of ART. We are currently running a NIDCD-funded study in Tanzania to measure hearing parameters in a large cohort of HIV+ adults. The study uses a laptop-based hearing testing system that includes, questionnaire administration, tympanometry, threshold audiometry (either Békésy or Hughson-Westlake), distortion product otoacoustic emission (DPOAE) measurement, and gap detection testing.
Materials and Methods
The overall study includes both a cross-sectional and longitudinal component. This paper presents the cross-sectional results, since the longitudinal study is still ongoing. The initial study plan was to use the results from the initial visit for a cross-sectional analysis, and then use subsequent 6-month visits for the longitudinal analyses. Once the study began, however, it became apparent that the gap detection algorithm we were using had a low completion rate, and that some people had difficulty completing the Bekesy audiometry tests. We addressed these problems by modifying the gap detection test, and providing an option to do audiometry with a Hughson-Westlake technique. This means, however, that often data from the second visit were used in the cross-sectional analysis.
Participants
The study included 3 main cohorts. In the United States, we tested a convenience sample of 100 individuals to provide normative data on the methods used in the study. In Tanzania, the HIV+ individuals were recruited primarily from the group of people who had participated in the DarDar Health study. The DarDar Health Study (“Dartmouth/Dar es Salaam”), was an epidemiologic study of disseminated TB in HIV infected patients. It included a Phase III randomized clinical trial to measure the efficacy of an inactivated whole-cell mycobacterial vaccine booster to prevent HIV-associated TB (Lahey, Arbeit et al. 2010). A total of 2013, mainly female (76%) HIV+ subjects were enrolled in that trial. These participants were approached and asked if they would be willing to be part of this hearing study. HIV+ individuals who were not part of the DarDar study were also recruited. The only eligibility criteria were that the subject be >18 years of age, and have 2 positive enzyme-linked immuno sorbent assay (ELISA) antibody tests for HIV. Within the HIV+ group, there were individuals both on and off ART. In Tanzania, individuals are placed on the ART based on their World Health Organization (WHO) clinical stage and CD4 count. To get started on ART, individuals in the study either needed to be at an advanced stage or have a qualifying CD4 count at some point prior to enrollment.
Initially, HIV− subjects were recruited from among the family members of the HIV+ subjects. But, most participants were reluctant to involve family members in the study. Recruitment from a medical clinic was also unsuccessful, since many individuals did not want to undergo HIV testing. A testing system was placed near a voluntary HIV testing and treatment center at Muhimbili National Hospital. Individuals who tested negative on an HIV ELISA test were offered enrollment into this hearing study.
For the US convenience sample the eligibility criteria were that the person be >18 years of age and have no reported history of HIV or TB. They were recruited by word of mouth at the Dartmouth-Hitchcock Medical Center and tested by a member of the research team using the same equipment and procedures used in Tanzania (i.e. not in a sound booth). Data from the in-ear noise measurements showed that the U.S. environment was slightly noisier than the Tanzanian testing area.
Testing System and Tests
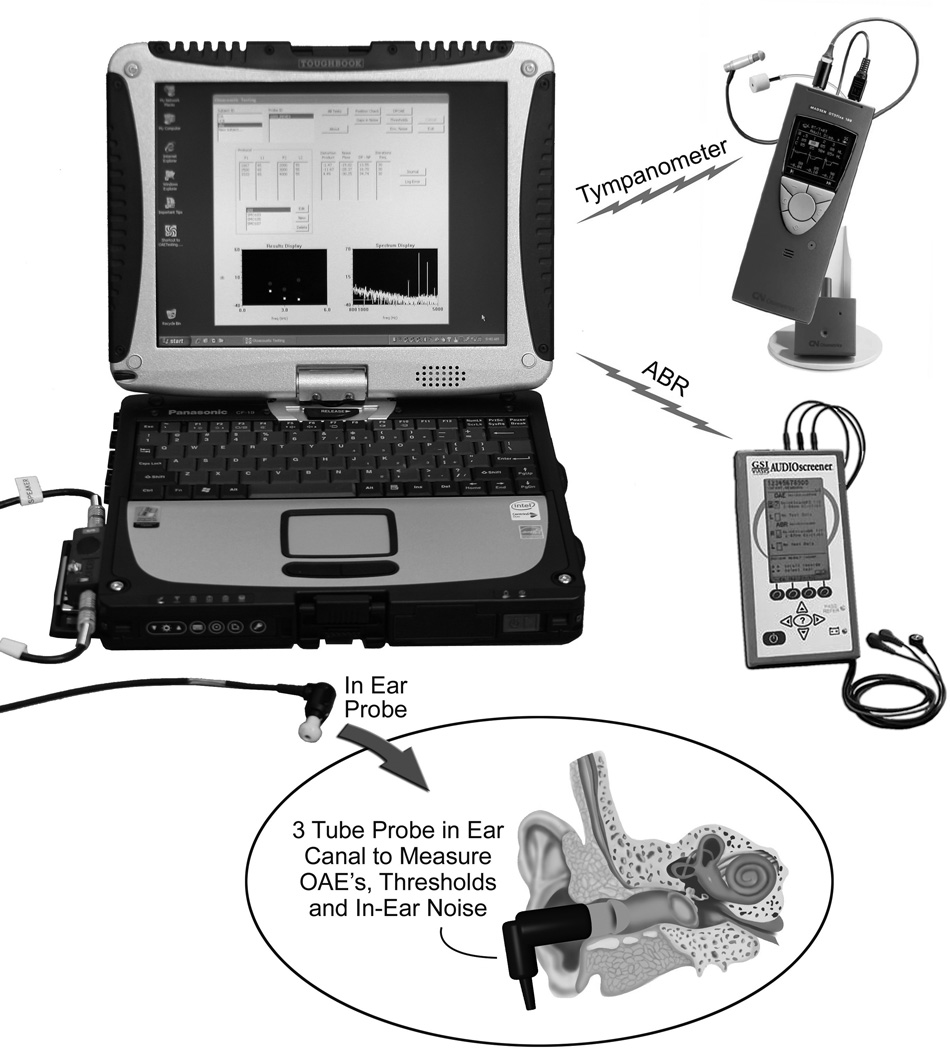
As part of a project for NASA, the Dartmouth-Creare team had developed a laptop-based hearing testing system designed for use on the International Space Station. This system was modified and upgraded for use on this study. Figure 1 shows the equipment used for the study. The laptop-based hearing testing system with associated hardware includes: (a) questionnaire administration to gather data on self-reported hearing and exposure to noise, drugs and toxins, (b) tympanometry to assess middle ear function, (c) threshold audiometry (either Békésy or Hughson-Westlake protocol) to measure hearing sensitivity, (d) distortion product otoacoustic emission (DPOAE) testing to assess cochlear function, and (e) gap detection testing to assess central auditory processing. Auditory brainstem response (ABR) testing was also performed on a subset of individuals who could not complete the gap detection test. Testing was done with passive noise-attenuating earmuffs over the ears (David Clark Model 19 A, David Clark Company, Worcester, MA) and in-ear noise measurements were used to confirm that sound levels in the ear canal were quiet enough for testing (Buckey, Fellows et al. in press). Data were stored in a relational database management system (Microsoft Access 2010, Microsoft, Redmond, WA).
Figure 1.
Laptop-based hearing testing system. Custom software on the laptop runs a calibrated sound card (ECHO Indigo IO, Echo Audio, Santa Barbara, CA), ear probe (Grason-Stadler Inc., Eden Prairie, MN) combination to perform the audiological tests. Separate devices are used for tympanometry (Madsen Otoflex 100) and ABRs (GSI AudioScreener), and the results from these devices are communicated back to the laptop via Bluetooth, and infrared respectively. The overall laptop-based hearing testing system with associated hardware includes: (a) Questionnaire administration to gather data on self-reported hearing and exposure to noise, drugs and toxins, (b) Threshold audiometry (either Békésy or Hughson-Westlake) to measure overall hearing ability, (c) Distortion product otoacoustic emission (DPOAE) testing to assess cochlear function, (d) Gap detection testing to assess central auditory processing, (e) Tympanometry to assess middle ear function, and (f) Auditory brainstem response testing to assess brainstem pathways in adults who cannot complete the gap-detection test
Questionnaire: We used questionnaires to gather data regarding the participants hearing (Hearing Health Status Questionnaire) and general health status (Health History Questionnaire) (see Supplemental Digital Content 1). Items for the Hearing Health Status Questionnaire were extracted from several sources, including the National Health and Nutrition Examination Survey (National_Center_for_Health_Statistics 2010) and the National Health Interview Survey (Centers_for_Disease_Control_and_Prevention 2007). Subjects were asked about their overall hearing, occupational and recreational noise exposure, tinnitus, ear drainage, ear infections, chemical exposure, and balance problems. Three questions were used to assess complaints often associated with auditory processing difficulties ("How often do you find it difficult to follow a conversation if there is background noise, for example, when other people are talking, the TV or ratio is on, or children are playing?", "Do you have trouble determining where sound is coming from?", and "Do you hear sounds normally but do not understand speech"). All items were translated into Kiswahili by the second author (NM) and were recorded by a native speaker. In order to ensure consistency, the questionnaire was presented via video, audio and text on a laptop computer.
The Health History Questionnaire was administered by the operators and included questions about past or current tuberculosis (TB) treatment, HIV treatment, gentamicin exposure, and the use of anti-malarials, aspirin, and diuretics.
Tympanometry: Tympanometry at 226Hz was performed using a Madsen Otoflex 100 (GN Otometrics, Denmark). The device provided measurements of ear canal volume, static admittance, tympanometric peak pressure, tympanometric width, and tympanogram type (A, As, Ad, B, C). The OTOflex 100 determined tympanogram type from the location (pressure and static admittance) of the peak of the tympanogram. The pressure limits for type A were −100 to +50 daPa, and the static admittance limits for type A were 0.3–1.7 mmho. Tympanograms with static admittance levels less than 0.3 mmho with a discernable peak were classified as type As, those with levels less than 0.3 with no discernable peak were classified as Type B. Those with static admittance levels greater than 1.7 mmho were classified as type Ad. Tympanograms with pressures outside the Type A range, but within the static admittance limits, were classified as Type C.
In-ear noise measurement: The in-ear probe used for the in-ear noise measurements, threshold audiometry, DPOAE measurements and gap detection was the probe used in the Grason-Stadler GSI 70 DPOAE device (Grason-Stadler Inc., Eden Prairie, MN, part number 1770-325). This probe contained two speakers and a microphone. For the in-ear noise measurement, the noise spectrum from the microphone was analyzed, and displayed as one-third octave bands on the operator’s screen. One-third octave bands were calculated following ANSI S1.11 – 2004 (R2009) “Specification for Octave-Band and Fractional-Octave-Band Analog and Digital Filters” (American_National_Standard 2009). The plot of one-third octave bands shown to the operator displayed acceptable levels in grey and unacceptable levels in red. Levels below 30 dB SPL for frequencies <1000 Hz, below 25 dB SPL for frequencies between 1000–2000Hz, and below 20 dB SPL for frequencies ≥ 2000 Hz were considered acceptable (grey). The operators were instructed to attempt to have all the bars grey, but if this was not possible, to focus on achieving grey bars at 2000 Hz and above.
Threshold audiometry: Thresholds were measured at frequencies of 500, 1000, 2000, 4000, 6000 and 8000 Hz. A Békésy-like tracking procedure was used. The stimuli for the procedure were pulsed tones with a duration of 250 msec, rise and fall time of 20 msec and an interstimulus interval of 500 msec. When the subject pressed the response button the tone reduced in 4-dB steps until the first reversal, then 2-dB steps were used. The first two reversals were rejected. Subsequent reversals where the peak was lower than the previous valley, or where a valley was higher than the previous peak, were also rejected, and the algorithm restarted counting the number of reversals. A total of 6 good reversals were counted and averaged. To calculate the threshold, the last six reversal points were averaged. The pure tone average was calculated from the thresholds at 500, 1000, 2000, and 4000 Hz. Before testing, each subject viewed a video in Kiswahili that provided instruction on performing the test. The operators also provided additional training as needed. Subjects who could not perform the Békésy-like test easily were tested instead with a modified Hughson-Westlake procedure, where the operator administered the test. The modified Hughson-Westlake procedure was used in approximately 26% of the tests.
Because the probe used for this study did not have published reference equivalent threshold sound pressure levels (RETSPLs), we determined these levels in a separate study with 10 normal hearing subjects (Buckey, Fellows et al. in press). The protocol followed the guidelines outlined in Annex D of ANSI S3.6-2004-“Specification for Audiometers” (American_National_Standard 2004). To maintain a consistent calibration for all devices, each probe and sound card (ECHO Indigo IO, Echo Digital Audio Corporation, Santa Barbara, CA), were calibrated as a pair, and the calibration curve for that pair was stored on the laptop. Before testing each subject on the system, the calibration was checked with a 2 cc coupler. If the calibration did not match a pre-recorded baseline, the subject was tested with another system and the problem was investigated. Due to the maximum sound output possible from the speakers in the probe, the system could not measure a hearing loss in excess of 70 dB HL.
DPOAEs: DPOAEs were performed at f2 values of 1500, 1700, 2000, 2200, 3000, 3200, 4000, 4200, 6000, 6200, 7800, and 8000 Hz with an f2/f1 ratio of 1.2. Data were collected twice, first using L1/L2 values of 65/55 and then 70/70. Subjects were instructed not to swallow during testing and a noise-rejection algorithm was used to discard noisy segments during the data collection. Each f2-f1 frequency pair was presented for a minimum of 4 seconds. If after 4 seconds the DP-NF value was less than 10 dB, data collection continued until either a DP-NF value of 10 was reached or 10 seconds had elapsed. The speaker output was not adjusted in the ear canal (i.e. an in-ear calibration was not used). In some subjects, unrealistically high values for DPOAEs and noise floors were returned, likely due to resonances in the ear canal. These values were discarded for the data analysis (see below). For each system, the level of harmonic distortion was also determined using a Brüel and Kjær Type 4157 Ear Simulator/Artificial Ear (Bruel and Kjaer Type, Nærum, Denmark).
To assist with proper probe placement a frequency sweep (chirp) was presented in the ear canal before the DPOAE testing. The results from three chirps (500–5000Hz) at 65 dB SPL were averaged, smoothed, and displayed to the operator. A measured level below 20 dB SPL at 500 Hz was used to indicate a bad probe seal. In the case of a bad seal the probe was reseated and the chirps were repeated. If the probe was placed securely in the ear canal and the seal check passed, the results from the chirp were saved as a baseline frequency sweep for that subject. On subsequent visits, the baseline frequency sweep was displayed and the operator could position the probe to match the frequency sweep within ± 5 dB at each frequency. A consistent probe fit ensures the stimulus levels remain consistent from one visit to the next.
Gap detection testing: To determine an individual’s gap detection threshold, the participant was trained to press a button when a short gap in noise was heard. The gaps were placed randomly in the middle portion of 4.5 s of white noise delivered at 65 dB SPL. To avoid confusion, no gaps were presented in the first or last second. Upon hearing the gap, the subject pressed a pushbutton, and the response time was recorded. Response times of more than 150 ms and less than 1000 ms were considered acceptable; otherwise, the response was considered a missed detection. If the subject correctly identified two gaps in a row then the gaps become shorter, if two gaps in a row were missed then the gaps become longer. If the subject received 5 presentations at a given gap length without getting either 2 correct or 2 wrong in a row, the algorithm scored this as a miss and increased the gap length. The allowable gap lengths were: (70, 60, 50, 45, 40, 35, 30, 25, 20, 16, 13, 10, 7, 4, 2, 1). A reversal occurs when the progression of gap lengths reverses from shorter to longer or vice versa. The test started at a gap length of 20 msec. and continued until the subject either completed 10 reversals or 120 presentations (see Figure, Supplemental Digital Content 2, which illustrates how the gap test is performed).
The test yielded a value that represented the average of the last 8 reversals. In addition, to compensate for instances where the subject may have lost focus during the test, the 3 reversals with the shortest gap lengths were averaged. The data were also plotted as a percentage of time the subject correctly detected the gap of a given length vs. the gap length. Not all patients could complete the gap test successfully. The percentage of people who did not complete the gap test in the different groups was (HIV− 28%, HIV+ 30%, ART− 30%, ART+ 30%). All patients attempted the gap test regardless of the results from their audiometric testing. Although, there’s a tendency for the gap detection threshold to increase with worsening audiometric thresholds, the R squared is .065, suggesting that variability in the PTA is not a major contributor to variability in the gap detection results (see Figure, Supplemental Digital Content 3, which shows a plot of gap detection thresholds vs. PTA).
Auditory brainstem response (ABR) testing: For those individuals who could not complete the gap detection test, ABR testing was performed. A GSI AUDIOScreener was used (Grason-Stadler, Inc., Eden Prairie, MN). The primary stimulus was a click presented at 32/sec at 60 dB nHL. The neural response was detected using skin electrodes placed on each mastoid process and the forehead. The measured voltage was filtered from 30–1500 Hz. The testing environment was not ideal for ABR measurements (mainly due to electrical interference) and a significant percentage of the tracings were not suitable for analysis (32%).
CD4+ T-helper cell levels: When subjects arrived for testing they had blood drawn to measure the level of CD4 positive T-helper cells in their bloodstream. This serves as a marker of the severity of the HIV infection. A Becton Dickinson FACSCalibur system was used to make the measurements (BD Biosciences, San Jose, California).
Testing Protocol
All tests and procedures were approved by the Committee for the Protection of Human Subjects at Dartmouth, and by the Institutional Review Board at the Muhimbili University of Health and Allied Sciences. Before the study began, the nurses and clinical officers (a clinical officer is similar to a physician assistant) at the Infectious Disease Center in Dar es Salaam were trained in all the testing procedures used (e.g. otoscopy, tympanometry, questionnaire administration, audiometry, DPOAE testing, gap detection testing and ABR administration).
After informed consent was obtained, the subjects were asked if they had had any significant noise exposure within the preceding 14 hours or if they had taken any large dose of aspirin. If the subjects answered yes, they were scheduled for testing on a different day. An otoscopic exam was performed. If the subjects had any significant ear pathology that would preclude testing on that day (e.g. draining ear, external otitis, wax impaction), they were referred for treatment and scheduled for testing on another day (sixteen people were sent for evaluation and two did not return for testing). Cerumen that prevented visualization of the ear canal was removed before testing.
After the otoscopic exam the subjects had tympanometry performed on both ears. The subjects then completed the two questionnaires (the Hearing Status and Health History Questionnaires, see Supplemental Digital Content 1). After this, they received training in how to perform the Békésy-like threshold and gap-detection tests. The subjects were given the opportunity to practice both the Békésy and gap detection tests before the actual data collection. Once training was complete, a calibration check on the system was performed, and the probe was placed in the subject’s right ear. The probe placement was checked using the frequency sweep check, and the insertion was adjusted as needed. The subject’s ears were then covered with a passive noise-reducing headset (Model 19A, David Clark Company, Worcester, MA), and in-ear noise levels were checked. If the noise levels were above the acceptable range, the headset was repositioned until the in-ear noise check was passed.
DPOAE testing was performed next, first with L1/L2 at 65/55 and then with L1/L2 at 70/70. DPOAE testing was followed by audiometry. If the subject had difficulty with Békésy-like audiometry (e.g. excursions greater than 20 dB, or an inability to understand the test), the Hughson-Westlake protocol was used instead. The operator made this determination on a case-by-case basis. Gap-detection testing followed threshold audiometry. Before starting the gap detection test, the subjects received a refresher in how to perform the test, and were given sample gap presentations. Once the operator was satisfied that the subject understood the test, the test was administered. Once all testing was complete on the right ear, the probe was switched to the left ear and the testing protocol was repeated.
Data Analysis
All cases with thresholds that could not be detected by the Bekesy algorithm were reviewed individually, and classified either as unreliable or as no response at the maximum output level of the system. Unreliable values were discarded, otherwise the values were set to 70 dB HL (the maximum value the system could detect).
For the DPOAE data, a frequency histogram of all the DPOAE values was bimodal. It was a mixture of one Gaussian distribution with a mode at approximately 7 dB SPL and a second mode at approximately 60 dB SPL. The second mode consisted of those values where the DPOAE algorithm returned erroneously high values because of resonances within the ear canal. A clear division between the 2 distributions existed at 35 dB SPL. For data analysis DPOAE values > 35 dB SPL were omitted.
The harmonic distortion testing on the systems revealed that for the testing frequencies of 1500, 1700, 2000, 2200, 6000, 6200, 7800, 8000 Hz, DPOAE levels above −10 dB SPL could be measured reliably. For the frequencies of 3000, 3200, 4000, 4200 values above −20 dB SPL were reliable. For the data analysis, DPOAE levels below −10 dB SPL for 1500, 1700, 2000, 2200, 6000, 6200, 7800, 8000 were set to −10 dB SPL, and DPOAE levels below −20 dB SPL for 3000, 3200, 4000, 4200 were set to −20 dB SPL.
For the gap detection data, an analysis of data from 35 subjects who completed the gap detection testing 6 months apart showed consistent performance on the test. Nevertheless, an analysis comparing the right ear to left ear data for all subjects showed that the left ear gap detection threshold was on average slightly, but significantly, lower than the threshold for the right ear. This finding likely represented a practice effect on the testing day. For the data analysis the data from the left ear, using the average of the best 3 reversals, were used. The gap data were also plotted as a graph of percent correct detections vs. gap length.
For the statistical analyses the characteristics of each group were summarized using descriptive statistics (e.g., mean, quantiles, standard deviation for age and other continuous variables, proportions for gender, type of hearing loss and other categorical variables). When possible, the primary analysis used for continuous variables was ANCOVA (analysis of covariance, or equivalently, linear multiple regression) with adjustment for gender, age, and noise exposure, CD4 count and duration. The proportion of subjects that provided particular answers to the questionnaire questions were analyzed using chi-square and Fisher’s exact tests. A p value of <0.05 was considered significant.
The HIV− and HIV+ groups were not well matched on age, gender and noise exposure. Since these covariates were not balanced between groups, we used propensity score matching for the HIV−, HIV+ group comparisons. The propensity score is a device for constructing matched pairs or matched sets or strata that balance numerous covariates (Joffe and Rosenbaum 1999). The analyses were performed using R: A Language and Environment for Statistical Computing (http://www.r-project.org/).
Results
Subject Characteristics
Table 1 shows the characteristics of the subjects in the different groups. The HIV− group was significantly younger (P<0.0001, t-test) and had a significantly higher proportion of males than the HIV+ group (P=0.0026, Fishers exact test). The HIV− group also reported significantly greater exposure to both occupational and recreational noise (P=0.006 and P=0.0046 respectively, Fishers exact test). The ART+ and ART− groups did not differ in their reported noise exposure, ear drainage history, tinnitus history, gender composition, or rate of abnormal tympanograms. The ART+ group was significantly older than the ART− group (42 years ART+ vs. 39 years ART−, P<0.002, t-test), and had a greater proportion of people with a history of TB, but this did not reach statistical significance. In general, few (<4%) of the people in any of the groups met the WHO criteria for either moderate or severe hearing loss.
Normative results from US control group
Table 2 shows overall results from the U.S. group compared to the HIV− group in Tanzania using the same general statistical approach as for the HIV+, HIV− comparisons, and ART+, ART− comparisons (ANCOVA with adjustment for age, gender and reported noise exposure). The U.S. group had lower pure tone averages (PTA), higher DPOAEs, and lower gap detection thresholds overall compared to the HIV− group in Tanzania. A significantly greater proportion of the U.S. group rated their hearing either “excellent” or “good”, compared to the HIV− group in Tanzania (P=0.028, Fishers exact test). Compared to the Tanzanian group as a whole, the U.S. group was significantly less likely to report a history of ear drainage or exposure to gentamicin (Table 1) (P<0.0001, Fishers exact test).
TB comparison
There were no significant differences in thresholds, DPOAE levels, or gap detection thresholds between the TB+ and TB− individuals within the HIV+ group (data not shown). Interestingly, the TB− individuals were significantly more likely to report difficulty with hearing speech in background noise (51% TB− vs. 36% TB+, p=0.039).
HIV+, HIV− comparison
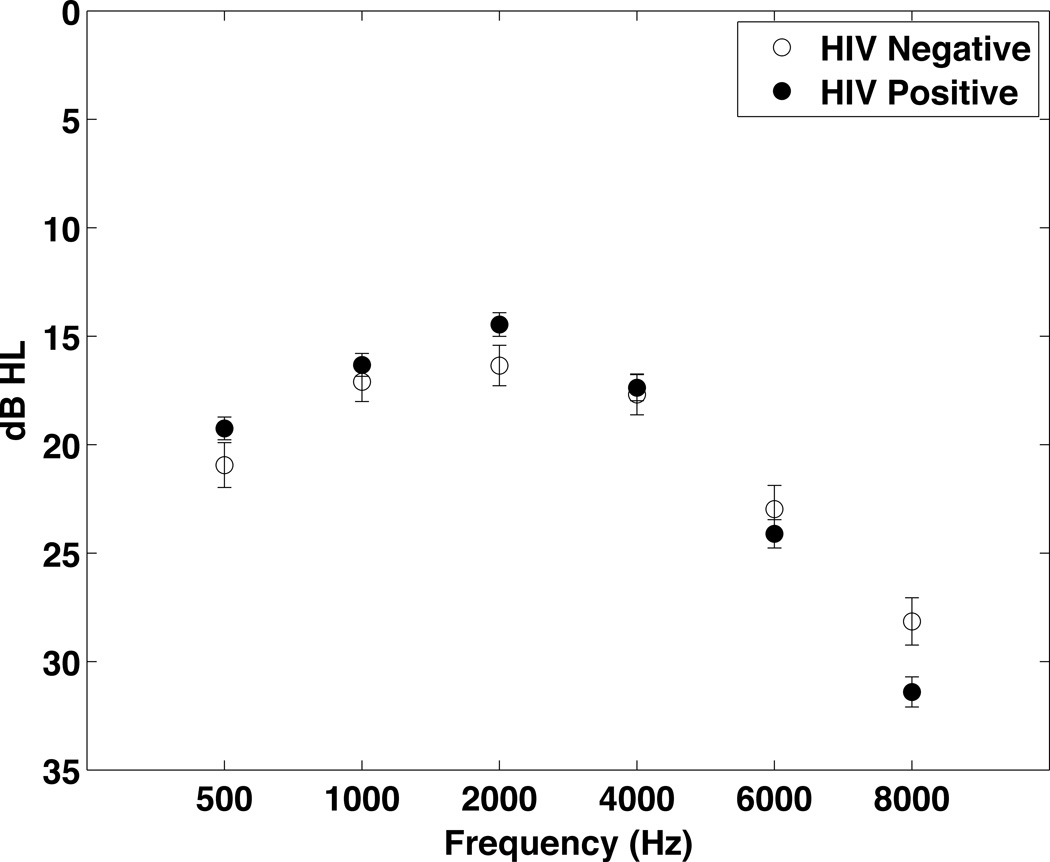
Figure 2 compares the threshold values from both ears combined for the HIV− and HIV+ groups. Thresholds for the left ear at 500–4000 Hz were significantly worse for the HIV− group compared to the HIV+ group, when adjustments were made for gender, age and noise exposure and the data were analyzed using multiple linear regression. No significant differences were noted for the right ear. When the data from both ears were combined, the overall pure tone average (PTA, average of 500, 1000, 2000 and 4000 Hz) was significantly worse in the HIV− group (18 HIV− vs. 17 HIV+, p=0.039), when the data were analyzed using multiple linear regression. But, no significant differences in thresholds for either ear were found when propensity score matching was used to compare the groups.
Figure 2.
Hearing threshold data comparing the HIV+ (n=449) and HIV− (n=200) groups in Tanzania. To simplify data presentation, the data from both ears were averaged. Due to the different demographic makeup of the two groups they were compared statistically using propensity score matching. There were no significant differences between groups.
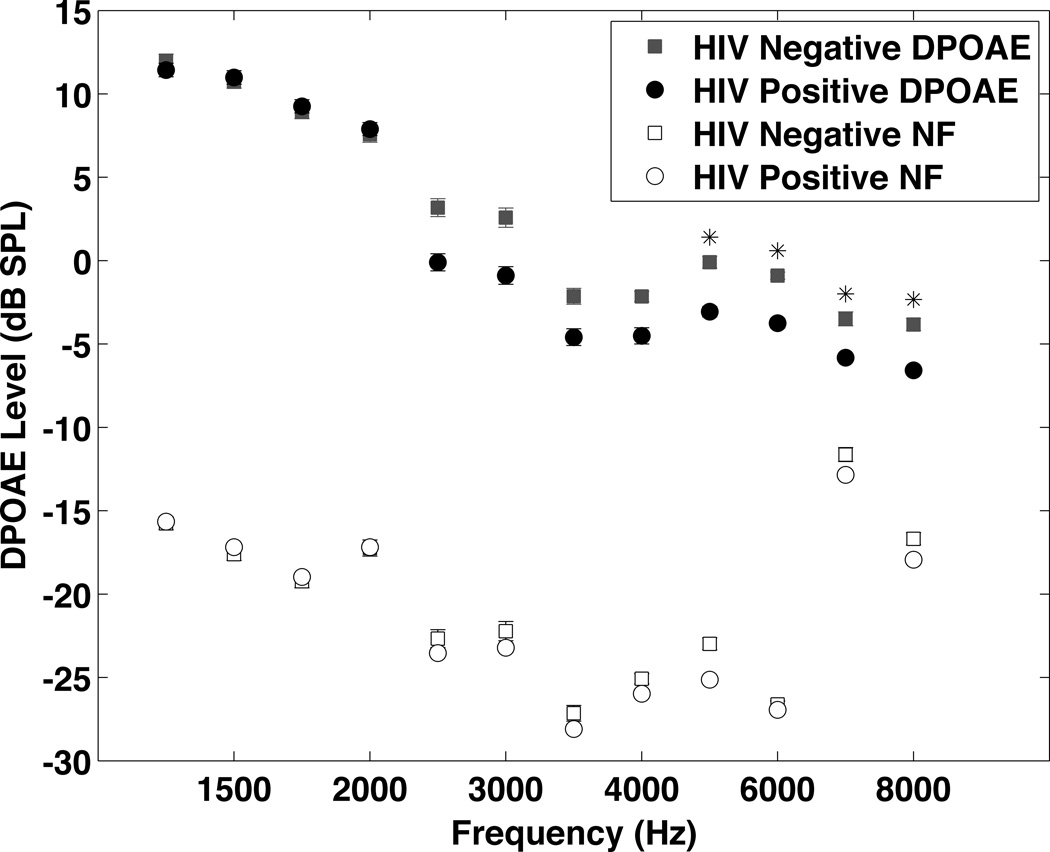
Figure 3 shows the combined right and left ear DPOAE results at L1/L2 of 65/55 for the two groups. The L1/L2 70/70 results are similar. The HIV+ group had significantly lower DPOAE levels at 3000 Hz and above using multiple linear regression, but the differences were only significant for the left ear at 6000, 6200, 7800, and 8000 Hz when the data were analyzed using propensity score matching.
Figure 3.
DPOAE results from the HIV+ and HIV− groups. Due to missing data the number of subjects in the analysis for each frequency ranged from 374 to 434 for the HIV+ group and from 170 to 197 for the HIV− group. Since the results were the same for both ears, the data from both ears have been averaged to simplify data presentation. DPOAEs were significantly lower in the HIV+ group at multiple frequencies. This difference was significant at 6000 Hz and above (6000 Hz p=0.005, 6200 Hz p=0.0.15, 7800 Hz p=0.01, 8000 Hz p=0.002). All the average DPOAE levels were above the average noise floor (the noise floor was below −10 dB for all frequencies). Data were analyzed statistically using propensity score matching.
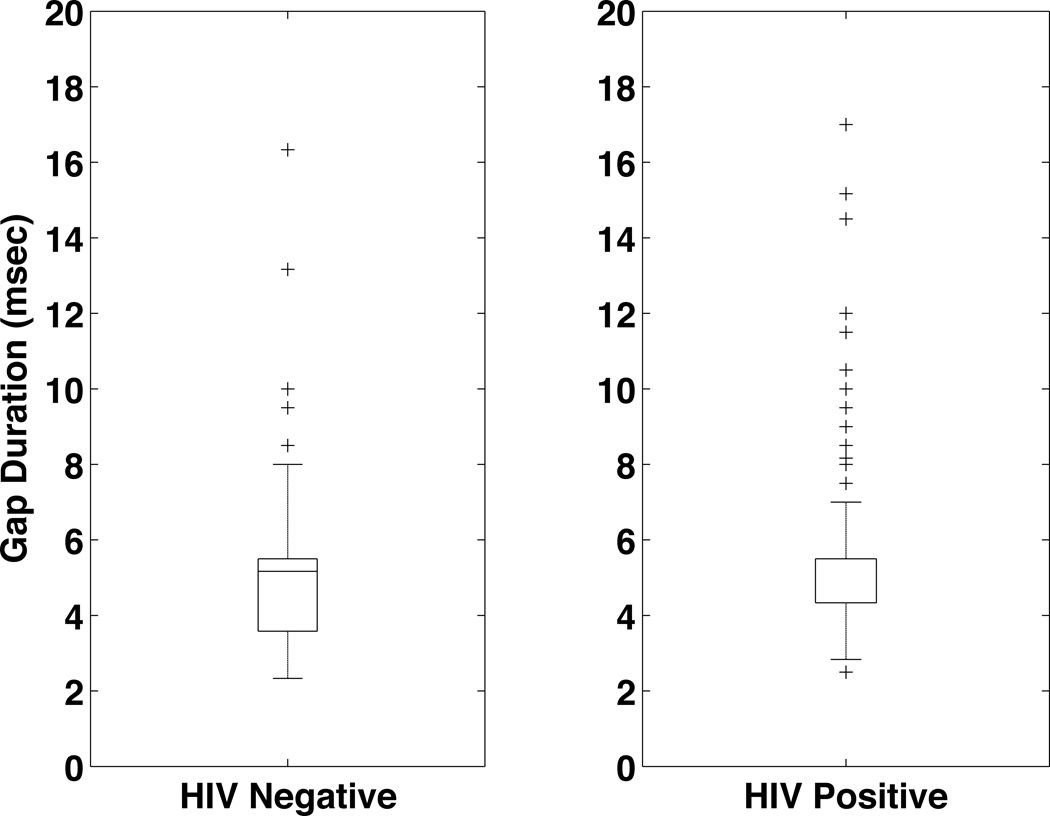
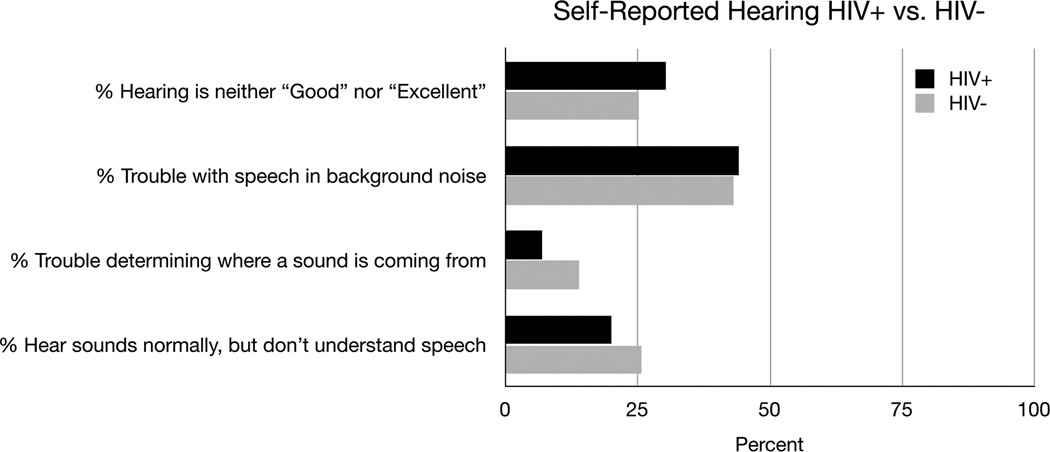
Figure 4 shows the gap detection threshold results for the HIV− and HIV+ groups. The gap detection threshold was not significantly different between the groups (5.1 msec HIV− vs. 5.5 msec HIV+ p=0.2), although the HIV+ group did have a larger spread in the data. The subjects’ responses to questions about their overall hearing ability are shown in Figure 5. In general the responses were similar, although the HIV− individuals had a tendency to report more difficulty determining where a sound is coming from (13.9% HIV− vs. 6.9% HIV+). This difference, however, was not significant when the data were analyzed using propensity score matching (p=0.14).
Figure 4.
Gap Detection Thresholds for the HIV+ and HIV− groups. The results from the left ear using the average of the lowest 3 reversals are shown. The difference between the HIV− (5.1 mscec, n=140) and HIV+ (5.5 msec, n=273) is not significant using propensity score matching.
Figure 5.
Self Reported Hearing for the HIV+ and HIV− groups. The data are presented as percentages. For each question the number of individuals responding were: Hearing is neither “Good” nor “Excellent” (136 HIV+, 51 HIV−), Trouble with speech in background noise (198 HIV+, 87 HIV−), Trouble determining where a sound is coming from (31 HIV+, 28 HIV−), Hear sounds normally, but do not understand speech (90 HIV+, 52 HIV−).
ART+, ART− comparison
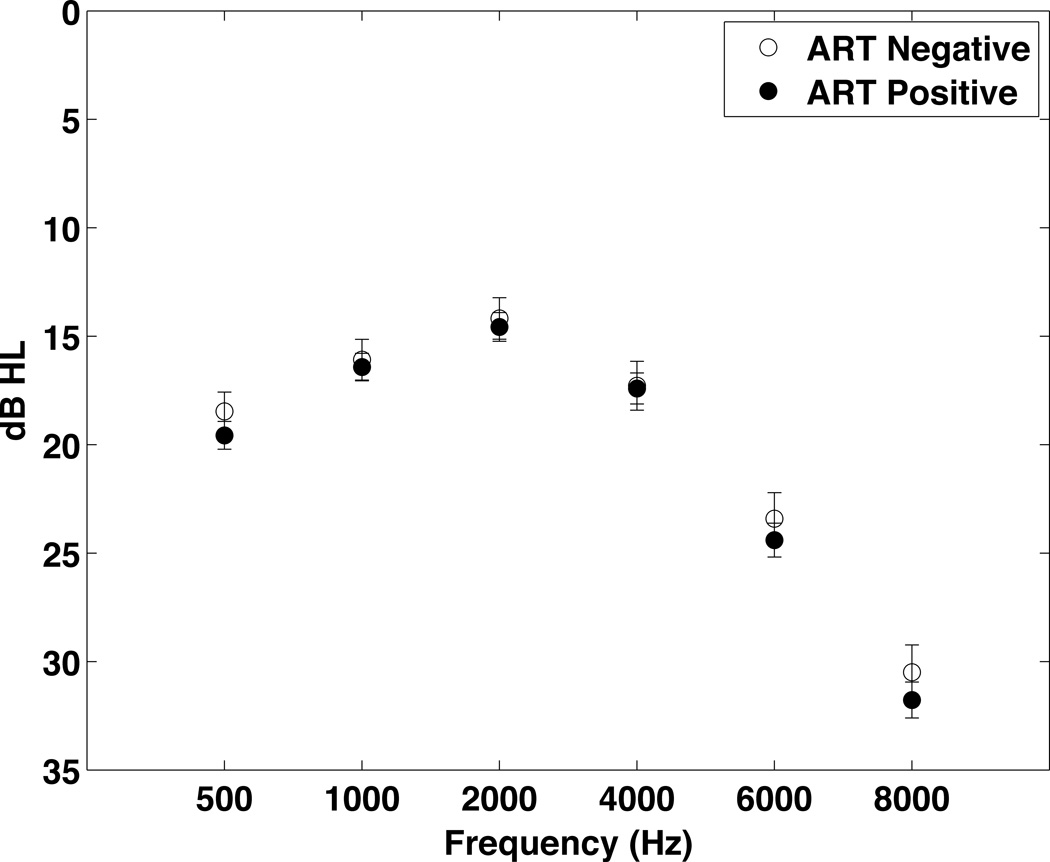
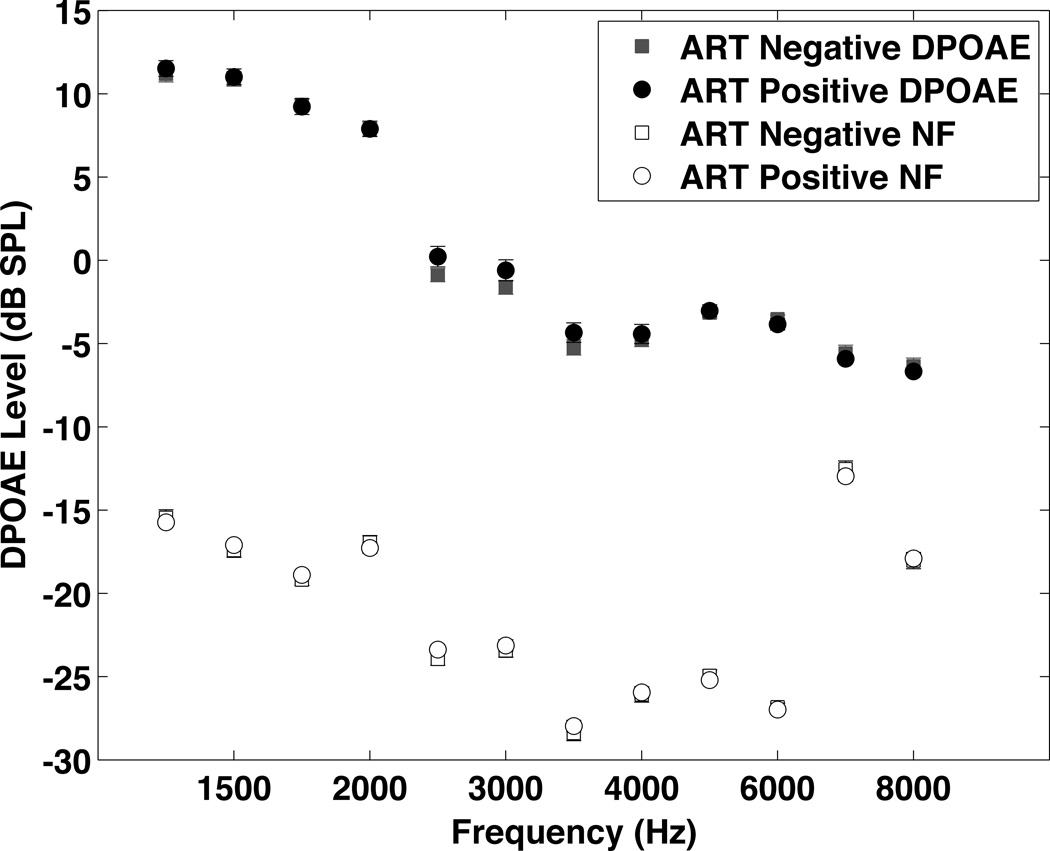
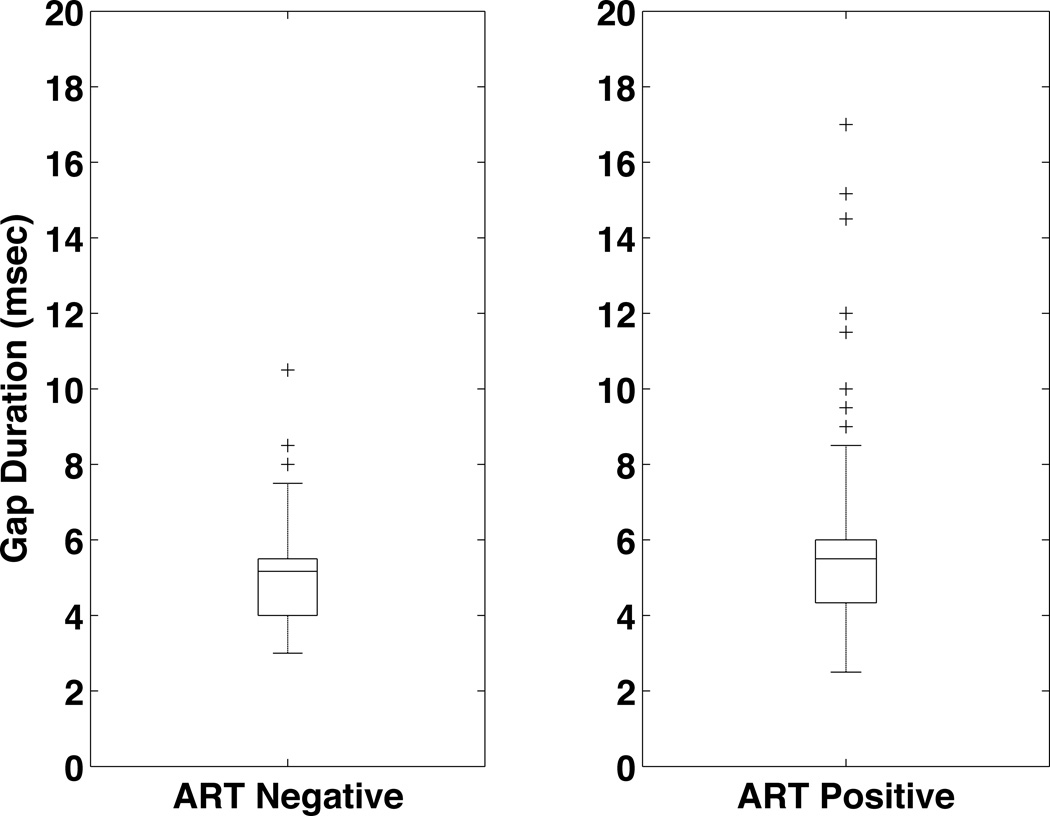
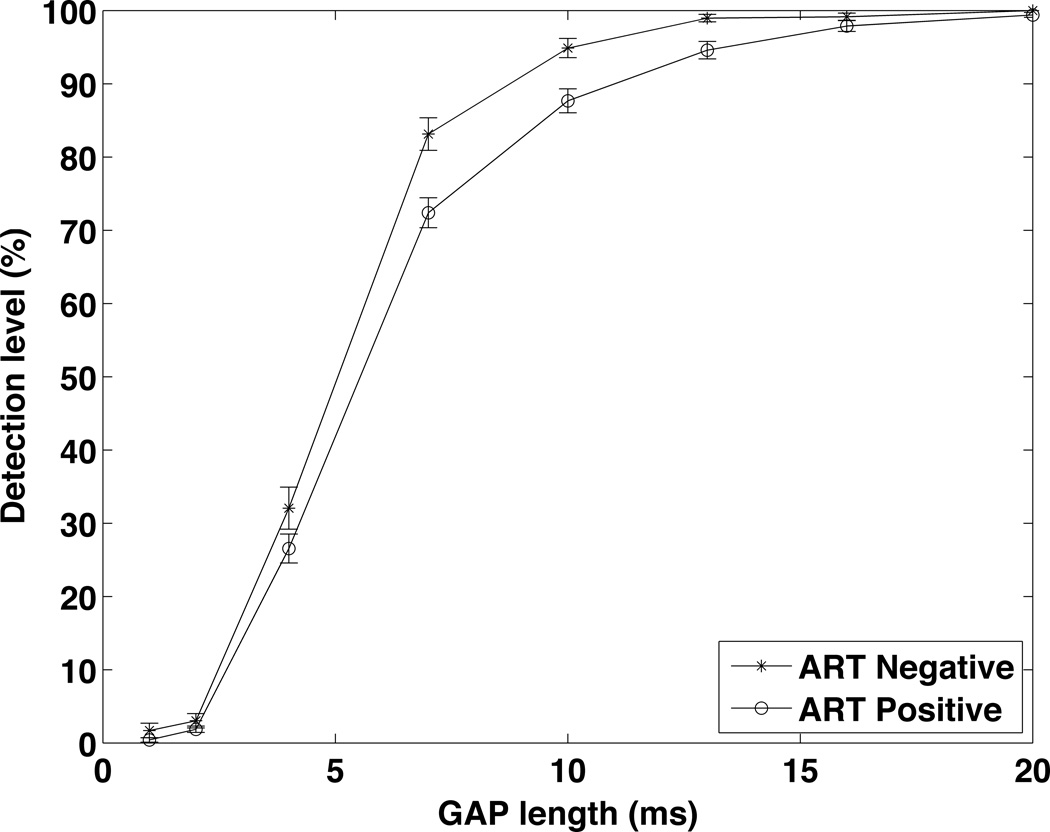
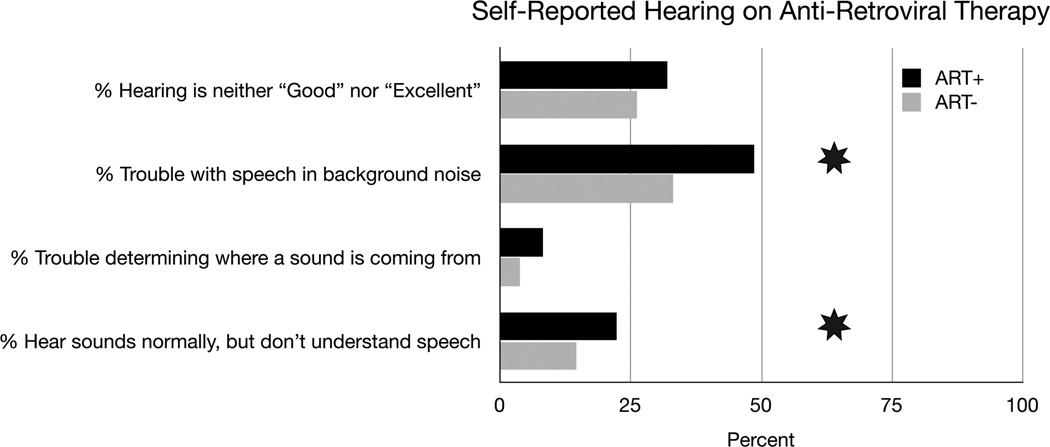
Figure 6, 7, 8, 9, and 10 summarize the results for the ART+ and ART− comparison. The groups did not differ significantly in hearing thresholds or DPOAE levels. The gap detection threshold, however, was significantly greater in the ART+ group (5.0 ART− vs. 5.8 ART+, p=0.024)(Figure 8). Figure 9 shows the gap data plotted with gap length on the x-axis and the percentage of time the subject correctly identified a gap of this length on the y-axis. The pattern of the gap response differed between the two groups, with the ART+ group showing worse overall performance in detecting gaps. The percentage of the time that the ART+ group correctly identified 4, 7 and 10 msec gaps was significantly lower than for the ART− group (p=0.036, p=0.005, and p=0.005 respectively, Mann-Whitney test). The ART+ group reported significantly more difficulty understanding speech in background noise compared to the ART− group (49% ART+ vs. 43% ART−, p=0.006), and was significantly more likely to report that they heard sounds normally, but did not understand speech (22% ART+ vs. 19% ART−, p=0.038)(Figure 10). The overall gap and questionnaire findings did not change when the data were analyzed adding adjustments for CD4 counts and duration since diagnosis.
Figure 6.
Thresholds for the ART+ (n=319) and ART− (n=130) groups. To simplify data presentation, the data from both ears were averaged. Data were analyzed using multiple linear regression with adjustments for age, gender, and noise exposure. There were no significant differences between groups.
Figure 7.
DPOAEs for the ART+ and ART− groups. Due to missing data the number of subjects in the analysis for each frequency ranged from 263 to 310 for the ART+ group and from 111 to 126 for the ART− group. No significant differences were seen between the groups.
Figure 8.
Gap Detection Thresolds for the ART+ and ART− groups. The gap detection threshold in the ART+ group (5.8 msec, n=194) is significantly greater than the gap detection threshold for the ART− group (5.0 msec, n=79).
Figure 9.
Gap Detection Thresholds for the ART+ and ART− groups plotted as a % correct detection vs. gap length.
Figure 10.
Self-reported hearing for the ART+ and ART− groups. For each question the number of individuals responding were: Hearing is neither “Good” nor “Excellent” (102 ART+, 34 ART−), Trouble with speech in background noise (155 ART+, 43 ART−), Trouble determining where a sound is coming from (26 ART+, 5 ART−), Hear sounds normally, but do not understand speech (71 ART+, 19 ART−).
Individual comparisons within the HIV+ group were made between those individuals who had taken particular antiretroviral drugs (e.g. zidovudine, lamivudine, nevirapine, efavirenz, stavudine, emtricitabine) and those with no history of taking the particular drug under study. These analyses did not identify any particular drug that was associated with significantly higher gap detection thresholds (analysis results not shown). This does not exclude these drugs as possible causes, however, since we may not have had an adequate number of individuals taking a particular drug to provide sufficient statistical power to detect a difference.
Discussion
Results from this cross-sectional study show that HIV+ individuals may have reduced DPOAE levels compared to HIV− individuals, but their hearing thresholds, tympanometry results, and gap detection thresholds are similar. Within the HIV+ group, those on ART reported significantly greater difficulties understanding speech-in-noise, and were significantly more likely to report that they had difficulty understanding speech than those in the ART− group. The ART+ group had a significantly higher mean gap detection threshold compared to the ART− group. Although the ART groups were very similar on measures of peripheral hearing ability (DPOAEs, thresholds), and had similar rates of abnormal tympanograms, the ART+ group reported significantly more trouble understanding speech and had higher gap detection thresholds.
Several possibilities exist for these findings. HIV infection is known to produce various neurocognitive side effects due to persistent infection or inflammation, and the central hearing deficits in HIV+ individuals could be another manifestation of the HIV infection in the central nervous system. Certain ART regimens might affect the central nervous system (CNS) and produce central nervous system side effects that manifest themselves as hearing difficulties. Also, some ART regimens may treat CNS HIV inadequately, perhaps due to inadequate penetration into the CNS, which is reflected as a central hearing deficit due to progression of HIV within the CNS. These data may also indicate that monitoring of central hearing parameters could be a method to track central effects of either HIV or ART.
U.S., Tanzanian comparison
The threshold and DPOAE differences between the U.S. group and the HIV− group in Tanzania are likely due to the significantly different environments the two groups experience. The Tanzanian group was significantly more likely to report a history of ear drainage or exposure to gentamicin. Although the percentage of people reporting noise exposure was not significantly different between groups, our experience has been that the use of hearing protection in Tanzania during noise exposure is not widespread. So, although reported noise exposure was the same, it’s likely that the Tanzania group who experience more adverse consequences from the noise exposure.
The difference in gap detection thresholds between the U.S. and HIV− group in Tanzania could have several potential causes. Gap detection thresholds can be affected by peripheral hearing ability, but this affect is small (Weihing, Musiek et al. 2007), and few of the people in the HIV− cohort (3.5%) had either moderate or severe hearing loss (based on WHO criteria). A regression analysis of gap detection threshold vs. PTA using the data from this study shows a significant positive correlation. As mentioned in the methods section, the variability in the PTA within this study is not a major contributor to variability in the gap detection results (see Figure, Supplemental Digital Content 3).
A more likely explanation is a general unfamiliarity with hearing testing combined with a specific lack of training on the gap detection test in the Tanzanian HIV− group. Many of the HIV− individuals only did the gap test once (gap results from the second visit were often used for the HIV+ group), and so had less experience with the test, which likely increased the variability in the results. The U.S. group also only did the test once, but the U.S. group also had much more experience with hearing testing and computers, and likely needed less familiarization and training to complete the testing.
HIV+, HIV− comparison
The prevalence of HIV-associated hearing loss had been estimated previously to be between 21% and 49% (Gurney and Murr 2003). In a study of 99 HIV+ patients in Seattle, 29% had hearing loss as measured by a threshold of 25dB HL or greater at 4000Hz (Marra, Wechkin et al. 1997). In a cross-sectional study by Chandrasekhar of 50 patients with HIV (Chandrasekhar, Connelly et al. 2000), hearing loss was present in 29% of the ears studied, but there was no control group. Khoza et al. (Khoza and Ross 2002) found hearing loss in 23% of the 150 HIV+ South African subjects tested. Most of the hearing loss was sensorineural or mixed, with only approximately 10% classified as conductive. In addition, there was a trend toward a higher occurrence of sensorineural hearing loss with lower CD4 counts. But, the study did not include a control group. Another recent study from South Africa found 14% of HIV+ subjects had a pure tone average (PTA) > 25 dB HL (van der Westhuizen, Swanepoel et al. 2012).
The data from the present study does not show a major difference in audiometric thresholds between the HIV− and HIV+ groups. Also, the percentage of people meeting WHO criteria for either moderate or severe hearing loss is low in both groups (Table 1). But, on average, the HIV+ group had lower DPOAE values than the HIV− group suggesting possible cochlear damage in this group. These changes were apparent despite the fact that the HIV− group had greater reported noise exposure. The HIV+, HIV− group comparison was complicated by the difficulty enrolling a matched group. The HIV− group was more male, younger, and reported higher levels of noise exposure than the HIV+ group. Despite this, the HIV+ group still showed lower DPOAE levels on average. When using ANCOVA, these differences were significant at multiple frequencies after correction for age, gender and noise exposure history. When propensity score matching was used, however, the DPOAE differences were only significant for the left ear at 6000 and 8000 Hz.
One possible explanation for the DPOAE findings is ototoxicity from medications. In general the HIV+ individuals were exposed to more medications, both for the treatment of TB and HIV. But, the results from the ART comparison show that DPOAE levels do not differ between individuals on ART and not on ART. If ART had a significant toxic effect on the cochlea, this should have been apparent in the ART−/ART+ comparisons. Similarly, when the data were analyzed to examine the effect of TB status, no significant differences in DPOAE levels could be found between TB− and TB+ individuals (the TB+ individuals had been treated for TB). Overall, the data from the present study do not support the conclusion of significant cochlear toxicity from either ART or TB treatment. Although streptomycin is a known ototoxic drug, very few of the individuals treated for TB in this cohort had received streptomycin.
The HIV+ individuals might be more susceptible to ear infections, and so might have reduced DPOAE levels due to middle ear problems. But, the HIV+ and HIV− groups do not show any significant difference in the rates of abnormal tympanograms or in the rates of reporting a history of ear drainage. If middle ear problems were a significant cause of hearing difficulty in the HIV+ cohort, then they would likely have been reflected in a higher rate of abnormal tympanograms in the HIV+ group.
A direct effect of HIV on the cochlea is possible. Ultrastructural studies of the cochlea in patients with HIV have shown changes due to HIV infection (Pappas, Chandrasekar et al. 1994), and it is possible that the lower DPOAE levels in the HIV+ group might reflect damage to the cochlea from the HIV virus.
ART+, ART− comparison
Patients with HIV take a variety of medications, with the most common being reverse transcriptase inhibitors, protease inhibitors, antibiotics and antifungals. In a study of 99 HIV+ patients in Seattle, there was a significant association of ART with hearing loss in those > 35 years old (Marra, Wechkin et al. 1997). Additionally, case reports have shown ototoxicity in patients taking reverse transcriptase inhibitors (Simdon, Watters et al. 2001). In a prospective study, however, Schouten et al. (Schouten, Lockhart et al. 2006) followed 33 treatment naïve subjects who were started on ART regimens containing either zidovudine (AZT) or didanosine (ddI) and found no association between these medications and hearing loss. A study in mice showed that while the nucleoside reverse transcriptase inhibitors AZT and lamivudine (3TC) did not affect DPOAE levels or ABR thresholds, they did potentiate hearing loss from noise exposure (Bektas, Martin et al. 2008).
The data from the present study do not show any differences in DPOAEs between the ART− and ART+ groups, and do not support a direct ototoxic effect on the cochlea from the ARTs. The fact that the ART groups did not differ in measures of peripheral hearing ability (DPOAEs, thresholds), or in the rate of abnormal tympanograms, but that the ART+ group reported significant more trouble understanding speech and had higher gap detection thresholds point to a reduction in central processing abilities as a cause of the findings. These data are consistent with findings from other studies showing longer ABR latencies in HIV+ adults, and difficulty in localizing sound in infants born to HIV+ mothers (Pagano, Cahn et al. 1992; Bankaitis and Keith 1995; Castello, Baroni et al. 1998; Matas, Leite et al. 2006; Matas, Iorio et al. 2008).
At present it is not possible to determine definitively if the central auditory findings are related primarily to the HIV infection or to ART. To have been started on ART, the subjects in the ART+ group either needed to have had a low enough CD4 count, or to have significant enough clinical symptoms, to warrant treatment. Even though the ART− and ART+ groups do not differ in CD4 counts or duration of disease, those on ART can be considered to have more significant disease than those who are not, since at one point they met the criteria for starting ART. The hearing findings may be another indication that those in the ART+ group had more advanced or more symptomatic HIV infections.
The analysis of individual drugs did not reveal any particular drug that was associated with significantly elevated gap detection thresholds. The current study, however, may not have had adequate power to detect effects from individual drugs. Certain ART regimens might produce central nervous system side effects that manifest themselves as hearing difficulties. Also, ART regimens differ in how effective they are at reaching the CNS (Letendre 2011). Some ART regimens may treat CNS HIV inadequately, which is reflected as a central hearing deficit. Further study is needed to establish the cause of the central auditory processing findings.
Limitations
The data collected to date on speech perception in our study has been via self-report. Self-report can be unreliable. Ideally, the test regimen should directly measure the ability of HIV+ individuals to detect speech-in-noise using a speech-in-noise test. For this study, however, the need to collect comprehensive data had to be balanced against the length of the study protocol. The overall objective of the study was to identify the part of the hearing system most involved in the hearing difficulties, and this goal was accomplished.
The gap detection results can be influenced by training, attention, fatigue or drug and alcohol use. To minimize the effect of training, whenever possible we used the second visit where the subjects used the gap detection test. Within the HIV+ group, virtually all of the subjects had performed the gap detection test at least once before the test that was used for the data analysis. Also, the left ear results were used, because testing had shown that left ear gap detection threshold tended to be lower than the right ear. Nevertheless, we found that many people could not complete the gap test successfully. The breakdown for the percentage of people who did not complete the gap test in the different groups was (HIV− 28%, HIV+ 30%, ART− 30%, ART+ 30%). There was no evidence that the reason for the gap results was a greater ability to complete the test in one of the groups. Our observation is that individuals do not fail the gap test because they cannot detect gaps. Instead they have difficulty maintaining focus throughout the task and so don’t complete the threshold crossings needed to finish the test successfully. As a result their gap detection efforts do not converge on a threshold. In those that did complete the test, to compensate for loss of attention during the test, we used the best 3 reversals from each test.
Conclusion
On average, the HIV+ group had lower DPOAE values than the HIV− group suggesting possible cochlear damage in this group. These changes were apparent despite the fact that the HIV− group had greater reported noise exposure. These changes could be due to the HIV virus; the existing data do not suggest TB medications or ART as the cause of these findings.
The ART+ group showed changes consistent with a reduction in central auditory processing abilities. Although the ART+ group did not show significant differences in auditory thresholds, DPOAE levels, or tympanometry results compared to the ART− group, they did report significant problems with speech discrimination and had significantly higher gap detection scores. Possible explanations include damage to central auditory pathways from the HIV infection (i.e. the hearing deficits in HIV+ individuals could be another central nervous system (i.e. neurocognitive) side effect of HIV infection). Particular ART regimens may have neurotoxic effects on the central nervous system, and so might produce central nervous system side effects that manifest themselves as hearing difficulties. Some ART regimens may treat CNS HIV inadequately, allowing auditory pathways to be damaged even though other manifestations of HIV are improved. The data suggest that more complete assessments of central auditory function in HIV+ individuals are needed. Longitudinal monitoring of hearing in HIV+ patients is warranted, along with a more complete assessment of central auditory function, taking into account the various ART regimens used. Monitoring of central hearing parameters potentially could be a method to track central effects of either HIV or ART.
Supplementary Material
Acknowledgements
This work is supported by grant R01DC009972 from the National Institute on Deafness and Other Communication Disorders (NIDCD). Dr. von Reyn receives support from the Fogarty International Center, D43-TW006807. We gratefully acknowledge the assistance from Dr. James Saunders for the initial testing of the system in Nicaragua. We thank Dr. Brenda Lonsbury-Martin for her help with the proposal and with the protocol for DPOAE measurements. We would like to acknowledge the contribution of Stephanie Nagle to the development of the gap detection test. We thank the team at the DarDar clinic in Dar es Salaam, Tanzania who collected these data (Esther Kayichile, Kissa Albert, Safina Sheshe, Claudia Gasana, Mariane Mpessa, and Joyce Joseph). We also appreciate the support from audiologists Machemba Lawrence and Alfred Mathayo. We thank the team at Creare, Inc. that assembled and tested the hearing testing systems, particularly Nathan Brown. We appreciate the support of Erika Kafwimi and Sabrina Yegela who helped with building the video questionnaire and translating the questions.
Footnotes
Conflicts of Interest and Source of Funding:
No conflicts of interest
Supplemental Digital Content
Supplemental Digital Content 1. Text of the questions in the Health History and Hearing Status Questionnaires. pdf
Supplemental Digital Content 2. Graph that shows the performance of the gap detection test. pdf
Supplemental Digital Content 3. Graph showing the relationship between gap detection threshold and pure-tone average. pdf
References
- American_National_Standard. Specification for Audiometers. Melville, NH: Secretariat, Acoustical Society of America; 2004. [Google Scholar]
- American_National_Standard. Specification for Octave-Band and Fractional-Octave-Band Analog and Digital Filters. Melville, NH: Secretariat, Acoustical Society of America; 2009. [Google Scholar]
- Bankaitis AE, Keith RW. Audiological changes associated with HIV infection. Ear Nose Throat J. 1995;74(5):353–359. [PubMed] [Google Scholar]
- Bektas D, Martin GK, et al. Noise-induced hearing loss in mice treated with antiretroviral drugs. Hear Res. 2008;239:69–78. doi: 10.1016/j.heares.2008.01.016. [DOI] [PMC free article] [PubMed] [Google Scholar]
- Buckey JC, Fellows AM, et al. Pure-tone audiometric threshold assessment with in-ear monitoring of noise levels. International Journal of Audiology. doi: 10.3109/14992027.2013.821207. (in press) [DOI] [PMC free article] [PubMed] [Google Scholar]
- Castello E, Baroni N, et al. Neurotological auditory brain stem response findings in human immunodeficiency virus-positive patients without neurologic manifestations. Ann Otol Rhinol Laryngol. 1998;107(12):1054–1060. doi: 10.1177/000348949810701210. [DOI] [PubMed] [Google Scholar]
- Centers_for_Disease_Control_and_Prevention. 2007 NHIS Questionnaire. [Retrieved October, 4, 2012];2007 Jun 26; 2012 from http://www.cdc.gov/nchs/nhis/quest_data_related_1997_forward.htm 2007_NHIS.
- Chandrasekhar SS, Connelly PE, et al. Otologic and audiologic evaluation of human immunodeficiency virus-infected patients. Am J Otolaryngol. 2000;21(1):1–9. doi: 10.1016/s0196-0709(00)80117-9. [DOI] [PubMed] [Google Scholar]
- Gurney TA, Murr AH. Otolaryngologic manifestations of human immunodeficiency virus infection. Otolaryngol Clin North Am. 2003;36(4):607–624. doi: 10.1016/s0030-6665(03)00031-8. [DOI] [PubMed] [Google Scholar]
- Joffe MM, Rosenbaum PR. Invited commentary: propensity scores. Am J Epidemiol. 1999;150(4):327–333. doi: 10.1093/oxfordjournals.aje.a010011. [DOI] [PubMed] [Google Scholar]
- Khoza K, Ross E. Auditory function in a group of adults infected with HIV/AIDS in Gauteng, South Africa. S Afr J Commun Disord. 2002;49:17–27. [PubMed] [Google Scholar]
- Kohan D, Rothstein SG, et al. Otologic disease in patients with acquired immunodeficiency syndrome. Ann Otol Rhinol Laryngol. 1988;97(6 Pt 1):636–640. doi: 10.1177/000348948809700611. [DOI] [PubMed] [Google Scholar]
- Lahey T, Arbeit RD, et al. Immunogenicity of a protective whole cell mycobacterial vaccine in HIV-infected adults: a phase III study in Tanzania. Vaccine. 2010;28(48):7652–7658. doi: 10.1016/j.vaccine.2010.09.041. [DOI] [PMC free article] [PubMed] [Google Scholar]
- Letendre S. Central nervous system complications in HIV disease: HIV-associated neurocognitive disorder. Top Antivir Med. 2011;19(4):137–142. [PMC free article] [PubMed] [Google Scholar]
- Marra CM, Wechkin HA, et al. Hearing loss and antiretroviral therapy in patients infected with HIV-1. Arch Neurol. 1997;54(4):407–410. doi: 10.1001/archneur.1997.00550160049015. [DOI] [PubMed] [Google Scholar]
- Matas CG, Iorio MC, et al. Auditory disorders and acquisition of the ability to localize sound in children born to HIV-positive mothers. Braz J Infect Dis. 2008;12(1):10–14. doi: 10.1590/s1413-86702008000100004. [DOI] [PubMed] [Google Scholar]
- Matas CG, Leite RA, et al. Audiological and electrophysiological evaluation of children with acquired immunodeficiency syndrome (AIDS) Braz J Infect Dis. 2006;10(4):264–268. doi: 10.1590/s1413-86702006000400010. [DOI] [PubMed] [Google Scholar]
- Matas CG, Santos Filha VA, et al. Audiological manifestations in children and adults with AIDS. Pro Fono. 2010;22(3):269–274. doi: 10.1590/s0104-56872010000300019. [DOI] [PubMed] [Google Scholar]
- Michaels L, Soucek S, et al. The ear in the acquired immunodeficiency syndrome: I. Temporal bone histopathologic study. Am J Otol. 1994;15(4):515–522. [PubMed] [Google Scholar]
- Mirza A, Rathore MH. Human immunodeficiency virus and the central nervous system. Semin Pediatr Neurol. 2012;19(3):119–123. doi: 10.1016/j.spen.2012.02.007. [DOI] [PubMed] [Google Scholar]
- National_Center_for_Health_Statistics. National Health and Nutrition Examination Survey. 2010 2012, from http://www.cdc.gov/nchs/nhanes/nhanes2009-2010/questexam09_10.htm.
- Pagano MA, Cahn PE, et al. Brain-stem auditory evoked potentials in human immunodeficiency virus-seropositive patients with and without acquired immunodeficiency syndrome. Arch Neurol. 1992;49(2):166–169. doi: 10.1001/archneur.1992.00530260068022. [DOI] [PubMed] [Google Scholar]
- Pappas DG, Jr, Chandrasekar HK, et al. Ultrastructural findings in the cochlea of AIDS cases. Am J Otol. 1994;15(4):456–465. [PubMed] [Google Scholar]
- Schouten JT, Lockhart DW, et al. A prospective study of hearing changes after beginning zidovudine or didanosine in HIV-1 treatment-naive people. BMC Infect Dis. 2006;6:28. doi: 10.1186/1471-2334-6-28. [DOI] [PMC free article] [PubMed] [Google Scholar]
- Simdon J, Watters D, et al. Ototoxicity associated with use of nucleoside analog reverse transcriptase inhibitors: a report of 3 possible cases and review of the literature. Clin Infect Dis. 2001;32(11):1623–1627. doi: 10.1086/320522. [DOI] [PubMed] [Google Scholar]
- van der Westhuizen Y, Swanepoel DW, et al. Auditory and otological manifestations in adults with HIV/AIDS. Int J Audiol. 2012 doi: 10.3109/14992027.2012.721935. [DOI] [PubMed] [Google Scholar]
- Weihing JA, Musiek FE, et al. The effect of presentation level on the Gaps-In-Noise (GIN) test. J Am Acad Audiol. 2007;18(2):141–150. doi: 10.3766/jaaa.18.2.6. [DOI] [PubMed] [Google Scholar]
- York MK, Franks JJ, et al. Verbal working memory storage and processing deficits in HIV-1 asymptomatic and symptomatic individuals. Psychol Med. 2001;31(7):1279–1291. doi: 10.1017/s0033291701004494. [DOI] [PubMed] [Google Scholar]
Associated Data
This section collects any data citations, data availability statements, or supplementary materials included in this article.


