

Abstract
Background
Chronic alcohol exposure can change splice variant expression. The gamma-aminobutyric acid type B (GABAB) receptor undergoes splicing and is an alcoholism treatment target, but there is little information about splicing changes in this receptor in alcoholics. We studied GABAB receptor subunit 1 (GABAB1) splicing in alcoholic postmortem brains.
Methods
To maximize GABAB1 splice junction identification, we combined gene specific libraries with RNA-seq. Splice junctions and mapped reads were also found from intronic and intergenic regions. We compared GABAB1 splice junctions in prefrontal cortices from 14 alcoholic and 15 control subjects and introduced new strategies, reads per kilobase of splice junction model per million uniquely mapped reads (RPJM) and reads per kilobase of gene model per million mapped reads (RPGM), for quantitating splice junction and gene expression.
Results
Novel splice junction detection indicated that the GABAB1 gene is at least two times longer than the previously reported gene length. GABAB1 exon and intron RPGM data showed low expression at the 5’ end exons and exon grouping. This indicated that there are short splicing variants in addition to GABAB1a, the longest known major transcript. We found that chronic alcohol altered exon/intron expression and splice junction levels. Decreased expression of the gamma-aminobutyric acid (GABA) binding site, a transmembrane region (TM), and a microRNA (miRNA) binding site may decrease normal GABAB1 transcript population and thereby decrease normal signal transduction in alcoholics.
Conclusions
We discovered novel, complex splicing of GABAB1 in human brain and showed that chronic alcohol produces additional splicing complexity.
Keywords: alcoholism, human prefrontal cortex, GABAB receptor, RNA-seq, splice junction, exon/intron expression
Introduction
GABAB receptors have been implicated in regulation of alcohol drinking. The positive allosteric modulator, GS39783, suppresses alcohol drinking and reinforcement in rats (1). A GABAB receptor agonist, gamma-hydroxybutyrate, can reduce voluntary ethanol drinking and withdrawal symptoms in humans and is a treatment for alcoholism (2, 3). Another agonist, baclofen, may also be effective in treating the disease (4).
Previous microarray studies showed strong GABAB1 expression in human alcoholic prefrontal cortices (5, 6). However, these microarray experiments used cDNA probes, and two out of three GABAB1 probes were complimentary to regions apparently generated by unknown splicings. For example, clone 300899 was aligned to GABAB1 intron 4. It is a common intron region from the RefSeq Genes model and major GABAB1 splicing variant (7). Five different splicing variants were cloned containing clone 300899 (7, 8) including GABAB1m spliced out at exon 6 (7). Another probe, clone 2312175, targeted an unknown splicing-out at exon 23. Thus, the microarray experiments and splice variants suggested complex GABAB1 gene splicing in human brain (7-10).
Among the three microarray probes, only clone 300899 showed increased expression in alcoholics (5, 6). This suggested a specific GABAB1 splicing change is related with chronic alcohol exposure. Signal intensities of the three probes were different, and the difference was not explicable based on known splicing variants. This suggested that unknown GABAB1 splicing variants are differentially expressed in alcoholic brain. Single nucleotide polymorphisms (SNPs) near splicing sites also alter splicing and may be associated with alcoholism (11-13). Chronic ethanol exposure and withdrawal increased 5’ splice variant expression of the N-Methyl-D-aspartic acid receptor subunit, NR1, without NR1 3’ variant expression changes (14). The L-type voltage-gated Ca2+ channel, α1c, has two splice variants, α1c-1 and α1c-2; chronic ethanol treatment enhanced splicing resulting in a specific increase in the α1c-1 population (15). Other studies have also shown that splicing changes in brain can contribute to a wide range of neuropsychiatric disorders (11).
One approach to identifying novel splice junctions of GABAB1 is to query the National Center for Biotechnology Information (NCBI) database. However, this database may only contain a small fraction of the actual splice variants (16). We propose that many unknown splicings of the GABAB1 gene may exist and propose use of RNA-seq to detect new GABAB1 variants and to quantitate splicing differences in alcoholic brain.
Materials and Methods
RNA sample collection
Commercial human prefrontal cortex RNA was obtained from Ambion (Austin, TX). Fifteen control and fourteen alcoholic postmortem prefrontal cortices were obtained from the Tissue Resource Centre at the University of Sydney. The samples were matched as closely as possible by age, gender, brain pH, RNA integrity number, and post-mortem interval (Table S1 in Supplement 1). Control subjects were defined as those who drink <20g/day (most were social drinkers or teetotallers). Alcoholics were defined based on alcohol consumption of >80g/day. Diagnoses were confirmed by physician interviews, hospital medical record reviews, questionnaires to next-of-kin, and from pathology, radiology, and neuropsychology reports. The Diagnostic and Statistical Manual of Mental Disorders (DSM-IV) diagnosis was based on a clinical assessment by specially trained staff in psychiatry or psychology (17). After RNA extraction, DNase (Ambion, Austin, TX) was treated?, and ribosomal RNA (rRNA) was depleted using the RiboMinus kit (Invitrogen, Carlsbad, CA).
RNA-seq library construction and sequencing
For gene specific library, gene specific primer (GB1-Cter-1st-4, 5’-TCCCAGAGGTATGAG-3’) was optimized for reverse transcription at 42°C using SMARTer PCR cDNA Synthesis Kit (Clontech, Mountain View, CA). Using a template switching method (18), double strand cDNAs (dscDNAs) were generated from the commercial prefrontal cortex RNAs. For the amplification step, SMARTer2A-22mer (5’-AAGCAGTGGTATCAACGCAGAG-3’) was designed based on a provided primer, SMARTerIIA Oligonucleotide, which was bound at the 5’ end of transcripts during the template switching step. After amplification with SMARTer2A-22mer and another gene specific primer (GB1-Cter-2nd-1, 5’- CTACTGGCCTGTCCTCCCTCA-3’), dscDNA generation was confirmed. Gel extraction removed unbound primers and small amplification products. Following the SOLiD™ 3 System Library Preparation Guide (ABI, Carlsbad, CA), gene specific library was prepared. For libraries of alcoholic and control samples, we used previously described primer sets (19).
Whole transcriptome libraries were prepared using total RNAs from 15 control and 14 alcoholic postmortem prefrontal cortices and commercial RNAs following the SOLiD™ Total RNA-Seq Kit (ABI, Carlsbad, CA). The rRNA depleted RNAs were fragmented, and adaptors were ligated to their ends; cDNAs were then synthesized. The gene specific and whole transcriptome libraries were sequenced using the ABI SOLiD system.
Data analysis for RNA-seq data
Total raw reads were filtered by sequencing quality. For every read, the number of quality values that were below 8 was counted. The reads were removed if the numbers were over 9 or 14 for 35mer or 50mer single end reads, respectively. Noncoding RNAs (mostly rRNAs and transfer RNAs) and adaptors were filtered out using Mapreads mapper (ABI, Carlsbad, CA). Two mismatches out of 20mer reads were allowed for the mapper. The filtered sequencing data were modified to .fq files using fq_all2std.pl program (http://maq.sourceforge.net/fq_all2std.pl), removing reads that contain quality values of -1. For each sample, TopHat mapping was performed against the human reference genome (hg18) using default options (20). To visualize the mapping data, .sam files were modified using igvtools (http://www.broadinstitute.org/software/igv/download) and visualized using the Integrative Genomics Viewer (IGV) (http://www.broadinstitute.org/software/igv/) including another TopHat output (.wig file).
To maximize splice junction mining from whole transcriptome libraries, a splice junction search step was implemented prior to final mapping. At this step we collected splice junctions from the .bed files of the individual mapping results from all gene specific and whole transcriptome libraries. After the combined .bed files were converted uniquely to a .juncs file, the alcoholic and control whole transcriptome library data were remapped using the .juncs file with -j option of TopHat. After recollecting splice junction data from the mapping, we generated a new .juncs file that contained additional splice junction information and visualized it using the UCSC genome browser.
Expression analysis using RPGM
Using supercomputers at the Texas Advanced Computing Center, RPGMs were calculated for genes, exons, and introns based on the formula below:
Mapped reads were counted for each gene from whole transcriptome libraries of alcoholic and control samples. The mapped reads were normalized per million unique mapped reads of the whole human reference genome per kilobase of gene length.
RPGM were calculated for the three different GABAB1 gene lengths. After log2 transformation of the RPGM values, we used two-tailed unpaired t-tests. We also calculated genome wide RPGMs for all genes, transcripts, exons, and introns based on RefSeq Genes model. The RPGM value differences between alcoholic and control groups were tested using DEGseq (21). GABAB1 specific data were then selected from the analysis.
Splice junction analysis in alcoholic samples
To study GABAB1 splice junction changes in alcoholic brains, we calculated RPJMs for all splice junctions. The formula below was used for the RPJM calculation:
Mapped reads were counted for each splice junction from alcoholic and control whole transcriptome libraries. The mapped reads were normalized per total mapped read number per kilobase of splice junction area length where mapped reads can reach the splice junction. The splice junction area length is (read length -1) × 2.
After calculating genome wide RPJMs, RPJM value differences between alcoholic and control groups were also analyzed using DEGseq. GABAB1 splice junctions that significantly change in alcoholic brains were selected only if they were found in multiple samples.
Results
Gene specific library construction to maximize GABAB1 splice junction detection
Gene specific library was designed for RNA-seq to maximize splice junction identification in the GABAB1 gene. Current approaches to RNA-seq library construction often utilize random primers or oligo(dT) primers for reverse transcription (22-26). However, these approaches do not generate enough mapped reads to find rare splice junctions from a single RNA-seq run. To provide a large population of gene specific reads, we constructed the library using gene specific reverse transcription (Figure 1).
Figure 1. Gene specific library construction.
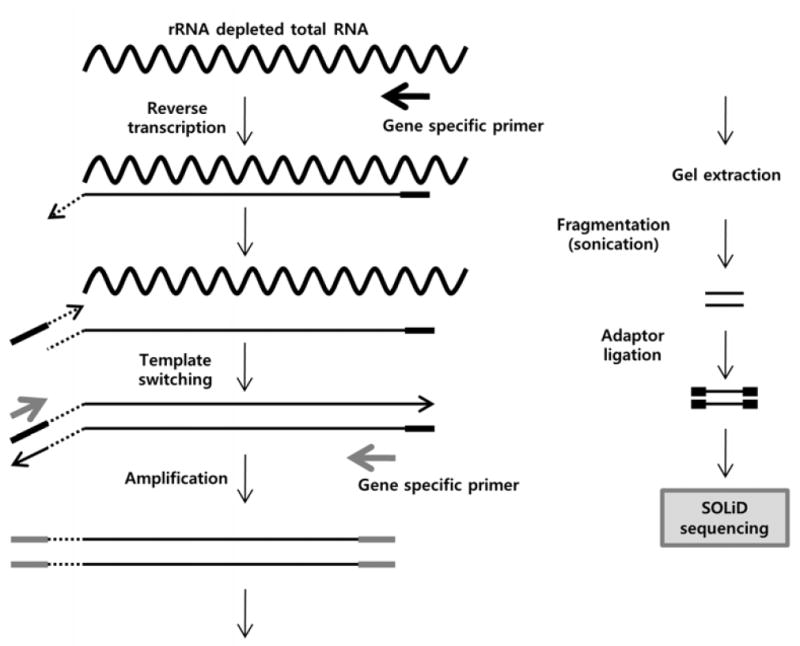
Ribosomal depleted total RNA was used to prepare the gene specific library. Single stranded cDNA (sscDNA) was generated by reverse transcription using a gene specific primer. Double stranded (dscDNA) was synthesized by template switching, and then another gene specific primer was used for amplification. After gel extraction, size selected dscDNAs were sonicated, and adaptors were ligated. The gene specific library was sequenced using the ABI SOLiD™ system.
The gene specific library had a significantly greater number (152-fold) of GABAB1 specific mapped reads than the whole transcriptome library though they have similar total mapped reads (Figure 2; Table S2 in Supplement 1). In addition, a significantly greater number of splice junctions were identified in the gene specific library (Figure 2). It identified 1,076 reads that contained GABAB1 specific splice junctions compared to only 18 reads from the whole transcriptome library. A greater number of mapped reads was observed on the 3’ end of the gene specific library (Figure 2A). The distribution likely resulted from gene specific reverse transcription or postmortem RNA degradation.
Figure 2. Comparison of gene specific and whole transcriptome libraries.
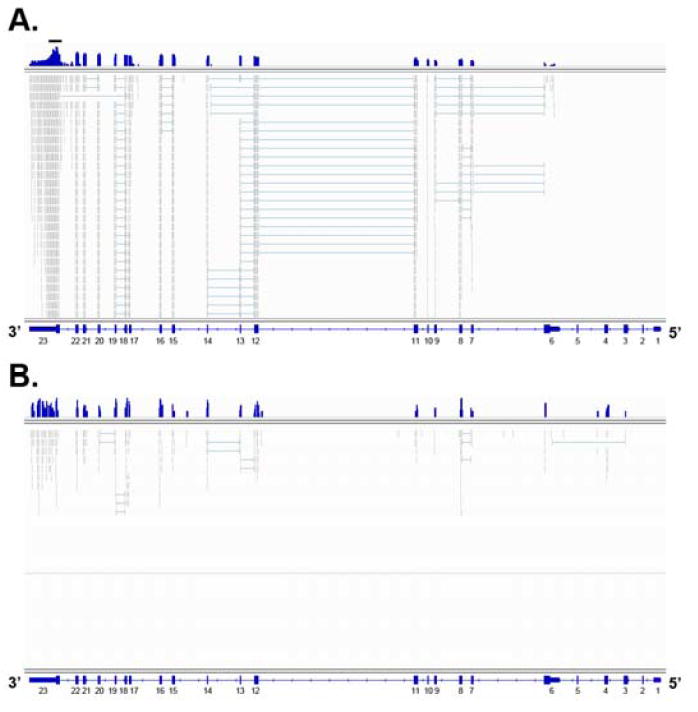
All TopHat mapping output files, .wig and .sam, were loaded on the IGV and are shown at the GABAB1 gene in blue and grey, respectively. The .wig files (blue) contain the number of mapped reads at each nucleotide position on top. The .sam files (grey) contain individual mapped reads. For the .sam files, the thick lines represent mapped reads, and the thin lines represent splice junctions. Mapped read numbers were compared in log space using the .wig files. With the two files, the gene specific library and whole transcriptome library results are shown in A and B, respectively. Because GABAB1 is negatively oriented at chromosome 6, the 5’ and 3’ ends of GABAB1 are located on the right and left during IGV visualization, respectively. For the gene specific library, only the upper portion of the .sam file data is shown due to space limitations. The gene specific library results had more GABAB1 specific mapped reads and splice junctions than the whole transcriptome library. For this comparison, both libraries were prepared from the same commercial human prefrontal cortex RNAs. The black bar on top of Figure A represents the location of gene specific primers. Exon numbers are labeled below the gene model of A and B.
Splice junction search maximization mapping
To maximize splice junction identification, a spice junction search step was added prior to the final mapping (Figure 3) because TopHat mapping using externally supplied splice junction information can identify additional splice junctions (http://tophat.cbcb.umd.edu/manual.html). For this step, three gene specific libraries provided a large population of GABAB1 gene specific splice junctions. After mapping individual libraries, all splice junction data were collected and used for the final mapping of the alcoholic and control whole transcriptome libraries (Figure 3).
Figure 3. Data analysis to maximize splice junction detection.
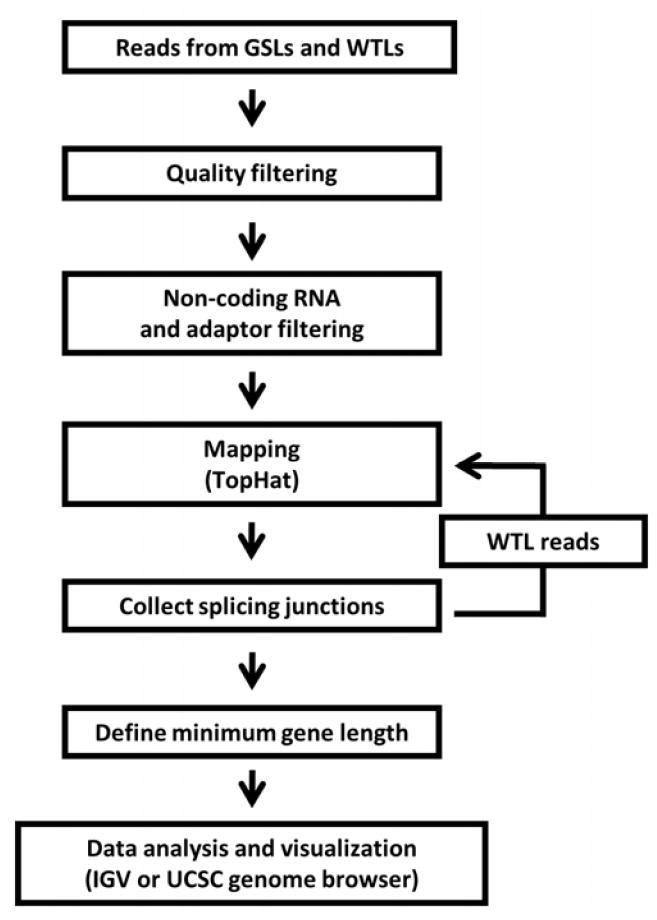
To maximize the identification of splice junctions using TopHat, a splice junction search step was added to the data analysis pipeline. We used gene specific libraries (GSLs) and whole transcriptome libraries (WTLs) prepared from commercial and postmortem human prefrontal cortices. After filtering low quality reads and undesired sequence containing reads, the data were converted to .fq files. After TopHat mapping, splice junction information was collected for the remapping step. We used the whole transcriptome library data from 14 alcoholic and 15 control human brain samples for the remapping step. After recollecting splice junctions, we defined the minimum GABAB1 gene length.
The remaining read number and ratio compared to raw reads were calculated for each mapping step (Table S3 in Supplement 1). Control and alcoholic samples had similar ratios from each step though there were some individual variations. Based on the quality filter, about 20% raw reads were filtered out, and the second filter for non-coding RNAs and adaptors left approximately 53% raw reads. After TopHat mapping, the unique mapped reads were generated with about 41% mappability.
GABAB1 splice junctions and gene lengths
After the final mapping, unique splice junction data were collected and visualized using the UCSC genome browser (Figure 3 and 4A). Twenty splice junctions were found among the 22 splice junctions from the RefSeq Genes model. An additional 43 splice junctions were also discovered. Therefore, there are at least 65 splice junctions associated with GABAB1 (Figure 4). The 43 newly identified splice junctions are rare splicings. Other computational junction discovery approaches have identified rare splice junctions from other genes (20, 27). The TopHat false discovery rate is lower than 1% for rare splice junctions (20, 28).
Figure 4. GABAB1 splice junctions and gene boundaries.
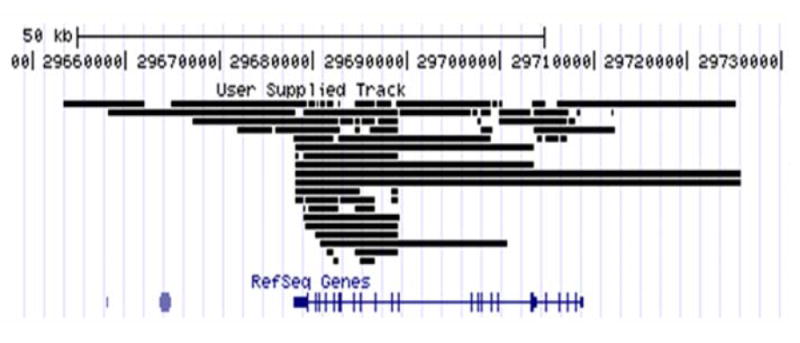
After combining splice junctions from the gene specific and the whole transcriptome libraries, we found that there are at least 65 splice junctions associated with the GABAB1 gene. The 65 splice junctions were visualized with the UCSC genome browser using a .juncs file and hg18. From these results, we determined that the GABAB1 gene is at least 72,333bp (chr6:29,653,437-29,725,769) long, which is about 41,000bp larger than the expected size of 30,958bp (chr6:29,677,984-29,708,941) based on the RefSeq Genes model. From top to bottom, the tracts include User Supplied Track (.juncs file loaded track) and RefSeq Genes.
Based on these results, the minimum GABAB1 gene length is estimated to be 72,333bp (chr6:29,653,437-29,725,769) of hg18 (Figure 4). This GABAB1 gene length is 41,375bp longer than the known GABAB1 length of 30,958bp (chr6:29,677,984-29,708,941). The minimum GABAB1 gene length from UCSC genome browser databases (i.e., human mRNAs from GeneBank and human ESTs that have been spliced) is 100,266bp (chr6:29,631,387-29,731,652) (Figure S1 in Supplement 1). These findings provide strong evidence that the GABAB1 gene is larger than previously reported.
We categorized the 65 GABAB1 splice junctions into four groups: 22 known, 5 known-alternative, 8 partial-novel, and 30 novel splice junctions (Figure S2 in Supplement 1). The known splice junctions represent those found in the RefSeq Genes model. The known-alternative splice junctions represent different splicing site combinations of the known splice junctions. The partial-novel splice junctions represent junctions with one known splicing site and another unknown site. The novel splice junctions represent junctions where both splicing sites are unknown.
GABAB1 gene expression differences between alcoholics and controls
We compared GABAB1 gene expression levels between alcoholic and control subjects using whole transcriptome libraries (Figure 5). Reads per kilobase of exon model per million mapped reads (RPKM) is most commonly used for RNA-seq expression studies and is calculated for transcripts considering known exons (29). However, we discovered unknown splice junctions at introns and intergenic regions, and many reads were also mapped there. Thus, RPGM was introduced to consider these regions. In the genome wide study, RPGM allowed calculation of expression levels from each gene as well as any small interesting regions within the gene model.
Figure 5. GABAB1 gene expression comparison in alcoholic and control brains.
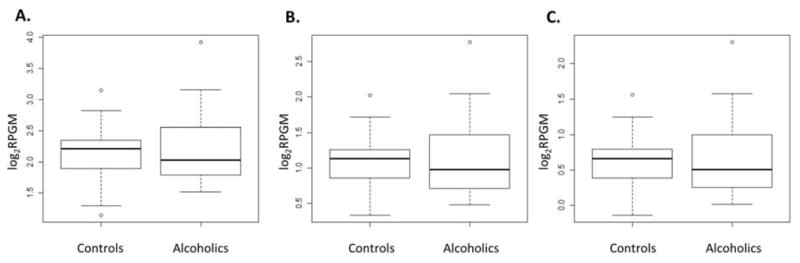
GABAB1 expression was compared in 14 alcoholic and 15 control brains. A. At the known GABAB1 gene boundary of the RefSeq Genes model, expression levels were compared between groups. After log2 transformation of RPGM values, unpaired t-tests were performed to define statistically significant differences. Y-axis represents log2 RPGM. From top to bottom, the horizontal lines of each boxplot represent the largest non-outlier, upper quartile, median, lower quartile, and the smallest non-outlier values, respectively. B. GABAB1 gene expression levels were compared based on the minimum GABAB1 gene boundary from RNA-seq data. C. Gene expression levels were assessed based on the minimum GABAB1 gene boundary obtained from the UCSC genome browser database.
RPGMs were calculated from the three different GABAB1 gene boundaries: 1) known GABAB1 gene boundary from the RefSeq Genes model, 2) minimum GABAB1 gene boundary from RNA-seq, and 3) GABAB1 gene boundary from UCSC genome browser databases (Figure 5). However, the expression levels of these three gene boundaries did not significantly change in alcoholics. To confirm GABAB1 gene expression levels, RPGM values were calculated for all genes from the RefSeq Genes model and analyzed using DEGseq (21). As shown in Figure 5A, GABAB1 gene expression did not change significantly.
DEGseq can analyze normalized transcript expression data, such as RPKM. To determine if RPGM value is also an appropriate input for DEGseq, we compared the values. Both RPGM and RPKM values, fold changes, and Z-scores were significantly correlated (their p-values: < 2.2e-16) (Figure S3A, B, C in Supplement 1). RPGM and RPKM showed similar MA plot distributions (Figure S3D, E in Supplement 1) and identified a similar ratio of significantly changed genes in alcoholic brains. The top 100 significantly changed transcripts were also mostly conserved (Figure S3F in Supplement 1). This indicates the validity of using our RPGM calculations in DEGseq analysis.
GABAB1 exon and intron expression changes in alcoholics
We next asked if individual GABAB1 exon and intron expression levels were different in alcoholic brains. GABAB1 has 23 exons and 22 introns based on the RefSeq Genes model (Figure 4). Among the exon and intron RPGM values, intron RPGMs were much smaller than exon expression levels although exon RPGM values vary among individual exons (Figure 6). RPGMs for exons 1 to 6 were much lower than the other exons. This indicates that the GABAB1a splice variant containing all 23 exons cannot represent the overall GABAB1 gene expression even though it is regarded as a major GABAB1 transcript and used for most GABAB1 functional studies (7, 9). Various exon combinations can yield numerous short GABAB1 transcripts, and their combined expression levels are more representative of overall GABAB1 expression.
Figure 6. GABAB1 exon and intron expressions.
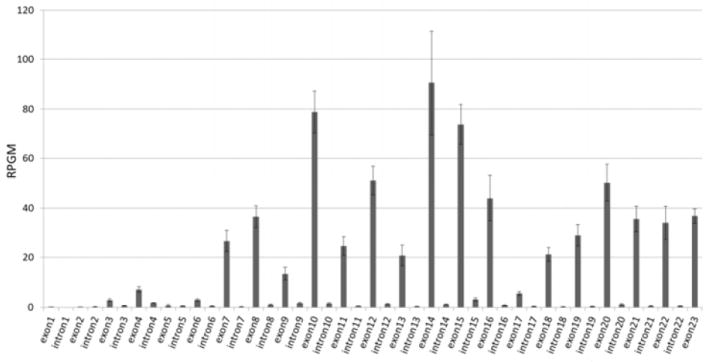
RPGM values were calculated for each GABAB1 exon and intron from15 alcoholic and 14 control samples. 5’ GABAB1 exons showed much lower expression and indicated the abundance of small splicing variants instead of splicing variants containing all 23 exons. Y-axis represents RPGM values. Data are expressed as the mean ± standard error of the mean (SEM).
For each GABAB1 exon and intron, we assessed expression changes in alcoholic brains. From genome wide exon and intron RPGMs, 23 GABAB1 exons were differentially expressed in alcoholic brains (Table S4 in Supplement 1). Among them, 9 exons showed increased expression and 2 exons showed decreased expression while 12 were unchanged in alcoholics. Based on the changes in expression and direction of change, the exons were grouped into 5 groups: exons 7-8, exon 10, exons 11-12, exons 14-16, and exon 17. Within groups, the changes in expression (Figure 6) and direction (Table S4 in Supplement 1; Figure 7) were similar. The groups were separated by discontinuous expression patterns.
Figure 7. GABAB1 exon, intron, and splice junction changes in alcoholic brains.
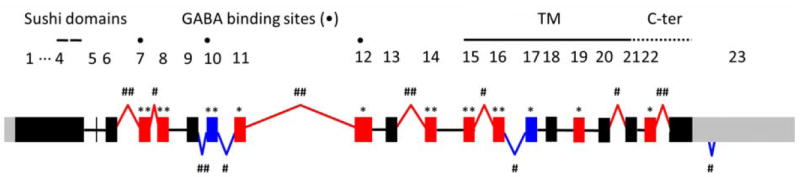
Exon and intron expression and splice junctions were compared between alcoholic and control brains. Based on the RefSeq Genes model, RPGM values were calculated for all exons and introns. For all splice junctions found from TopHat mapping, RPJMs were calculated. Among significant RPGM and RPJM changes, GABAB1 specific data were selected and summarized. The expression of 11 exons was changed in alcoholic brains. In alcoholic brains, exons 10 and 17 expression decreased while increases were observed for 9 exons (7, 8, 11, 12, 14, 15, 16, 19, and 22). Exons 7-8, exon 10, exons 11-12, exons 14-16, and exon 17 were grouped based on expression directions and levels in Figure 6. Two other splice junction changes did not alter neighboring exon expression and showed the complexity of GABAB1 splicing. Red and blue rectangles indicate significant expression increases and decreases in exons, respectively. ** and ## indicate p-values < 0.001; * and # represent p-values < 0.05. Red and blue bent lines represent splice junctions that significantly increased and decreased in alcoholic brains, respectively.
GABAB1 splice junction changes in alcoholics
To study GABAB1 splice junction changes in alcoholics, we calculated RPJM for each junction. The RPJM calculation also considered the intron and intergenic regions which is critical given that many unknown splice junctions and mapped reads were found at these regions. Among significantly changed RPJMs in the genome wide level, 11 differentially expressed GABAB1 junctions were found (Figure 7) including 10 known and one novel splice junction(s) (Table S5 in Supplement 1).
The changes in splice junctions could explain most exon and intron changes in alcoholic brains. Splice junctions increased at exons 6-7 and exons 7-8, and they potentially altered expression of neighboring exons 7 and 8 explaining why their expression increased. Splice junctions decreased at exons 9-10 and exons 10-11 indicating that exon 10 spliced in transcripts were less abundant in alcoholic brains. The increase in splice junctions at exons 11-12 may explain why their expression increased. Splice junctions increased at exons 13-14 suggesting expression increase of transcripts containing exon 14. Lastly, splice junctions increased at exons 15-16 and deceased at exons 16-17 indicating specific expression increases in transcripts containing exon 15 and 16 (Figure 7).
Changes in splice junctions did not always change neighboring exon expression levels (Figure 7). A known junction at exons 20-21 and a novel splice junction at exon 23 changed without affecting surrounding exon expression levels. Exons 20 and 21 were the third and fourth left end exons in Figure 4, respectively. Between the two exons, many unknown novel splice junctions were identified from our RNA-seq junction data which possibly diminished expression changes despite the fact that their splice junctions increased in alcoholic brains. A novel splice junction spliced out 108bp at the 3’ UTR and showed decreased expression in alcoholic brains. This novel splice junction was not as abundant as other known junctions (27, 30), and its length was much shorter than the 1,489bp exon 23. Therefore, this splice junction could not change the expression level of exon 23. However, a miRBase search (http://www.mirbase.org/) showed that this splice junction is a possible target of two miRNAs (hsa-miR- 3916 and hsa-miR-769-5p) suggesting that noncoding RNAs may decrease the population of normal GABAB1 transcripts and thereby decrease signal transduction.
Discussion
This study provides the first demonstration that gene specific RNA-seq can detect and quantify unexpected rare splice junctions and shows novel splicing complexity of the GABAB1 gene. Gene specific libraries were used to query whole transcriptome libraries for splice junctions and exon/intron usage changes in prefrontal cortex from alcoholics. Among the 65 GABAB1 splice junctions, about 45 were previously unknown rare junctions. Other studies have also identified rare splice junctions from different genes and organisms (27, 30). Splicing can generate new variants with unique functions, e.g. down-regulating other major splicing variants (7-9, 31-33), controlling transcript intracellular localization (34, 35), or providing novel functions (36, 37). Here, we showed that chronic alcohol abuse alters GABAB1 variant production without altering the overall gene expression. Our results from the GABAB1 gene raise the possibility that chronic alcohol abuse may affect the splicing of other genes in brain and other tissues. This is supported by our preliminary genome wide analysis showing many changes in exons/introns and splice junctions.
To study gene expression and splice junctions, we employed two new strategies, designated as RPGM and RPJM. From RNA-seq mapping, we discovered numerous mapped reads at known intron regions, and deep splice junction searches using a gene specific library also identified many novel splice junctions at known intronic and intergenic regions. Previously, RPKM has been used to study gene expression although it is calculated based only on exon models excluding intron and intergenic regions (29). To allow a higher resolution of gene specific splicing, we included sequence information from intronic and intergenic regions and modified the standard RPKM to consider these regions thus defining a new strategy referred to as RPGM. While RPKM is only used for calculations of full-length transcript expression levels, RPGM can be used from the gene level to small regions, such as exons and introns. If gene lengths are larger than the RefSeq Genes model (as observed for GABAB1), RPGM can be calculated based on the new gene lengths. We further considered splice junctions in exon, intron, and intergenic regions and defined a calculation referred to as RPJM. Previous research has only identified splice junctions without comparing them quantitatively (27, 30). However, the RPJM strategy introduced here allows quantitative comparisons among experimental groups.
Exons were grouped based on similar expression patterns and large RPGM differences from their neighboring exons. These groups showed increased or decreased expression in alcoholic brains as supported by RPJM changes. However, the expression changes seen with individual exon groups were apparently not large enough to change overall GABAB1 expression. The reasons include the possibility of transcript lengths that are much shorter than the whole GABAB1 gene. It is also due to the finding that some exons showed decreases in expression whereas others showed increases though exon GC content difference could affect the RPGM calculation. For all 23 GABAB1 exons, 9 exons increased, 2 exons decreased, and 12 exons did not change. This expression pattern probably prevented an overall GABAB1 expression change in alcoholic brains.
Our RNA-seq study demonstrated that a known splice junction at exons 22-23 increased RPJM values in alcoholic brain. However, exons 14-16 and 5-6 did not show RPJM changes (Figure 7). Quantitative real-time PCR data also generated the same patterns as the RNA-seq splice junction study (Figure S4A in Supplement 1). RPGM changes at exons and introns were consistent with quantitative real-time PCR (Figure S4B in Supplement 1). Previous microarray studies using cDNA and oligonucleotide probes were also consistent with most of our RNA-seq data. The alcoholic and control groups used for the confirmation experiments are slightly different due to a limited sample number. Although the increase previously seen in one cDNA microarray probe signal at intron 4 was not confirmed in our RNA-seq data, four array probes targeting exon 23 and another probe for intron 5 showed no expression changes in agreement with our current RNA-seq data (5, 6, 17). Interestingly, an RNA-seq study of hippocampus found that GABAB1 transcripts decrease in human alcoholics and cocaine addicts as well as alcohol preferring rats that are genetically predisposed to excessive alcohol consumption (38). However, it is unknown which splice variants were detected and quantified in this study.
It is of interest to note the functional importance of exons 10 and 17, which showed decreased expression in alcoholic brains. Exon 10 is known to participate in GABA binding to the receptor (7, 39). A loss of GABA binding sites would likely diminish GABA response, and signal transduction resulting from receptor activation would be less efficient. Exon 17 contains the entire TM 3 as well as intracellular and extracellular regions between neighboring TMs. G proteins bind to the intracellular region between TM 3 and 4 (7), and without exon 17 GABAB receptors are not able to transfer signals through G proteins. At exon 23, alcoholic brains showed a RPJM decrease of a novel splice junction that is a potential target for miRNAs at 3’ UTR. Therefore, decrease of the miRNA target site splicing-out would result in more of this target site in alcoholic brains. This could allow miRNAs to destabilize GABAB1 transcripts that contain the miRNA target site including the major GABAB1 splicing variant as well as some short splicing variants. Although overall GABAB1 gene expression does not change in alcoholic brains, an increase in abnormal variants could nevertheless decrease the fraction of normal GABAB receptors.
Chronic alcohol might also alter other gene splicing events. However, GABAB1 is the major splicing target following chronic alcohol since it showed the most known splicing junction changes per 1,000bp gene length among GABAB signaling pathway genes (Table S6 in Supplement 1). Taken together, these results raise the possibility that splicing alteration may reduce GABAB receptor function in alcoholic brains, and future functional studies addressing this hypothesis are warranted. This hypothesis is consistent with studies showing chronic alcohol treatment reduces GABAB receptor function in brain (40).
The GABAB1 gene length based on the UCSC genome browser database was longer than the gene length found from the gene specific library due to two rare splicing junctions. The two rare junctions are the 3’ end junction (left end arrow in Figure S1 in Supplement 1) and the 5’ end junction (right end arrow in Figure S1 in Supplement 1). The junction area must have low expression because there is no identical junction finding. TopHat junction identification requires enough read depth to form coverage islands (http://tophat.cbcb.umd.edu/manual.html). Therefore, it is hard to find splice junctions from the less expressed area. Because reverse transcription using gene specific primer starts from the 3’ UTR to the 5’ end, it is also difficult to identify the 3’ end junction.
There are potential implications of GABAB1 splicing changes in alcoholic prefrontal cortices. First, optimal function of this brain region is required for decision making and reward pathway regulation, and prefrontal cortex function reduction is linked with dependence on alcohol and other drugs (5, 41, 42). Second, genetic and genomic analyses of excessive alcohol consumption in rodent models and humans point to a critical role of GABAergic transmission (38, 43). Third, drugs acting on GABAB receptors have been used for alcoholism treatment. In particular, baclofen, a GABAB agonist, may be effective at high doses (4) but was not beneficial at lower doses (44).Thus, it is possible that the GABAB receptor remodeling by chronic alcohol abuse may be one reason that reduce its effectiveness, requiring higher than expected doses of baclofen needed for successful treatment.
In summary, we provide the first demonstration that gene specific RNA-seq can detect and quantify unexpected rare splice junctions, and we show novel splicing complexity of the GABAB1 gene suggesting that this gene is much longer than previously known. We introduce two new strategies for comprehensive analysis of gene expression and splice junctions and report novel GABAB1 splicing perturbation following chronic alcohol in human brain. RNA-seq provides a powerful tool for divulging the role of gene expression and splicing variants in alcoholism and other psychiatric diseases.
Supplementary Material
Acknowledgments
We thank Jason Wall, Dr. Scott Hunicke-Smith, Dhivya Arasappan, and Dr. Gyoungju Nah for technical support and advice. We also thank Dr. Jody Mayfield for comments on the manuscript.
This research was supported by the National Institute on Alcohol Abuse and Alcoholism (NIAAA) grants AA12404, AA019382, AA020926, and AA016648. NIAAA had no role in study design, data collection and analysis, decision to publish, or preparation of the manuscript.
Footnotes
Financial Disclosures
All authors report no biomedical financial interests or potential conflicts of interest.
Publisher's Disclaimer: This is a PDF file of an unedited manuscript that has been accepted for publication. As a service to our customers we are providing this early version of the manuscript. The manuscript will undergo copyediting, typesetting, and review of the resulting proof before it is published in its final citable form. Please note that during the production process errors may be discovered which could affect the content, and all legal disclaimers that apply to the journal pertain.
References
- 1.Bradford JR, Hey Y, Yates T, Li Y, Pepper SD, Miller CJ. A comparison of massively parallel nucleotide sequencing with oligonucleotide microarrays for global transcription profiling. BMC Genomics. 2010;11:282. doi: 10.1186/1471-2164-11-282. [DOI] [PMC free article] [PubMed] [Google Scholar]
- 2.Schweitzer P, Roberto M, Madamba SG, Siggins GR. gamma-hydroxybutyrate increases a potassium current and decreases the H-current in hippocampal neurons via GABAB receptors. J Pharmacol Exp Ther. 2004;311:172–179. doi: 10.1124/jpet.104.069534. [DOI] [PubMed] [Google Scholar]
- 3.Cammalleri M, Brancucci A, Berton F, Loche A, Gessa GL, Francesconi W. Gammahydroxybutyrate reduces GABA(A)-mediated inhibitory postsynaptic potentials in the CA1 region of hippocampus. Neuropsychopharmacology. 2002;27:960–969. doi: 10.1016/S0893-133X(02)00378-0. [DOI] [PubMed] [Google Scholar]
- 4.Enserink M. Addiction research. Anonymous alcoholic bankrolls trial of controversial therapy. Science. 2011;332:653. doi: 10.1126/science.332.6030.653. [DOI] [PubMed] [Google Scholar]
- 5.Flatscher-Bader T, van der Brug M, Hwang JW, Gochee PA, Matsumoto I, Niwa S, et al. Alcohol-responsive genes in the frontal cortex and nucleus accumbens of human alcoholics. J Neurochem. 2005;93:359–370. doi: 10.1111/j.1471-4159.2004.03021.x. [DOI] [PubMed] [Google Scholar]
- 6.Liu J, Lewohl JM, Harris RA, Iyer VR, Dodd PR, Randall PK, et al. Patterns of gene expression in the frontal cortex discriminate alcoholic from nonalcoholic individuals. Neuropsychopharmacology. 2006;31:1574–1582. doi: 10.1038/sj.npp.1300947. [DOI] [PubMed] [Google Scholar]
- 7.Lee C, Mayfield RD, Harris RA. Intron 4 containing novel GABAB1 isoforms impair GABAB receptor function. PLoS One. 2010;5:e14044. doi: 10.1371/journal.pone.0014044. [DOI] [PMC free article] [PubMed] [Google Scholar]
- 8.Tiao JY, Bradaia A, Biermann B, Kaupmann K, Metz M, Haller C, et al. The sushi domains of secreted GABA(B1) isoforms selectively impair GABA(B) heteroreceptor function. J Biol Chem. 2008;283:31005–31011. doi: 10.1074/jbc.M804464200. [DOI] [PMC free article] [PubMed] [Google Scholar]
- 9.Schwarz DA, Barry G, Eliasof SD, Petroski RE, Conlon PJ, Maki RA. Characterization of gamma-aminobutyric acid receptor GABAB(1e), a GABAB(1) splice variant encoding a truncated receptor. J Biol Chem. 2000;275:32174–32181. doi: 10.1074/jbc.M005333200. [DOI] [PubMed] [Google Scholar]
- 10.Isomoto S, Kaibara M, Sakurai-Yamashita Y, Nagayama Y, Uezono Y, Yano K, et al. Cloning and tissue distribution of novel splice variants of the rat GABAB receptor. Biochem Biophys Res Commun. 1998;253:10–15. doi: 10.1006/bbrc.1998.9706. [DOI] [PubMed] [Google Scholar]
- 11.Glatt SJ, Cohen OS, Faraone SV, Tsuang MT. Dysfunctional gene splicing as a potential contributor to neuropsychiatric disorders. Am J Med Genet B Neuropsychiatr Genet. 2011;156B:382–392. doi: 10.1002/ajmg.b.31181. [DOI] [PMC free article] [PubMed] [Google Scholar]
- 12.Sander T, Ball D, Murray R, Patel J, Samochowiec J, Winterer G, et al. Association analysis of sequence variants of GABA(A) alpha6, beta2, and gamma2 gene cluster and alcohol dependence. Alcohol Clin Exp Res. 1999;23:427–431. [PubMed] [Google Scholar]
- 13.Barrie ES, Smith RM, Sanford JC, Sadee W. mRNA transcript diversity creates new opportunities for pharmacological intervention. Mol Pharmacol. 2012;81:620–630. doi: 10.1124/mol.111.076604. [DOI] [PMC free article] [PubMed] [Google Scholar]
- 14.Hardy PA, Chen W, Wilce PA. Chronic ethanol exposure and withdrawal influence NMDA receptor subunit and splice variant mRNA expression in the rat cerebral cortex. Brain Res. 1999;819:33–39. doi: 10.1016/s0006-8993(98)01340-7. [DOI] [PubMed] [Google Scholar]
- 15.Walter HJ, McMahon T, Dadgar J, Wang D, Messing RO. Ethanol regulates calcium channel subunits by protein kinase C delta -dependent and -independent mechanisms. J Biol Chem. 2000;275:25717–25722. doi: 10.1074/jbc.M910282199. [DOI] [PubMed] [Google Scholar]
- 16.McVey GL, Walker KS, Beyers J, Harrison HL, Simkins SW, Russell-Mayhew S. Integrating weight bias awareness and mental health promotion into obesity prevention delivery: a public health pilot study. Prev Chronic Dis. 2013;10:E46. doi: 10.5888/pcd10.120185. [DOI] [PMC free article] [PubMed] [Google Scholar]
- 17.Ponomarev I, Wang S, Zhang L, Harris RA, Mayfield RD. Gene coexpression networks in human brain identify epigenetic modifications in alcohol dependence. J Neurosci. 2012;32:1884–1897. doi: 10.1523/JNEUROSCI.3136-11.2012. [DOI] [PMC free article] [PubMed] [Google Scholar]
- 18.Zhu YY, Machleder EM, Chenchik A, Li R, Siebert PD. Reverse transcriptase template switching: a SMART approach for full-length cDNA library construction. Biotechniques. 2001;30:892–897. doi: 10.2144/01304pf02. [DOI] [PubMed] [Google Scholar]
- 19.Lee C, Harris RA, Wall JK, Mayfield RD, Wilke CO. RNaseIII and T4 Polynucleotide Kinase sequence biases and solutions during RNA-seq library construction. Biol Direct. 2013;8:16. doi: 10.1186/1745-6150-8-16. [DOI] [PMC free article] [PubMed] [Google Scholar]
- 20.Trapnell C, Pachter L, Salzberg SL. TopHat: discovering splice junctions with RNA-Seq. Bioinformatics. 2009;25:1105–1111. doi: 10.1093/bioinformatics/btp120. [DOI] [PMC free article] [PubMed] [Google Scholar]
- 21.Wang L, Feng Z, Wang X, Zhang X. DEGseq: an R package for identifying differentially expressed genes from RNA-seq data. Bioinformatics. 2010;26:136–138. doi: 10.1093/bioinformatics/btp612. [DOI] [PubMed] [Google Scholar]
- 22.Cloonan N, Forrest AR, Kolle G, Gardiner BB, Faulkner GJ, Brown MK, et al. Stem cell transcriptome profiling via massive-scale mRNA sequencing. Nat Methods. 2008;5:613–619. doi: 10.1038/nmeth.1223. [DOI] [PubMed] [Google Scholar]
- 23.Hansen KD, Brenner SE, Dudoit S. Biases in Illumina transcriptome sequencing caused by random hexamer priming. Nucleic Acids Res. 2010;38:e131. doi: 10.1093/nar/gkq224. [DOI] [PMC free article] [PubMed] [Google Scholar]
- 24.Yoon OK, Brem RB. Noncanonical transcript forms in yeast and their regulation during environmental stress. RNA. 2010;16:1256–1267. doi: 10.1261/rna.2038810. [DOI] [PMC free article] [PubMed] [Google Scholar]
- 25.Li JB, Levanon EY, Yoon JK, Aach J, Xie B, Leproust E, et al. Genome-wide identification of human RNA editing sites by parallel DNA capturing and sequencing. Science. 2009;324:1210– 1213. doi: 10.1126/science.1170995. [DOI] [PubMed] [Google Scholar]
- 26.Wang Z, Gerstein M, Snyder M. RNA-Seq: a revolutionary tool for transcriptomics. Nat Rev Genet. 2009;10:57–63. doi: 10.1038/nrg2484. [DOI] [PMC free article] [PubMed] [Google Scholar]
- 27.Pickrell JK, Pai AA, Gilad Y, Pritchard JK. Noisy splicing drives mRNA isoform diversity in human cells. PLoS Genet. 2010;6:e1001236. doi: 10.1371/journal.pgen.1001236. [DOI] [PMC free article] [PubMed] [Google Scholar]
- 28.Dimon MT, Sorber K, DeRisi JL. HMMSplicer: a tool for efficient and sensitive discovery of known and novel splice junctions in RNA-Seq data. PLoS One. 5:e13875. doi: 10.1371/journal.pone.0013875. [DOI] [PMC free article] [PubMed] [Google Scholar]
- 29.Mortazavi A, Williams BA, McCue K, Schaeffer L, Wold B. Mapping and quantifying mammalian transcriptomes by RNA-Seq. Nat Methods. 2008;5:621–628. doi: 10.1038/nmeth.1226. [DOI] [PubMed] [Google Scholar]
- 30.Sorber K, Dimon MT, DeRisi JL. RNA-Seq analysis of splicing in Plasmodium falciparum uncovers new splice junctions, alternative splicing and splicing of antisense transcripts. Nucleic Acids Res. 2011;39:3820–3835. doi: 10.1093/nar/gkq1223. [DOI] [PMC free article] [PubMed] [Google Scholar]
- 31.Bulanova E, Budagian V, Duitman E, Orinska Z, Krause H, Ruckert R, et al. Soluble Interleukin IL-15Ralpha is generated by alternative splicing or proteolytic cleavage and forms functional complexes with IL-15. J Biol Chem. 2007;282:13167–13179. doi: 10.1074/jbc.M610036200. [DOI] [PubMed] [Google Scholar]
- 32.Ezzat S, Zheng L, Yu S, Asa SL. A soluble dominant negative fibroblast growth factor receptor 4 isoform in human MCF-7 breast cancer cells. Biochem Biophys Res Commun. 2001;287:60–65. doi: 10.1006/bbrc.2001.5546. [DOI] [PubMed] [Google Scholar]
- 33.Mosley B, Beckmann MP, March CJ, Idzerda RL, Gimpel SD, VandenBos T, et al. The murine interleukin-4 receptor: molecular cloning and characterization of secreted and membrane bound forms. Cell. 1989;59:335–348. doi: 10.1016/0092-8674(89)90295-x. [DOI] [PubMed] [Google Scholar]
- 34.Bell TJ, Miyashiro KY, Sul JY, McCullough R, Buckley PT, Jochems J, et al. Cytoplasmic BK(Ca) channel intron-containing mRNAs contribute to the intrinsic excitability of hippocampal neurons. Proc Natl Acad Sci U S A. 2008;105:1901–1906. doi: 10.1073/pnas.0711796105. [DOI] [PMC free article] [PubMed] [Google Scholar]
- 35.Jang DJ, Park SW, Lee JA, Lee C, Chae YS, Park H, et al. N termini of apPDE4 isoforms are responsible for targeting the isoforms to different cellular membranes. Learn Mem. 2010;17:469–479. doi: 10.1101/lm.1899410. [DOI] [PubMed] [Google Scholar]
- 36.Bell TJ, Miyashiro KY, Sul JY, Buckley PT, Lee MT, McCullough R, et al. Intron retention facilitates splice variant diversity in calcium-activated big potassium channel populations. Proc Natl Acad Sci U S A. 2010;107:21152–21157. doi: 10.1073/pnas.1015264107. [DOI] [PMC free article] [PubMed] [Google Scholar]
- 37.Gracheva EO, Cordero-Morales JF, Gonzalez-Carcacia JA, Ingolia NT, Manno C, Aranguren CI, et al. Ganglion-specific splicing of TRPV1 underlies infrared sensation in vampire bats. Nature. 2011;476:88–91. doi: 10.1038/nature10245. [DOI] [PMC free article] [PubMed] [Google Scholar]
- 38.Enoch MA, Zhou Z, Kimura M, Mash DC, Yuan Q, Goldman D. GABAergic gene expression in postmortem hippocampus from alcoholics and cocaine addicts; corresponding findings in alcohol-naive P and NP rats. PLoS One. 2012;7:e29369. doi: 10.1371/journal.pone.0029369. [DOI] [PMC free article] [PubMed] [Google Scholar]
- 39.Couve A, Moss SJ, Pangalos MN. GABAB receptors: a new paradigm in G protein signaling. Mol Cell Neurosci. 2000;16:296–312. doi: 10.1006/mcne.2000.0908. [DOI] [PubMed] [Google Scholar]
- 40.Roberto M, Gilpin NW, O’Dell LE, Cruz MT, Morse AC, Siggins GR, et al. Cellular and behavioral interactions of gabapentin with alcohol dependence. J Neurosci. 2008;28:5762–5771. doi: 10.1523/JNEUROSCI.0575-08.2008. [DOI] [PMC free article] [PubMed] [Google Scholar]
- 41.Piomelli D. Cannabinoid activity curtails cocaine craving. Nat Med. 2001;7:1099–1100. doi: 10.1038/nm1001-1099. [DOI] [PubMed] [Google Scholar]
- 42.O’Brien CP, Gardner EL. Critical assessment of how to study addiction and its treatment: human and non-human animal models. Pharmacol Ther. 2005;108:18–58. doi: 10.1016/j.pharmthera.2005.06.018. [DOI] [PubMed] [Google Scholar]
- 43.Saba LM, Bennett B, Hoffman PL, Barcomb K, Ishii T, Kechris K, et al. A systems genetic analysis of alcohol drinking by mice, rats and men: influence of brain GABAergic transmission. Neuropharmacology. 2011;60:1269–1280. doi: 10.1016/j.neuropharm.2010.12.019. [DOI] [PMC free article] [PubMed] [Google Scholar]
- 44.Garbutt JC, Kampov-Polevoy AB, Gallop R, Kalka-Juhl L, Flannery BA. Efficacy and safety of baclofen for alcohol dependence: a randomized, double-blind, placebo-controlled trial. Alcohol Clin Exp Res. 2010;34:1849–1857. doi: 10.1111/j.1530-0277.2010.01273.x. [DOI] [PMC free article] [PubMed] [Google Scholar]
Associated Data
This section collects any data citations, data availability statements, or supplementary materials included in this article.