Abstract
Detection of DNA mutations in tumor tissue can be a critical companion diagnostic test prior to prescription of a targeted therapy. Each method for detection of these mutations is associated with an analytic sensitivity that is a function of the percentage of tumor cells present in the specimen. Currently, tumor cell percentage is visually estimated resulting in an ordinal and highly variant result for a biologically continuous variable. We proposed that this aspect of DNA mutation testing could be standardized by developing a computer algorithm capable of accurately determining the percentage of malignant nuclei in an image of a hematoxylin and eosin (H&E) stained tissue. Using INform software (Caliper Life Sciences/Perkin Elmer), we developed an algorithm, to calculate the percentage of malignant cells in histologic specimens of colon adenocarcinoma. A criterion standard was established by manually counting malignant and benign nuclei. Three pathologists also estimated the percentage of malignant nuclei in each image. Algorithm #9 had a median deviation from the criterion standard of 5.4% on the training set and 6.2% on the validation set. Compared to pathologist estimation, Algorithm #9 showed a similar ability to determine percentage of malignant nuclei. This method represents a potential future tool to assist in determining the percent of malignant nuclei present in a tissue section. Further validation of this algorithm or an improved algorithm may have value to more accurately assess percentage of malignant cells for companion diagnostic mutation testing.
Keywords: Morphology, Nuclei, Automated analysis, Molecular Diagnostics
Introduction
The development of new targeted therapies in cancer treatment has resulted in a parallel search for predictive biomarkers to select patients most likely to respond to those therapies.1, 2 DNA mutation status and patient genotypes can be indicators of patient treatment response for some targeted therapies.3, 4 For example, for the treatment of patients with advanced colorectal cancer, K-ras mutation status has been shown to predict non-response to Epidermal Growth Factor Receptor (EFGR) inhibitors.1, 5-8 The K-ras protein is a downstream target of EGFR signaling.9 As a downstream protein in the EGFR signaling pathway, a mutated and constitutively active K-ras protein overcomes any inhibition of signaling by EGFR inhibitors.9-11 It has been shown that anti-EGFR monoclonal antibodies that bind to the extracellular domain of EGFR, such as cetuximab and panitumumab, are most effective on the subset of patients whose tumors have a wild-type K-ras genotype.5, 6 By contrast, in lung cancer, EGFR inhibitors have been shown to be valuable only in patients with mutations in EGFR12-14. Therefore, it is recommended that all tumors of patients diagnosed with colorectal cancer or non-small cell lung cancer who are candidates for anti-EGFR therapy undergo molecular testing to establish K-ras and EGFR mutation status respectively7, 9, 15, 16.
Across the globe, quality assessment schemes have recently been designed to identify potential sources of error in molecular testing and suggest guidelines to help standardize mutation detection protocols.2, 3, 17, 18 The measurement of the percentage of tumor cells (malignant cellularity) in the tissue section tested is repeatedly mentioned as a potential source of error in DNA mutation analysis.11, 17-19 Depending on assay sensitivities and limits of detection, insufficient malignant cellularity could result in false-negative test results if a DNA mutation is unable to be detected in a background of wild-type alleles.20There are multiple DNA mutation detection technologies currently in use, and new assays are under development. They have a wide range of analytic sensitivity, some requiring as little as 1% malignant cellularity 21, 22 and others nearly 50%. 4, 15 Sanger sequencing is considered the industry standard for DNA mutation detection and, as surveyed by the College of American Pathologists (CAP) Molecular Oncology committee, is used by the majority of molecular oncology testing labs. However, this assay requires a minimum of 30-50% tumor cells to successfully detect a mutation.2, 10, 15, 19 Other methods in use, such as pyrosequencing or high resolution melt analysis, have higher sensitivities and require lower percentages of malignant DNA to successfully detect a mutation.4, 9, 20 Nonetheless, all methods, by definition, have a limit of analytic sensitivity which represents the minimum percentage of tumor cells in a tissue sample required to correctly identify a mutation.10
Currently, no objective method exists for determining the percentage of tumor cells present in a tissue section.2 Most commonly during molecular testing, a pathologist will review a hematoxylin and eosin (H&E) stained tissue section and estimate the percent of malignant nuclei in that section.17 This method has been shown to be highly subjective and results in a low level of inter-observer reproducibility.2, 17, 18 In contrast, automated image analysis promises objective and reproducible approaches to remove the subjectivity introduced by a human observer.23-25 Here we attempt to develop and test an algorithm that could be used for automated image analysis to standardize our approach to determining percentage of tumor cells and provide an objective method for assessing sample adequacy for mutation testing. By generation of an algorithm on a training set of images, followed by validation on a testing set, we provide a pathway toward a future tool to assist in objective assessment of malignant cellularity for molecular companion diagnostic testing.
Materials and Methods
Collection of Images from TMAs and whole slides
All samples used for algorithm training and validation were acquired from a tissue microarray (TMA) containing a cohort of 600 patients diagnosed with colorectal adenocarcinoma who underwent surgical resection at Yale-New Haven Hospital between 1970-1986. One 0.6mm tissue core from each patient in the cohort was included in the TMA. For this study, a single section of the TMA was stained with hematoxylin and eosin and acquired as a digital slide. An individual image of each histospot in the TMA was captured at 20X magnification using ImageScope software (Aperio). We selected and acquired the field of view that contained the largest area of tissue for each histospot. Images containing high quality tissue without tears or folds and with limited areas of necrosis were selected for algorithm training and validation.
In order to access algorithm accuracy on whole tissue sections in addition to TMA histospots, images from archived H&E slides from the original surgical resection of patients included in the TMA cohort were also acquired. Approximately 20 random whole sections were scanned using the Scanscope digital slide scanner (Aperio). The digital whole sections were then reviewed using ImageScope software (Aperio) and fields of view containing high-quality tissue and a range of tumor cell content were captured for further algorithm evaluation. With these images, we were able to compare algorithm performance on the same patient specimen both as a TMA core and a whole tissue section.
Creation of a Criterion Standard
To create a criterion standard for evaluating algorithm accuracy on the training and validation sets, each image was divided into 9 segments for manual nuclear counting. The nuclei in each segment were marked as malignant or benign with red and green dots, respectively and counted by a technician (HV, MC, KL). Benign nuclei were most often stromal nuclei, lymphocytes, or inflammatory cells. Normal or non-malignant epithelial cells were not represented in the cases selected. The malignant and benign nuclei from all segments were summed to obtain the total nuclei in each image and determine the percentage of malignant nuclei. All images and counting were reviewed by a pathologist (DLR). Areas of necrosis were ignored and were not included in the determination of percent malignant nuclei.
Development of a Computerized Algorithm
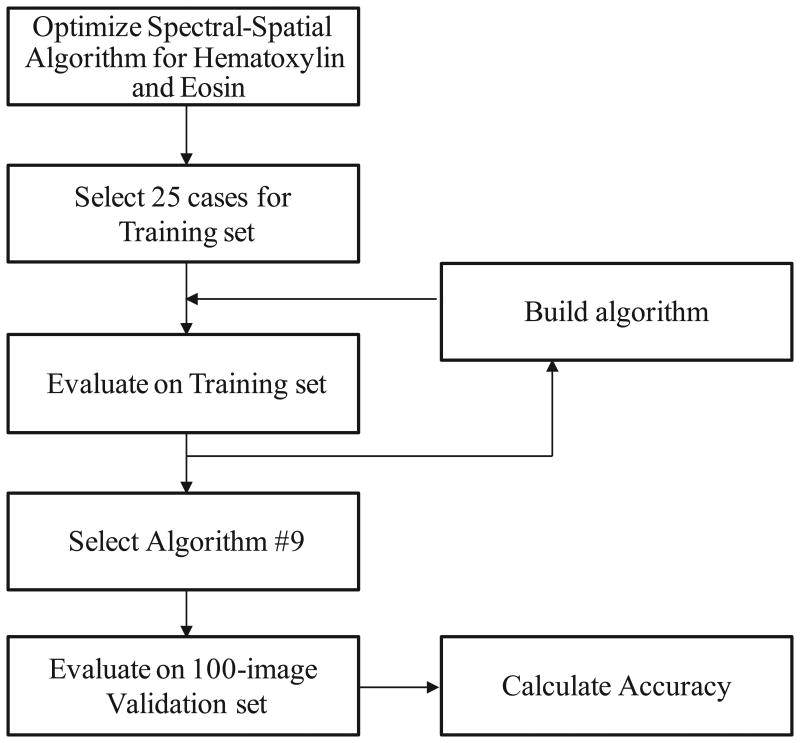
A computer algorithm was created to objectively determine the percentage of malignant nuclei in a field of view of colon tissue sections. A diagram summarizing our approach to algorithm development and validation is shown in Figure 1. Using INform™ software (Perkin Elmer/Caliper Life Sciences), an algorithm was optimized to analyze tissue spectral and spatial data based on H&E staining of selected colon adenocarcinoma cases. Representative, user selected, regions from 25 cases were used to train the algorithm to identify regions of malignant cells, benign cells, necrosis, and blank space. Individual nuclei were identified and counted based on the hematoxylin stain optical density. Nuclei were then classified as malignant or benign based on their location within the algorithm-defined malignant and benign tissue regions. The total number of nuclei in each tissue region was then counted and the percentage of malignant nuclei was calculated. The algorithm's performance on the 25-image training set was evaluated using the manually-counted criterion standard. Multiple iterations of the algorithm were created and tested until the performance on the training set was visually correct on nearly every test case. The algorithm selected for validation was called Algorithm #9. The details of the parameters it uses in definition of malignant and benign nuclei are embedded in the software and not readily accessible to the end user. Although once selected, algorithms may be “locked” for future testing or potential distribution.
Figure 1.
Method for Development of Automated Assessment of Percent Malignant Nuclei.
Statistical Methods
The resulting data was managed using Microsoft Excel software and statistical analysis was accomplished using StatView 5.0 (SAS, Cary, NC) for correlation testing using Pearson's test.
Results
Algorithm #9 Training and Validation Set Performance
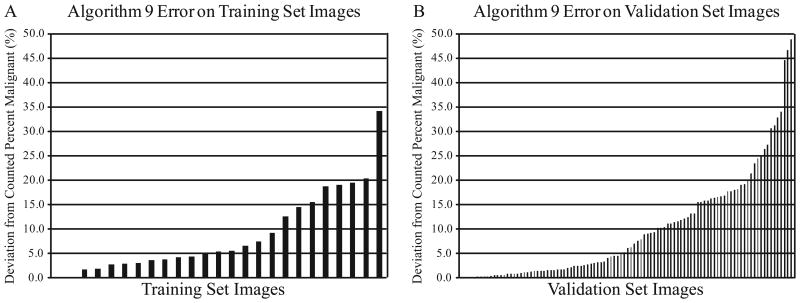
During algorithm development, each algorithm's success was evaluated based on its performance on the set of twenty-five colon adenocarcinoma cases in the training set. Images illustrating objective determination of percent malignant nuclei by manual counting and by algorithm analysis are shown in Figure 2. The percentage of malignant nuclei derived from manual counting was established as the criterion standard against which algorithm analysis was compared. Algorithm error was evaluated as the deviation of the algorithm-determined percentage of malignant nuclei from the observer-counted percentage. The frequency and distribution of Algorithm #9 error on the training set is shown in Figure 3A. Algorithm #9 had a median deviation from the manually counted percent malignant nuclei of 5.4%. The algorithm differed from the criterion standard by less than 5.0% on 11 (44.0%) of the 25 training images and by less than 10.0% on 17 (68.0%) of the training images.
Figure 2.
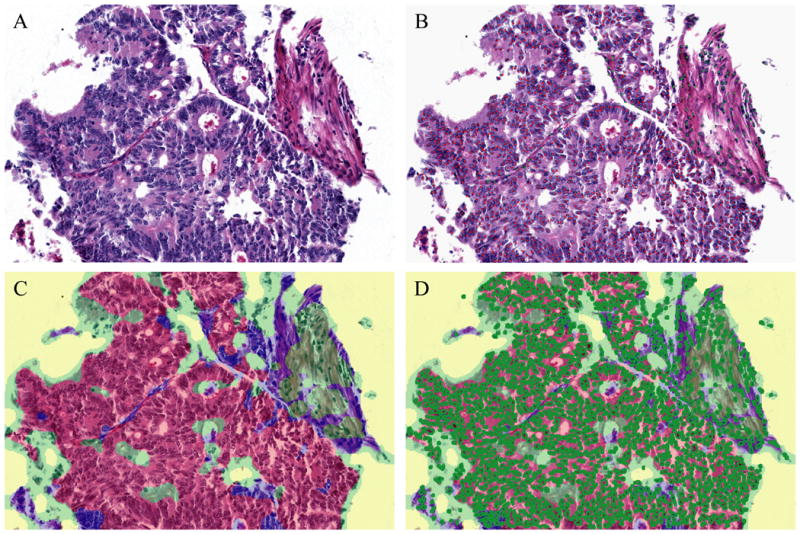
Representative Images of Objective Determination of Percent Malignant Nuclei. H&E of a colon adenocarcinoma case (A). Nuclei marked with red and green dots to obtain a criterion standard by manual counting (B). Algorithm #9 tissue segmentation map identified regions of tissue as malignant (red), benign (green), or necrotic (blue) (C). Algorithm #9 object count image marked individual nuclei in bright green circles (D).
Figure 3.
Algorithm #9 Error Frequency. Algorithm #9 error was evaluated as the absolute value of the deviation of the algorithm-determined percentage of malignant nuclei from the manually-counted percentage. Algorithm #9 error on each image is shown for the training set (A) and for the validation set (B).
As the optimal algorithm, Algorithm #9 was selected for validation on an independent set of 100 colon adenocarcinoma cases from a tissue microarray (TMA) selected by a pathologist (KM) representing a range of tissue morphologies and tumor cell content. In addition, three pathologists (AM, KM, KS) independently estimated the percentage of malignant nuclei in each validation set image. Pathologist estimates were compared to each other and to the criterion standard. Algorithm accuracy was also evaluated in relation to the established criterion standard and in relation to pathologist estimates. The results are shown in Figure 3B. Algorithm #9 performance on the validation set was comparable to its performance on the training set. In the validation set, the algorithm deviated from the criterion standard by a median of 6.2%. About half, (47.0%) of the validation images deviated by less than 5.0% and 58 (58.0%) deviated by less than 10.0%. In contrast, 14 cases represented as TMA spots and analyzed by Algorithm #9 had error greater than 20.0%. On three validation set cases, Algorithm #9 error was exceptionally high, and the algorithm miscalculated the percentage of tumor cells by greater than 40.0%. Most often, we observed that Algorithm #9 error was due to misclassification of nuclei, calling benign nuclei malignant or vice versa. Algorithm #9 inaccuracies in the definition and counting individual nuclei played a less significant role in overall algorithm performance.
The ability of Algorithm #9 to count individual nuclei was also evaluated by plotting the algorithm-counted nuclei versus the observer-counted nuclei for both malignant and benign nuclei in the validation set (Figure 4A, 4B). The values determined by Algorithm #9 for percentage of malignant nuclei were also plotted versus the manually-counted percent malignant (Figure 4C). At times, Algorithm #9 tended to count immediately adjacent nuclei as a single nucleus due to the lack of hematoxylin-negative space between the nuclei. Islands of contiguous hematoxylin-positive staining containing multiple nuclei were sometimes counted only once. While Algorithm #9 was less able to determine the actual number of nuclei in a tissue section image, it was more able to determine the overall percentage of malignant nuclei in each image. This attribute is consistent with the goal of the software where the accuracy in determination of the malignant cellularity (or the percentage of malignant nuclei) is more important than the actual number of either benign or malignant nuclei. Furthermore, the largest outliers in the scatter plot showing percentages of malignant nuclei most often fall below the line of regression, suggesting that Algorithm #9 tends to underestimate the percent of malignant nuclei. Therefore, Algorithm #9 is less likely to fail to identify tissue with insufficient amounts of tumor cell content for molecular testing.
Figure 4.
Algorithm #9 Nuclear Counting. The total nuclei identified by Algorithm #9 were plotted versus the observer-counted values for malignant nuclei (A), benign nuclei (B), and percentage of malignant nuclei (C) for the validation set images. All regression intercepts were set to zero. The line of regression equation and R-squared value are shown for each panel.
Pathologist Estimation Accuracy and Inter-Observer Agreement
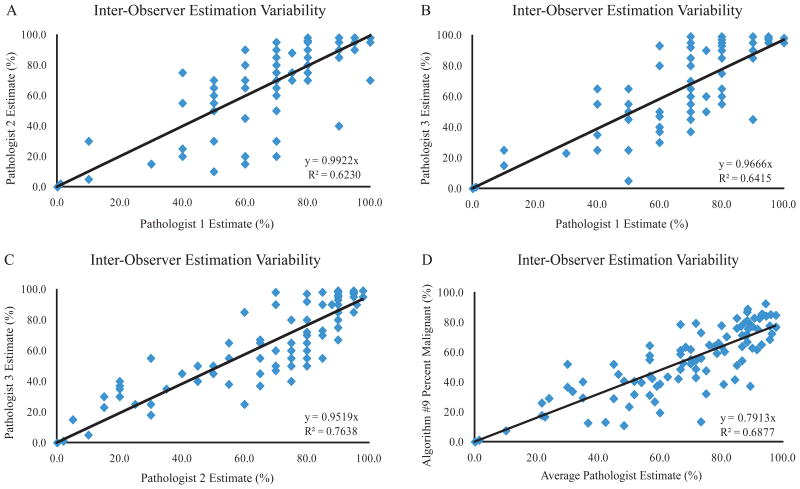
In addition to the manually-counted percentages, three pathologists also individually estimated the percent of malignant nuclei for each image in the validation set. Each pathologist's responses were plotted versus to other two pathologists to examine inter-observer estimation variability (Figure 5A-C). The average pathologist estimate of percent malignant nuclei was also plotted versus the Algorithm #9-determined percentage (Figure 4D). These results indicate a considerable discrepancy between individual pathologists' estimation of percentage of malignant cells consistent with previous observations. Also, the pathologist-to-pathologist variability is roughly equal to the variation seen between the average pathologist estimate and Algorithm #9.
Figure 5.
Pathologist Estimated Percentage Agreement. Three individual pathologists' estimates of percent malignant nuclei were plotted versus each other (A-C). The average pathologist estimate was plotted versus Algorithm #9-determined percent malignant (D). All regression intercepts were set to zero. The line of regression equation and R-squared value are shown for each panel.
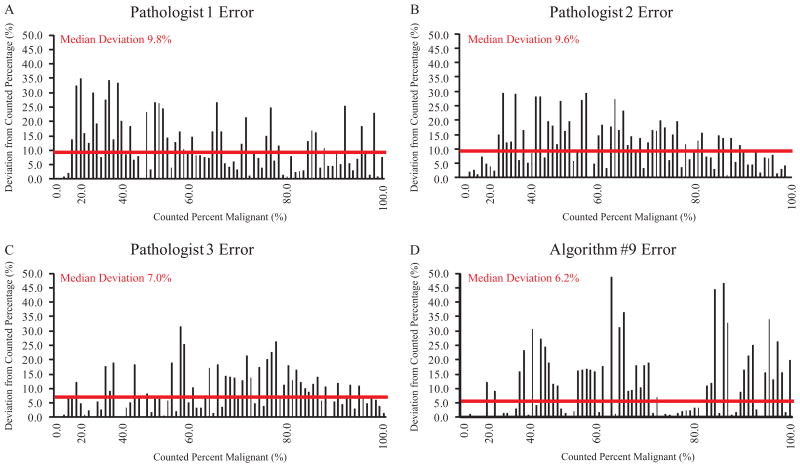
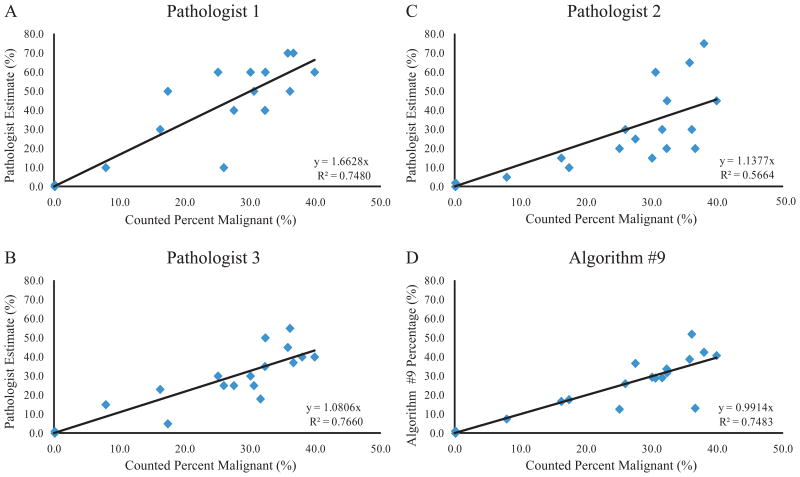
To further characterize the accuracy of pathologists and Algorithm #9 in identifying percent malignant nuclei, pathologist and algorithm error for each image in the validation set was graphed in order of increasing tumor cell percentage (Figure 6). The median deviation of a pathologist's estimate from the manually-counted percentage ranged from 7.0% to 9.8%. Algorithm #9 deviated from the counted percentage by a median of 6.2%, less than each pathologist. There was no evidence of a specific source for error as a function of malignant cellularity as error was spread across the scale for all pathologists and Algorithm #9. While Algorithm #9 error was less than 5.0% for 47 cases, pathologists estimated within 5.0% of the counted value less frequently. The best pathologist had less than 5.0% error in 37 cases while the least accurate has only 22 cases with less than 5.0% error. In contrast, pathologist estimation error showed less extreme variation and was more consistent across all of the validation set cases.
Figure 6.
Comparison of Pathologist and Algorithm #9 Error. Errors in determining percentage of malignant nuclei were plotted for each case in order of increasing tumor cell percentage. Results are shown for Pathologist 1 (A), Pathologist 2 (B), Pathologist 3 (C), and Algorithm #9 (D). Median deviation for each observer/technique is shown with a horizontal line.
Samples containing low levels of malignant cells are most at risk for false-negative molecular testing results. Over estimation errors in identifying the percentage of malignant nuclei in a tissue section have the greatest effect on patient samples containing low tumor cell content. For that reason, the accuracy of each pathologist and Algorithm #9 was assessed in the critical low range for mutation testing. Nineteen cases from the validation set contained less than 40.0% malignant nuclei and were used to analyze accuracy on low tumor cell content. Pathologist estimates and algorithm-derived percentages were plotted versus the criterion standard for all cases containing less than 40.0% tumor cells (Figure 7). Linear regression indicated that Algorithm #9 accuracy in the critical low range was comparable to pathologist estimation accuracy. In addition, the slope of best fit was closest to 1.0 for the plot correlating Algorithm #9 results to the manually-counted percentages. In contrast, all pathologist estimation slopes were greater than 1.0 suggesting that pathologists tend to over-estimate percentage of malignant cells in comparison to Algorithm #9 in the critical low range.
Figure 7.
Algorithm #9 and Pathologist Accuracy in the Critical Low Range for Mutation Testing. Pathologist estimates and Algorithm #9 values were plotted versus the criterion standard for images containing less than 40.0% malignant nuclei. Results are shown for Pathologist 1 (A), Pathologist 2 (B), Pathologist 3 (C), and Algorithm #9 (D). All regression intercepts were set to zero. Line of regression equation and R-squared value are shown for each panel.
Algorithm #9 Analysis with Whole Tissue Sections
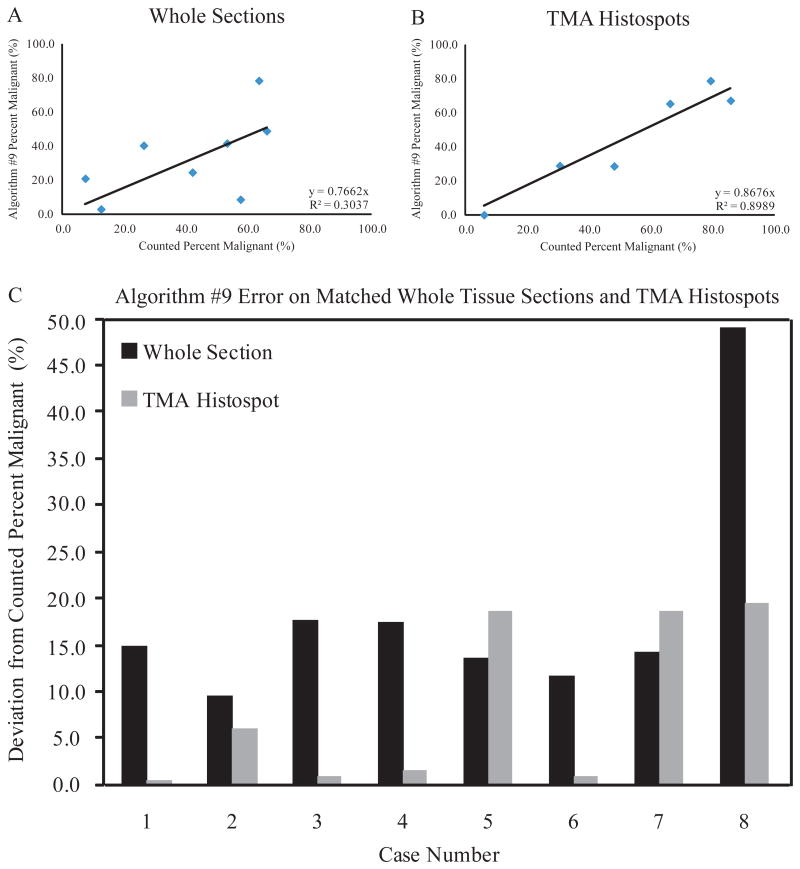
Algorithm #9 was trained and validated using tissue histospots contained in the same section of a TMA that were, therefore, stained simultaneously. To further evaluate Algorithm #9, the algorithm analyzed a series of separately-stained whole tissue sections. Algorithm #9 was run on eight whole tissue sections corresponding to eight cases also represented as histospots in the TMA used to build the algorithm. Any differences in Algorithm #9 performance should be the result of H&E staining variation. The Algorithm #9-determined percentages were plotted versus the observer-counted percentages separately for the eight whole sections and the matched TMA histospots (Figure 8A, 8B). These results showed a significant decrease in Algorithm #9's ability to determine percentage of malignant nuclei on the whole tissue sections since the correlation between Algorithm #9 and manual counting on whose tissue sections was significantly decreased from the correlation involving TMA histospots. Algorithm #9 errors were also shown in matched pairs of whole tissue sections and TMA histospots (Figure 8C). In 6 out of 8 cases, the Algorithm #9 deviation from the counted percentage was less on the TMA histospot than on the matched whole tissue section. In the two cases where Algorithm #9 performed better on the whole tissue sections, the TMA histospots were considered to be of poor quality due to loss of large tissue areas and extensive necrosis.
Figure 8.
Algorithm #9 Performance on Whole Tissue Sections. Algorithm #9-determined percentages of malignant nuclei were plotted versus the criterion standard for whole tissue sections (A) and corresponding TMA histospots (B). All regression intercepts were set to zero. Line of regression equation and R-squared value are shown for each panel. Algorithm #9 error is shown for matched pairs of whole tissue sections and TMA histospots (C).
Discussion
Although far from perfect, Algorithm #9 represents an objective and reproducible method to determine percentage of malignant nuclei. Our data suggests that it is comparable to a pathologist in its ability to determine percentage of malignant nuclei in a tissue section. While the median error of Algorithm #9 is comparable to that of a pathologist, approximately half of the cases analyzed by Algorithm #9 had very low error (<5.0%). After review of the tissue segmentation and object count images created by Algorithm #9, we were able to visually discern in which cases Algorithm #9 was most successful in determination of malignant cellularity and cases in which the algorithm was not successful. In fact, when Algorithm #9 failed, it failed with flourish. Like Watson on Jeopardy, while more accurate than his human counterparts most of the time, the failures, when they occurred, were extreme. Given that pattern, one potential application of Algorithm #9 could be determination of malignant cellularity in combination with an ancillary review system that includes a human operator visually evaluating the performance. In the event that review of the tissue segmentation map areas of red and green did not match the areas of tumor and stroma identified by a human observer, then the lab could use a pathologist's estimate of percent malignant nuclei in place of the algorithm-determined value.
This algorithm was created using tissue spectral-spatial data and feature extraction technology to establish computerized definitions relating to malignant and benign nuclei. It is important to note that for the purposes of this application, a “benign” nucleus most often represented a stromal nucleus, lymphocyte, or inflammatory cell. These cell types generally have distinct microscopic appearances to any nearby malignant epithelial cells. While Algorithm #9 is successful in identifying malignant cells, it has not been trained to identify a malignant growth from other forms of benign neoplasia. Although we have not tested Algorithm #9's ability to determine percent malignant nuclei in a case containing adjacent non-malignant epithelial cells, we suspect it would not perform well on those cases due to their closer similarity in appearance to a colorectal cancer cell.
Furthermore, success with the use of Algorithm #9 appears to be limited to colon tissue. In an exploratory experiment, Algorithm #9 was run on a separate subset of cases containing 18 tumor tissue types including breast, kidney, liver, lung, ovarian, melanoma, pancreatic, prostate, and thyroid. While no criterion standard was established for these images, visual assessment of algorithm performance showed a severely decreased ability of Algorithm #9 to identify malignant cells from other tumor types and to count individual nuclei. In most cases, Algorithm #9 failed to identify any nuclei as malignant in the non-colorectal carcinoma examples. This observation suggests that Algorithm #9 is tissue-specific and is only capable of recognizing malignant colon adenocarcinoma nuclei and other algorithms would need to be developed for other malignancies. In a manner similar to that described here, it would be possible to create new algorithms trained exclusively on other tissue types that perform the same function as Algorithm #9. In the future, separate algorithms to determine percentage of malignant nuclei could exist for every tissue type used in mutation testing.
Perhaps the most striking and concerning limitation of Algorithm #9 was its dependency on the H&E stain used to train the algorithm. It has been previously shown that variations in H&E staining affect accuracy of computer-based image analysis.23 Beck et al. reported that their algorithm developed to assess histologic grade in invasive breast carcinoma initially was only successful when analyzing cases from their own institution. It was not until the algorithm was re-trained using cases from a separate institution that the algorithm was able to successfully assess histologic grade on cases from that other institution.23 It appears Algorithm #9 is also limited by the non-reproducibility of H&E staining used to train the algorithm. While Algorithm #9 continues to perform well on cases stained simultaneously with the training set images, accuracy is lost when the algorithm is applied to cases stained using different reagents at different points in time.
The development and validation of Algorithm #9 represents an exploratory example to establish a reproducible, objective method to determine percentage of malignant nuclei for mutation testing. As produced and described here, it is not ready for introduction into the clinical work flow. However, in the future, additional algorithms may be created and validated which, after appropriate multi-institutional validation, could become a tool in molecular testing laboratories. Most likely, future algorithms will need to be trained using multiple slides and cases from multiple institutions in order to create an algorithm robust enough to successfully analyze cases stained at different points in time at separate institutions. As mutation testing continues to become a routine part of patient treatment decisions regarding targeted therapies, algorithms like Algorithm #9 may represent a critical part of the process of standardization of molecular testing protocols for accurate genomic testing.
Acknowledgments
Funding for this work included a contract from Perkin Elmer and NIH RO-1 CA 114277.
Abbreviations
- CAP
College of American Pathologists
- EGFR
epidermal growth factor receptor
- H&E
hematoxylin and eosin
- TMA
tissue microarray
References
- 1.Normanno N, Tejpar S, Morgillo F, De Luca A, Van Cutsem E, Ciardiello F. Implications for KRAS status and EGFR-targeted therapies in metastatic CRC. Nat Rev Clin Oncol. 2009;6:519–527. doi: 10.1038/nrclinonc.2009.111. [DOI] [PubMed] [Google Scholar]
- 2.Thunnissen E, Bovée JVMG, Bruinsma H, van den Brule AJC, Dinjens W, Heideman DAM, Meulemans E, Nederlof P, van Noesel C, Prinsen CFM, Scheidel K, van de Ven PM, de Weger R, Schuuring E, Ligtenberg M. EGFR and KRAS quality assurance schemes in pathology: generating normative data for molecular predictive marker analysis in targeted therapy. Journal of Clinical Pathology. 2011;64:884–892. doi: 10.1136/jclinpath-2011-200163. [DOI] [PubMed] [Google Scholar]
- 3.Deans ZC, Tull J, Beighton G, Abbs S, Robinson DO, Butler R. Molecular Genetics External Quality Assessment Pilot Scheme for KRAS Analysis in Metastatic Colorectal Cancer. Genetic Testing and Molecular Biomarkers. 2011;15:777–783. doi: 10.1089/gtmb.2010.0239. [DOI] [PubMed] [Google Scholar]
- 4.Weichert W, Schewe C, Lehmann A, Sers C, Denkert C, Budczies J, Stenzinger A, Joos H, Landt O, Heiser V, Röcken C, Dietel M. KRAS Genotyping of Paraffin-Embedded Colorectal Cancer Tissue in Routine Diagnostics: Comparison of Methods and Impact of Histology. The Journal of Molecular Diagnostics. 2010;12:35–42. doi: 10.2353/jmoldx.2010.090079. [DOI] [PMC free article] [PubMed] [Google Scholar]
- 5.Amado RG, Wolf M, Peeters M, Van Cutsem E, Siena S, Freeman DJ, Juan T, Sikorski R, Suggs S, Radinsky R, Patterson SD, Chang DD. Wild-Type KRAS Is Required for Panitumumab Efficacy in Patients With Metastatic Colorectal Cancer. Journal of Clinical Oncology. 2008;26:1626–1634. doi: 10.1200/JCO.2007.14.7116. [DOI] [PubMed] [Google Scholar]
- 6.Karapetis CS, Khambata-Ford S, Jonker DJ, O'Callaghan CJ, Tu D, Tebbutt NC, Simes RJ, Chalchal H, Shapiro JD, Robitaille S, Price TJ, Shepherd L, Au HJ, Langer C, Moore MJ, Zalcberg JR. K-ras Mutations and Benefit from Cetuximab in Advanced Colorectal Cancer. New England Journal of Medicine. 2008;359:1757–1765. doi: 10.1056/NEJMoa0804385. [DOI] [PubMed] [Google Scholar]
- 7.Allegra CJ, Jessup JM, Somerfield MR, Hamilton SR, Hammond EH, Hayes DF, McAllister PK, Morton RF, Schilsky RL. American Society of Clinical Oncology Provisional Clinical Opinion: Testing for KRAS Gene Mutations in Patients With Metastatic Colorectal Carcinoma to Predict Response to Anti–Epidermal Growth Factor Receptor Monoclonal Antibody Therapy. Journal of Clinical Oncology. 2009;27:2091–2096. doi: 10.1200/JCO.2009.21.9170. [DOI] [PubMed] [Google Scholar]
- 8.Van Cutsem E, Köhne CH, Láng I, Folprecht G, Nowacki MP, Cascinu S, Shchepotin I, Maurel J, Cunningham D, Tejpar S, Schlichting M, Zubel A, Celik I, Rougier P, Ciardiello F. Cetuximab Plus Irinotecan, Fluorouracil, and Leucovorin As First-Line Treatment for Metastatic Colorectal Cancer: Updated Analysis of Overall Survival According to Tumor KRAS and BRAF Mutation Status. Journal of Clinical Oncology. 2011;29:2011–2019. doi: 10.1200/JCO.2010.33.5091. [DOI] [PubMed] [Google Scholar]
- 9.Kamel-Reid S, Zhang T, Persons DL, Nikiforova MN, Halling KC. Validation of KRAS Testing for Anti-EGFR Therapeutic Decisions for Patients With Metastatic Colorectal Carcinoma. Archives of Pathology & Laboratory Medicine. 2011;136:26–32. doi: 10.5858/arpa.2011-0220-OA. [DOI] [PubMed] [Google Scholar]
- 10.Hancer VS, Buyukdogan M, Turkmen I, Bassullu N, Altug T, Diz-Kucukkaya R, Bulbul-Dogusoy G, Demir G. Comparison of KRAS Mutation Tests in Colorectal Cancer Patients. Genetic Testing and Molecular Biomarkers. 2011;15:831–834. doi: 10.1089/gtmb.2011.0027. [DOI] [PubMed] [Google Scholar]
- 11.Lamy A, Blanchard F, Le Pessot F, Sesboue R, Di Fiore F, Bossut J, Fiant E, Frebourg T, Sabourin JC. Metastatic colorectal cancer KRAS genotyping in routine practice: results and pitfalls. Mod Pathol. 2011;24:1090–1100. doi: 10.1038/modpathol.2011.60. [DOI] [PubMed] [Google Scholar]
- 12.Lynch TJ, Bell DW, Sordella R, Gurubhagavatula S, Okimoto RA, Brannigan BW, Harris PL, Haserlat SM, Supko JG, Haluska FG, Louis DN, Christiani DC, Settleman J, Haber DA. Activating Mutations in the Epidermal Growth Factor Receptor Underlying Responsiveness of Non–Small-Cell Lung Cancer to Gefitinib. New England Journal of Medicine. 2004;350:2129–2139. doi: 10.1056/NEJMoa040938. [DOI] [PubMed] [Google Scholar]
- 13.Warth A, Penzel R, Brandt R, Sers C, Fischer J, Thomas M, Herth F, Dietel M, Schirmacher P, Bläker H. Optimized algorithm for Sanger sequencing-based EGFR mutation analyses in NSCLC biopsies. Virchows Archiv. 2012;460:407–414. doi: 10.1007/s00428-012-1219-x. [DOI] [PubMed] [Google Scholar]
- 14.Rosell R, Moran T, Queralt C, Porta R, Cardenal F, Camps C, Majem M, Lopez-Vivanco G, Isla D, Provencio M, Insa A, Massuti B, Gonzalez-Larriba JL, Paz-Ares L, Bover I, Garcia-Campelo R, Moreno MA, Catot S, Rolfo C, Reguart N, Palmero R, Sánchez JM, Bastus R, Mayo C, Bertran-Alamillo J, Molina MA, Sanchez JJ, Taron M. Screening for Epidermal Growth Factor Receptor Mutations in Lung Cancer. New England Journal of Medicine. 2009;361:958–967. doi: 10.1056/NEJMoa0904554. [DOI] [PubMed] [Google Scholar]
- 15.Carotenuto P, Roma C, Cozzolino S, Fenizia F, Rachiglio AM, Tatangelo F, Iannaccone A, Baron L, Botti G, Normanno N. Detection of KRAS mutations in colorectal cancer with Fast COLD-PCR. International Journal of Oncology. 2011;40:378–384. doi: 10.3892/ijo.2011.1221. [DOI] [PubMed] [Google Scholar]
- 16.Keedy VL, Temin S, Somerfield MR, Beasley MB, Johnson DH, McShane LM, Milton DT, Strawn JR, Wakelee HA, Giaccone G. American Society of Clinical Oncology Provisional Clinical Opinion: Epidermal Growth Factor Receptor (EGFR) Mutation Testing for Patients With Advanced Non–Small-Cell Lung Cancer Considering First-Line EGFR Tyrosine Kinase Inhibitor Therapy. Journal of Clinical Oncology. 2011;29:2121–2127. doi: 10.1200/JCO.2010.31.8923. [DOI] [PubMed] [Google Scholar]
- 17.Bellon E, Ligtenberg MJL, Tejpar S, Cox K, de Hertogh G, de Stricker K, Edsjö A, Gorgoulis V, Höfler G, Jung A, Kotsinas A, Laurent-Puig P, López-Ríos F, Hansen TP, Rouleau E, Vandenberghe P, van Krieken JJM, Dequeker E. External Quality Assessment for KRAS Testing Is Needed: Setup of a European Program and Report of the First Joined Regional Quality Assessment Rounds. The Oncologist. 2011;16:467–478. doi: 10.1634/theoncologist.2010-0429. [DOI] [PMC free article] [PubMed] [Google Scholar]
- 18.Dequeker E, Ligtenberg M, Vander Borght S, van Krieken J. Mutation analysis of KRAS prior to targeted therapy in colorectal cancer: development and evaluation of quality by a European external quality assessment scheme. Virchows Archiv. 2011;459:155–160. doi: 10.1007/s00428-011-1094-x. [DOI] [PubMed] [Google Scholar]
- 19.Tsiatis AC, Norris-Kirby A, Rich RG, Hafez MJ, Gocke CD, Eshleman JR, Murphy KM. Comparison of Sanger Sequencing, Pyrosequencing, and Melting Curve Analysis for the Detection of KRAS Mutations: Diagnostic and Clinical Implications. The Journal of Molecular Diagnostics. 2010;12:425–432. doi: 10.2353/jmoldx.2010.090188. [DOI] [PMC free article] [PubMed] [Google Scholar]
- 20.Bihl MP, Hoeller S, Andreozzi MC, Foerster A, Rufle A, Tornillo L, Terracciano L. KRAS Mutation Testing in Colorectal Cancer: Comparison of the Results Obtained Using 3 Different Methods for the Analysis of Codons G12 and G13. Diagnostic Molecular Pathology. 2012;21:14–23. doi: 10.1097/PDM.0b013e31822b831a. [DOI] [PubMed] [Google Scholar]
- 21.van Krieken J, Jung A, Kirchner T, Carneiro F, Seruca R, Bosman F, Quirke P, Fléjou J, Plato Hansen T, de Hertogh G, Jares P, Langner C, Hoefler G, Ligtenberg M, Tiniakos D, Tejpar S, Bevilacqua G, Ensari A. KRAS mutation testing for predicting response to anti-EGFR therapy for colorectal carcinoma: proposal for an European quality assurance program. Virchows Archiv. 2008;453:417–431. doi: 10.1007/s00428-008-0665-y. [DOI] [PubMed] [Google Scholar]
- 22.Kotoula V, Charalambous E, Biesmans B, Malousi A, Vrettou E, Fountzilas G, Karkavelas G. Targeted KRAS Mutation Assessment on Patient Tumor Histologic Material in Real Time Diagnostics. PLoS ONE. 2009;4:e7746. doi: 10.1371/journal.pone.0007746. [DOI] [PMC free article] [PubMed] [Google Scholar]
- 23.Beck AH, Sangoi AR, Leung S, Marinelli RJ, Nielsen TO, van de Vijver MJ, West RB, van de Rijn M, Koller D. Systematic Analysis of Breast Cancer Morphology Uncovers Stromal Features Associated with Survival. Science Translational Medicine. 2011;3:108ra113. doi: 10.1126/scitranslmed.3002564. [DOI] [PubMed] [Google Scholar]
- 24.Fasanella S, Leonardi E, Cantaloni C, Eccher C, Bazzanella I, Aldovini D, Bragantini E, Morelli L, Cuorvo L, Ferro A, Gasperetti F, Berlanda G, Dalla Palma P, Barbareschi M. Proliferative activity in human breast cancer: Ki-67 automated evaluation and the influence of different Ki-67 equivalent antibodies. Diagnostic Pathology. 2011;6:S7. doi: 10.1186/1746-1596-6-S1-S7. [DOI] [PMC free article] [PubMed] [Google Scholar]
- 25.Konsti J, Lundin M, Joensuu H, Lehtimaki T, Sihto H, Holli K, Turpeenniemi-Hujanen T, Kataja V, Sailas L, Isola J, Lundin J. Development and evaluation of a virtual microscopy application for automated assessment of Ki-67 expression in breast cancer. BMC Clinical Pathology. 2011;11:3. doi: 10.1186/1472-6890-11-3. [DOI] [PMC free article] [PubMed] [Google Scholar]


