

Abstract
Deep sequencing has become a popular tool for novel miRNA detection but its data must be viewed carefully as the state of the field is still undeveloped. Using three different programs, miRDeep (v1, 2), miRanalyzer and DSAP, we have analyzed seven data sets (six biological and one simulated) to provide a critical evaluation of the programs performance. We selected these software based on their popularity and overall approach toward the detection of novel and known miRNAs using deep-sequencing data. The program comparisons suggest that, despite differing stringency levels they all identify a similar set of known and novel predictions. Comparisons between the first and second version of miRDeep suggest that the stringency level of each of these programs may, in fact, be a result of the algorithm used to map the reads to the target. Different stringency levels are likely to affect the number of possible novel candidates for functional verification, causing undue strain on resources and time. With that in mind, we propose that an intersection across multiple programs be taken, especially if considering novel candidates that will be targeted for additional analysis. Using this approach, we identify and performed initial validation of 12 novel predictions in our in-house data with real-time PCR, six of which have been previously unreported.
Keywords: deep sequencing, software, miRNA detection, comparison
INTRODUCTION
Without question, the discovery of miRNA has reshaped our appreciation of gene regulation. This class of non-coding RNA (ncRNA) is no longer viewed as ‘junk’, but rather as vital and active participants in human disease and physiology [1–5]. Previous approaches to identify novel miRNAs through computational prediction and experimental analysis have focused largely on the classic biogenesis pathway where the precursor and the mature sequences play the largest role [6–12]. These methods vary in terms of throughput, the amount of resources needed and the false-positive rate. Computational approaches, in particular, are characterized by a high false-positive rate, largely due to a heavy reliance on machine learning techniques [1, 13–16]. Deep sequencing presents a viable alternative to previous attempts, but it can be problematic in terms of data generation and specialized skills required to adequately analyze and interpret data. Researchers interested in using deep-sequencing techniques for miRNA discovery are often confronted with a collection of bioinformatic algorithms and approaches with very little information on software comparability and performance. Here, we review three programs, which use three different approaches for miRNA detection in deep-sequencing data. We use experimental and simulated data to highlight some of their features and characteristics. The programs profiled, in this article, were chosen on the basis of their popularity as evidenced by number of citations and uniqueness of approach. In addition, we also compare two versions of miRDeep software which is the most popular program for miRNA discovery in use today and in fact, two other detection programs (miRTools and miReNA) have also incorporated miRDeep as a component of their process [33]. A list of additional available software can be found in Table 1. The cell lines used in this study were randomly chosen and represent cells that might otherwise be regularly employed in any lab studying miRNA expression and disease. All data sets were generated by the same platform (Illumina), following the same sequencing format. The only difference between the data sets profiled in this article is their cell type and lab of origin. These data sets were used as an illustration of how the programs might perform given differing experimental conditions and cell types. The output of each of these programs was compared to determine consistency across algorithms, whereas inclusion of the simulated data set was used to assess each program’s overall specificity and sensitivity.
Table 1:
Other programs that may be used to predict miRNAs from deep-sequencing data
| Software | Format | File format | Location |
|---|---|---|---|
| Seqbuster | Web based, executable | fasta, tab-delimited | http://davinci.crg.es/estivill_lab/seqbuster/ |
| miRExpress | Executable | sequence tag count | http://mirexpress.mbc.nctu.edu.tw/ |
| miRNAKey | Executable | fasta, fastq | http://ibis.tau.ac.il/miRNAkey/ |
| MirTools | Web based | sequence tag count | http://59.79.168.90/mirtools |
| miReNA | Executable | fasta | http://www.ihes.fr/~carbone/data8 |
| miRTrap | Executable | fasta | http://davinci.crg.es |
METHODS
Different types of RNAseq software
The basic steps behind the analysis of any deep-sequencing data with regard to miRNA prediction can be summarized in three stages: (i) initial mapping of the read; (ii) expansion of the mapped locus to include flanking sequences; and (iii) evaluation of the expanded sequence on the basis of negative free energy and structure. Each stage in the process ultimately affects the final result, with perhaps the first being the most crucial of all. The programs available today vary in terms on the amount of user control over parameters and input and how they address each of these three stages [17, 20–24] (Table 2).
Table 2:
Basic features of popular software used to predict miRNA from deep-sequencing data
| Accessible | Read pre-processing | Target genomes | Mapping algorithm | Functions | Predictions based on | Location | Program |
|---|---|---|---|---|---|---|---|
| Executable requires in-house computational resources. | Provides script that eliminates redundancy. Tag removal/processing must be done by user prior to analysis. | Flexible, Human (GRCh37). | Flexible, Oligomap (v1) Bowtie (v2). | Novel, known miRNA prediction. Status of predictions (novel/known) must be determined by the user. | Bayesian probability, focus on traditional steps of biogenesis. | http://www.mdc- berlin.de/en/ research/research_ teams/ | MiRDeep/miRDeep2 |
| Web based | Accepts two multifasta format and file with read and counts. Tag must be removed by user. | Seven genomes (human, fruit fly, rat, mouse, dog, nematode, and zebra fish), fixed choice over version. | Fixed, BowTie. User can set the number of acceptable mismatches (<2). | Novel, Known miRNA prediction. | Posterior probability (threshold > 0.95). Reads are mapped against target genome, mirBase, and other non-coding databases. | http://web.bioinformatics.cicbiogune .es/microRNA/ miRanalyser.php | MirAnalyzer |
| Web-based | Accepts read/counts format like miRAnalyzer. Adapter sequences can be left intact | Multiple genomes, fixed choice over version | Fixed, cluster approach, Uses SuperMatcher to increase speed | Known miRNA prediction, species distribution, expression level | Degree to which reads match known examples. Known miRNAs are compared to miRBase | http://dsap.cgu.edu .tw/ | DSAP |
miRDeep (v1, v2) is a program that predicts the presence of miRNA from deep-sequencing data using Bayesian probabilities framed on the classic steps of miRNA biogenesis [17–19]. The pipeline first compares the reads to a target genome, and then evaluates the read’s suitability on a thermodynamic scale. The algorithm assumes that if a read is related to miRNA, then it must either be a portion of a star, a loop sequence or a mature sequence. The read must demonstrate characteristics similar to already annotated examples, e.g. definite evidence of a present 2 nt 3′ overhang. Also, miRDeep makes the assumption that because mature sequences tend to be more abundant in the cell than any other miRNA-related sequence, reads which conform structurally to ‘mature sequences’ will likewise be the most abundant in the data file. If a read meets structural criteria for being considered a mature sequence, and is found to be frequently represented in the data file it receives a higher score than those that are less frequently found. miRDeep employs a flexible format, accommodating data generated by a 454 Life Sciences/Roche or an Illumina/Solexa sequencer [17]. Version 1 of miRDeep allows the user to control the mapping algorithm and the program choice for evaluation of free energy. Version 2 of miRDeep incorporates Bowtie and Randfold for these tasks [18, 19]. A key addition to the second version 2 of miRDeep has been the consideration of species conservation, e.g. a second set of miRNA from a closely related species is required to be included in the prediction process [20, 21].
miRanalyzer is based on a random forest classifier and uses support vector machine (SVM) mechanics derived from experimental data to make its predictions [22, 23]. Version one of this software functioned as a web-based tool; version two now is available in a web-based and executable form. One benefit of using web-based applications is that they allow the user to analyze their results without having access to a large amount of computer resources. The first version of the software targeted seven model species (human, mouse, rat, fruit-fly, round worm, zebra fish and dog); newer versions of the program have incorporated plant genomes and predictions based on plant models [22, 23]. Like miRDeep2, miRanalyzer uses the program Bowtie to map input reads to the target genome. Apart from specifying the number of allowable mismatches, and the acceptable P level for a credible prediction, the user, however, is restricted from any other major changes in the algorithm.
The current version of deep-sequencing small RNA analysis pipeline (DSAP) differs from miRDeep or miRanalyzer in that it does not require a target genome; reads are, instead, clustered into unique groups and mapped onto the existing RNA families database (e.g. RFAM) and miRNA databases to determine status [24]. By eliminating the target genome, the program improves processing speeds considerably when compared with miRanalyzer and miRDeep; it is, however, restricted in its use by only being able to predict known miRNA signatures. Also, DSAP uses a different mapping algorithm, Supermatcher from the EMBOSS tool kit to increase processing speed [25].
Data sets used
Two types of data sets (experimental and simulated) were used in comparing the software performance of miRDeep, miRanalyzer and DSAP. The first experimental data set, derived from an in-house deep-sequencing experiment profiled a neuroblastoma cell line (NB; ATCC: crl-2271) The remaining experimental data sets representing a peripheral mononuclear blood cell line (PMBC), a chronic myelogenous leukemia cell line (K562), acute promyelogenous leukemia cell line (HL60) and a breast cancer cell line, respectively [26, 34], were downloaded from Geo Omnibus (GSM 494809, 494810, 494811, 494812, 715665) and pre-cleaned of universal adapters and redundant sequences. The neuroblastoma data set was prepared for analysis with Perl scripts written in-house. The simulated data set was created using Flux Simulator (http://flux.sammeth.net/) [35]. The parameters used by Flux Simulator to create the simulation can be found in Table 3. In addition, 100 known miRNAs (mirBase v16) were selected to ‘spike in’ the simulation at a prevalence of 0.1% in order to provide a metric against which ROC curve could be built [27]. Only miRNAs which did not cluster together were selected in order to minimize the statistics inflation resulting from detecting miRNAs with similar sequence characteristics, e.g. from the same family. The ROC curve was based on the ability of each program to correctly identify these ‘spiked in’ examples as miRNA candidates.
Table 3:
Parameters used by Flux Simulator to created simulation NGS RNAseq data set
| READ_LENGTH | 35 |
| TSS_MEAN | 25 |
| READ_NUMBER | 5 000 000 |
| NB_MOLECULES | 5 000 000 |
| GC_SD | 0.1 |
| GC_MEAN | 0.5 |
| SIZE_SAMPLING | AC |
| FRAG_SUBSTRATE | RNA |
| FRAG_METHOD | UR |
| FRAG_EZ_MOTIF | NlaIII |
| PAIRED_END | FALSE |
In comparing the results from each prediction data set, we chose to work with only those reads that mapped perfectly to a specific locus (PM) and those reads with only one base mismatch (MM), hopefully reducing the potential noise created by sequencing error. Known miRNAs were assessed in miRDeep (v1, 2), miRanalyzer and DSAP only. DSAP does not generate novel predictions and so could only be compared with miRDeep and miRanalyzer in terms of the known miRNA prediction [24]. Novel predictions which overlapped between miRDeep v1, 2 and miRanalyzer were experimentally validated using real-time PCR.
RESULTS
Uniquely mapped reads used to make predictions
When the percentage of reads used by each most current program in all data sets was compared, DSAP and miRanalyzer appeared to retain the highest percentage (Figure 1). In contrast, surprisingly, miRDeep v2 appeared on average to utilize only ∼20 % of its reads. This difference in the numbers of reads used was undoubtedly a result of the mapping algorithms applied by the respective programs and the lack of a target genome used by DSAP. The difference between miRanalyzer and miRDeep v2 may have been due to differences in parameters used to drive Bowtie. Under certain circumstances, a higher percentage of mapped reads may be preferable to the user as it indicates a larger portion of the available information utilized by the program.
Figure 1:

Percentage of mapped reads. A usable read was defined as one which mapped uniquely to a specific locus.
Figure 3:

Total numbers of miRNAs detected by miRanalyzer, miRDeep and miRDeep2 not present in MiRBase.
Numbers of known miRNAs and novel candidate predictions
After adjusting for the prediction size, software comparison between miRDeep, miRDeep2, miRanalyzer and DSAP showed a > 80% similarity of known miRNAs in each of the six biological data sets (Figure 2). In all cases, except the neuroblastoma data set and the simulated data set, miRDeep 2 generated slightly higher numbers of known miRNAs and the additional miRNAs identified were most often a miRNA from the same family and/or precursor sequence. In the case of the novel miRNA candidates, however, there was a lower percent overlap in the predictions; particularly, between miRAnalyzer and miRDeep/miRDeep2 suggesting that perhaps in comparison to miRDeep, miRAnalyzer is better suited to detect low-expressed candidates (Figure 3). As abundance is linked to detection in the miRDeep algorithm, novel candidates represented by low abundant reads may be excluded [36].
Figure 2:
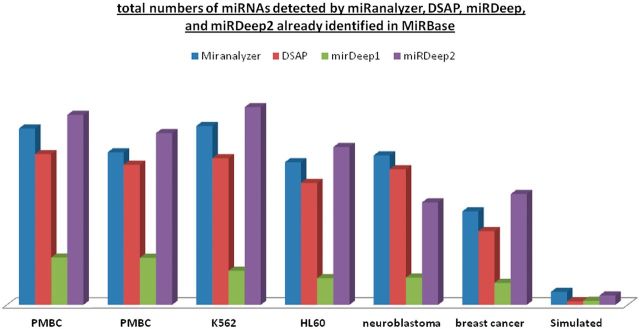
Total numbers of miRNAs detected by miRanalyzer, DSAP, miRDeep and miRDeep2 already identified in MiRBase.
Differences in length of hairpin
Distinct differences were noted when the predicted novel miRNAs from miRanalyzer and miRDeep were compared in the data sets. On the whole, reflective of algorithm differences, the average hairpin length predicted by miRanalyzer was 20 bases longer than that of miRDeep. In both programs, hairpin length is set as an arbitrary number of bases flanking the mature sequence which may be acceptable as hairpin length has been proven to be quite variable in both plants and animals [20–23]. In contrast, the length of the mature sequences varied little when each of the three data sets was analyzed with miRDeep, miRanalyzer and DSAP. This is unsurprising as the determination of the mature miRNA is based on the detected read. Curiously enough, though, we did observe variability in the 3′ end (∼3 nt) of the mature sequences in the neuroblastoma data set when it was analyzed by miRDeep v1. This variability has not been seen in the miRNAs generated by miRDeepv2 and may have been unique to the software edition.
ROC curves for simulated data set
A non-redundant data set containing 733 494 reads was evaluated with miRDeep, miRDeep2, miRanalyzer and DSAP on the basis of their ability to correctly identify 100 known miRNAs that was ‘spiked in’ randomly at a prevalence of 0.1%. Whether a prediction could be termed true or false was based on: (i) being predicted as miRNA and (ii) being mapped to the correct location. The ROC curves generated for the simulated data set showed miRDeep/miRDeep2 to demonstrate slightly better levels of specificity than miRanalyzer and DSAP. Based on the simulation data, accuracy levels for each test were calculated at 80.4 and 75.4% for miRDeep and miRDeep2, respectively. The accuracy level for miRanalyzer was 68.3% and the accuracy level for DSAP was 67.3% 9 (Figure 4).
Figure 4:

ROC curve generated using simulated data.
Experimental validation of overlapping novel predictions
To determine how effective the programs were at identifying novel miRNAs, we chose predictions that overlapped in each of the four programs from our neuroblastoma data set and validated the presence of these novel miRNAs with Taqman RT-PCR. Of the 16 that were identified as overlapping, 12 novel miRNAs were validated successfully. Six of these 12 novel miRNAs validated by us, however, have been since reported by other researchers. In comparing the Cq values of this group to ours, we noticed that in our sample the Cq values were in fact much lower. The differences may be reflective of cell line differences as these six previously reported miRNA were first identified in fibroblasts.
We also attempted to validate the precursor sequence associated with each predicted novel miRNA to determine the accuracy with which each program could predict precursor sequences. We tested both the precursors generated by miRanalyzer and miRDeep of the remaining six novel miRNAs and only two generated by miRDeep were verified (prd-mir-7, prd-mir-14). The hairpins predicted by miRDeep and miRanalyzer in many cases were discontinuous representations of each other. The predicted hairpin size varied when compared between miRanalyzer and miRDeep and this variability undoubtedly impacted our ability to verify efficiently the novel precursor predictions using Taqman assays. Also, curiously enough, in the six novel miRNAs identified in our study but annotated by others, the coordinates of the respective precursors predicted by miRDeep/miRanalyzer and the annotated coordinates differed by over 35 000 bases. This discrepancy may have been due to cross mapping events, or more likely, is evidence of inaccurate precursor prediction [27, 28].
The Cq values in Table 4 suggest that the novel miRNA identified by this study are expressed at low levels, and therefore more difficult to detect by more traditional methods. The low expression level of these novel candidates is unsurprising. Given the amount of work that has been devoted toward the detection and identification of novel miRNA candidates in the last few years, it is unlikely that any new highly expressed candidates will be found.
Table 4:
Average CQ values
| Sample | average_CQ | average_CQ_precursor | annotated as (MirBase) |
|---|---|---|---|
| prd_mat-1 | 28.93 | no amplification | |
| prd_mat-2 | 35.00 | no amplification | Hsa-mir-3660 |
| prd_mat-3 | 36.03 | no amplification | Hsa-mir-4428 |
| prd_mat-5 | 29.89 | no amplification | |
| prd_mat-6 | 19.10 | no amplification | |
| prd_mat-7 | 26.91 | 31.53 | |
| prd_mat-8 | 34.10 | no amplification | |
| prd_mat-11 | 32.25 | no amplification | Hsa-mir-3131 |
| prd_mat-13 | 35.45 | no amplification | Hsa-mir-4421 |
| prd_mat-14 | 32.52 | 34.11 | |
| prd_mat-16 | 31.65 | no amplification | Hsa-mir-2110 |
| prd_mat-17 | 36.10 | no amplification | Hsa-mir-4222 |
Twelve of the 17 overlapping novel candidates were validated with Taqman RT-PCR.
DISCUSSION
At first, we intended to use the additional programs (DSAP, miRanalyzer) to validate predictions generated by miRDeep; however, in comparing the output, we realized that the software dramatically affects the number and quality of predictions generated. Several conceptual questions arose from our comparison, particularly with regard to the determination of the hairpin sequence and the mapping algorithm used by each program. It has been suggested that certain programs vary in terms of their mapping accuracy of short reads (<35 bases) [31]. The size of the target as well as its apparent degree of complexity both are likely to impact the differences in miRNA prediction through the intermediate effect of mapped reads [31]. Mapping programs, such as Bowtie, have been cited to randomly assign reads to incorrect locations if there is ambiguity [31]. Each of the three programs employed a different approach to mapping which may account for the differences in stringency. The effect of mapping technique can clearly be seen when miRDeep v1 is compared with miRDeep2 (Figure 5). When broken down into separate tasks, the amount of time spent by miRDeepv1 to map the reads to the target genome was ∼20% longer than that of miRDeep2. Further, phenomena such as cross mapping can serve to confuse the mapping of the read to the precursor [29, 30].
Figure 5:

Average compute time spent by miRDeep and miRDeep2 on analyzing data sets.
Until now, it has been difficult to compare the performance of these programs because of the lack of available data sets. We have not had the opportunity to observe the effect that mapping algorithm might have on miRNA prediction. Now, there are enough data sets available for software testing, the tools with which we analyze these data sets can be refined even further and perfected. The choice of Bowtie was undoubtedly due to practical considerations; use of Bowtie does, in fact, speed up the process of analysis. On average, miRDeepv1 took three times as long to complete its analysis (10.5 h) compared with that of miRDeep2 (2.87 h) on a T5500 Dell workstation running Ubuntu 12.04 (Table 5; Figure 5). Also, web-based applications, such as DSAP and miRanalyzer, are difficult to benchmark as one’s data is usually placed in a compute queue. The ability to facilitate increased speed may not always be advantageous as incorrect mapping may lead to increased false-positives findings.
Table 5:
Calculation time in hours taken to complete analysis
| Data set | miRAnalyzer | miRDeepv1 | miRDeepv2 | DSAP |
|---|---|---|---|---|
| PMBC1 | 12 | 13 | 3 | 7 |
| PMBC2 | 7 | 8 | 2.5 | 5 |
| NB | 7 | 9 | 4 | 5 |
| K562 | 5 | 13 | 3 | 7 |
| HL60 | 8 | 10 | 2.5 | 7 |
| Breast Cancer | 5 | 8 | 2 | 8 |
| Simulated | 13 | 12 | 3 | 9 |
Given the time and cost involved in validating predicted miRNA, however, it is prudent to use a consensus approach to miRNA prediction with an intersection of the mapping results from a number of different programs rather than results from one single program. An iterative-mapping profile could be generated from multiple programs that would enable the user to identify the reads that map to multiple locations and also those regions of the target genome that might be pre-disposed toward such activity. Reads with high-quality base scores throughout that map to the same single location regardless of program could then be carried forward to predict miRNAs. An additional step that might be useful to consider is the accuracy of the reference genome itself in relation to the reads which are being mapped. Reference genomes, by virtue of their composition, vary considerably both in terms of quality and base accuracy [28]. Both miRDeep and miRanalyzer rely on a reference genome and generally exclude reads that do not map cleanly to the reference genome (less than two base mismatches). Base inaccuracies in the reference genome might inadvertently cause reads to be excluded by the software or worse yet, to be incorrectly mapped altogether. We suggest that algorithms such as employed by the program iCorn could effectively be implemented in the mapping process to increase the amount of potential information garnered in the analysis process. iCorn iteratively maps reads to the target genome, adjusting the sequence of the target genome if the mismatch is caused by a base with a good quality score and that the adjustment/read mapping would increase overall coverage [32]. To the best of our knowledge, none of the programs discussed in this article address the overall accuracy of the reference sequence used, and indeed, we ourselves did not take this into account when doing our analysis. Here, we only suggest this additional step as a way to further improve the accuracy of the mapping process.
One area in which miRDeep and miRanalyzer both demonstrate apparent weakness is lack of specificity to detect the precursor sequence. When examining the novel miRNAs predicted by miRDeep and miRanalyzer, we detected two instances where precursors were predicted poorly in relation to the mature sequence. In the first, novel predictions that overlapped between miRanalyzer and miRDeep demonstrated discontinuous precursors. Each predicted precursor shared the mapped read but the boundaries of the predicted precursor varied. In the second instance, six novel miRNA candidates which had already been detected by other authors were predicted to map to loci entirely different from previously reported. It is apparent that additional information is needed with respect to the precursor sequence itself before acceptable prediction parameters can be employed in detection software. Actual hairpin length varies from 60 to 120 nt in annotated examples. The current miRNA-based deep-sequencing methodology focuses solely on the mature sequence and the precursor prediction is generally a theoretical extraction based on the information provided by the mapped read. We recommend that more methods both experimental (deep-sequencing data generation) and computational (addressing precursor sequence motifs and folding) need be devised to resolve the apparent discrepancy in detection of miRNA precursors [31].
CONCLUSION
Deep sequencing does pose considerable computational and analytical challenges that must be overcome before it can become a fully realized form of analysis in miRNA research. Apart from the technical issues raised by different platforms, researchers also must be aware of the impact that their choice of the program might have on their analysis. We believe that, for the moment, miRDeep represents the best solution for researchers looking for novel candidates to pursue as its stringency level reduces the number of false-positive generated. Therefore, careful consideration of deep sequencing results is vital both with respect to the mature as well as the hairpin sequences. A large research effort, until now, has been predominantly devoted to detection of miRNA mature sequences, but not enough effort has been devoted to detection of their intermediate precursor forms. Added experimental information regarding the intermediate precursor can serve to help refine the detection process. The amount of information generated through these initial studies is now of sufficient size that a correct assessment can be made of the techniques used to generate it. A limitation of our study is indeed the number of data sets studied and the number of programs compared, but, nevertheless, it does suggest that caution is necessary when using this type of sequencing for miRNA prediction.
Key Points.
A number of programs are now available that can be used to predict miRNAs from RNAseq data sets.
These programs vary in terms of the resources/skill needed to implement successfully.
A comparison of three programs suggests that although similar groups are predicted, the programs varied in terms of predicted candidates.
Despite an apparent high stringency, miRDeep appears to be the best algorithm for those researchers wishing to pursue novel miRNA for further experimentation as its design allows the researcher to address concerns such as mapping efficiency.
FUNDING
Stanley Medical Research Institute (#08R-1959, 2008) and the Jeffers Foundation (#J-1015, 2011) grants to V.V.
Biographies
Vernell Williamson is a PhD student in Integrative Life Sciences at Virginia Commonwealth University. Her research interests include detection of novel miRNA and integration of large data sets.
Albert Kim received his PhD in June, 2011 from Virginia Commonwealth University. He is currently finishing his medical training with the same university.
Bin Xie is affiliated with the division of Genomics, Epigenomics and Bioinformatics, Lieber Institute for Brain Development, Baltimore, Maryland, USA.
Omari McMichael is a laboratory specialist at the Virginia Institute of Psychiatric and Behavioral Genetics.
Yuan Gao is affiliated with Division of Genomics, Epigenomics, and Bioinformatics, Lieber Institute for Brain Development, Baltimore, Maryland, USA.
Vladimir Vladimirov is an assistant professor affiliated with Virginia Institute for Psychiatric and Behavioral Genetics and School of Pharmacy at Virginia Commonwealth University. His research interests include studying miRNA, gene expression and epigenetics of psychiatric disorders.
References
- 1.Krol J, Krzyzosiak WJ. Structural aspects of microRNA biogenesis. IUBMB Life. 2004;56:95–100. doi: 10.1080/15216540410001670142. [DOI] [PubMed] [Google Scholar]
- 2.Li Y, Lin L, Jin P. The microRNA pathway and fragile X mental retardation protein. Biochim Biophys Acta. 2008;1779:702–5. doi: 10.1016/j.bbagrm.2008.07.003. [DOI] [PMC free article] [PubMed] [Google Scholar]
- 3.Mencia A, Modamio-Hoybjor S, Redshaw N, et al. Mutations in the seed region of human miR-96 are responsible for nonsyndromic progressive hearing loss. Nat Genet. 2009;41:609–13. doi: 10.1038/ng.355. [DOI] [PubMed] [Google Scholar]
- 4.Scalbert E, Bril A. Implication of microRNAs in the cardiovascular system. Curr Opin Pharmacol. 2008;8:181–8. doi: 10.1016/j.coph.2007.12.013. [DOI] [PubMed] [Google Scholar]
- 5.Oulas A, Boutla A, Gkirtzou K, et al. Prediction of novel microRNA genes in cancer-associated genomic regions—a combined computational and experimental approach. Nucleic Acids Res. 2009;37:3276–87. doi: 10.1093/nar/gkp120. [DOI] [PMC free article] [PubMed] [Google Scholar]
- 6.Saetrom P, Snove O, Nedland M, et al. Conserved MicroRNA characteristics in mammals. Oligonucleotides. 2006;16:115–44. doi: 10.1089/oli.2006.16.115. [DOI] [PubMed] [Google Scholar]
- 7.Kim VN. MicroRNA biogenesis: coordinated cropping and dicing. Nat Rev Mol Cell Biol. 2005;6:376–85. doi: 10.1038/nrm1644. [DOI] [PubMed] [Google Scholar]
- 8.Kim YK, Kim VN. Processing of intronic microRNAs. EMBO J. 2007;26:775–83. doi: 10.1038/sj.emboj.7601512. [DOI] [PMC free article] [PubMed] [Google Scholar]
- 9.Rodriguez A, Griffiths-Jones S, Ashurst JL, et al. Identification of mammalian microRNA host genes and transcription units. Genome Res. 2004;14:1902–10. doi: 10.1101/gr.2722704. [DOI] [PMC free article] [PubMed] [Google Scholar]
- 10.Erdmann VA, Szymanski M, Hochberg A, Groot N, Barciszewski J. Non-coding, mRNA-like RNAs database Y2K. Nucleic Acids Res. 2000;28:197–200. doi: 10.1093/nar/28.1.197. [DOI] [PMC free article] [PubMed] [Google Scholar]
- 11.Sinha S, Vasulu TS, De RK. Performance and evaluation of MicroRNA gene identification tools. J Proteom Bioinform. 2009;2:336–43. [Google Scholar]
- 12.Borchert GM, Lanier W, Davidson BL. RNA polymerase III transcribes human microRNAs. Nat Struct Mol Biol. 2006;13:1097–101. doi: 10.1038/nsmb1167. [DOI] [PubMed] [Google Scholar]
- 13.Jiang P, Wu H, Wang W, et al. MiPred: classification of real and pseudo microRNA precursors using random forest prediction model with combined features. Nucleic Acids Res. 2007;35:W339–44. doi: 10.1093/nar/gkm368. [DOI] [PMC free article] [PubMed] [Google Scholar]
- 14.Eaves HL, Gao Y. MOM: maximum oligonucleotide mapping. Bioinformatics. 2009;25:969–70. doi: 10.1093/bioinformatics/btp092. [DOI] [PubMed] [Google Scholar]
- 15.Berezikov E, Guryev V, van de Belt J, et al. Phylogenetic shadowing and computational identification of human microRNA genes. Cell. 2005;120:21–4. doi: 10.1016/j.cell.2004.12.031. [DOI] [PubMed] [Google Scholar]
- 16.Mendes ND, Freitas AT, Sagot MF. Current tools for the identification of miRNA genes and their targets. Nucleic Acids Res. 2009;37:2419–33. doi: 10.1093/nar/gkp145. [DOI] [PMC free article] [PubMed] [Google Scholar]
- 17.Friedlander MR, Chen W, Adamidi C, et al. Discovering microRNAs from deep sequencing data using miRDeep. Nat Biotechnol. 2008;26:407–15. doi: 10.1038/nbt1394. [DOI] [PubMed] [Google Scholar]
- 18.Langmead B, Trapnell C, Pop M, Salzberg SL. Ultrafast and memory-efficient alignment of short DNA sequences to the human genome. Genome Biol. 2009;10(3):R25. doi: 10.1186/gb-2009-10-3-r25. [DOI] [PMC free article] [PubMed] [Google Scholar]
- 19.Bonnet E, Wuyts J, Rouze P, Van de Peer Y. Evidence that microRNA precursors, unlike other non-coding RNAs, have lower folding free energies than random sequences. Bioinformatics. 2004;20(17):2911–7. doi: 10.1093/bioinformatics/bth374. [DOI] [PubMed] [Google Scholar]
- 20.Friedlander MR, Mackowiak SD, Li N, et al. miRDeep2 accurately identifies known and hundreds of novel microRNA genes in seven animal clades. Nucleic Acids Res. 2012;40(1):37–52. doi: 10.1093/nar/gkr688. [DOI] [PMC free article] [PubMed] [Google Scholar]
- 21.Mackowiak SD. Identification of novel and known miRNAs in deep-sequencing data with miRDeep2. In: Baxevanis AD, et al., editors. Current Protocols in Bioinformatics. Chapter 12, Unit 12.10. John E Wiley and Sons, 2011. [DOI] [PubMed] [Google Scholar]
- 22.Hackenberg M, Sturm M, Langenberger D, et al. miRanalyzer: a microRNA detection and analysis tool for next-generation sequencing experiments. Nucleic Acids Res. 2009;37:W68–76. doi: 10.1093/nar/gkp347. [DOI] [PMC free article] [PubMed] [Google Scholar]
- 23.Hackenberg M, Rodriguez-Ezpeleta N, Aransay AM. miRanalyzer: an update on the detection and analysis of microRNAs in high-throughput sequencing experiments. Nucleic Acids Res. 2011;39(Web Server issue):W132–8. doi: 10.1093/nar/gkr247. [DOI] [PMC free article] [PubMed] [Google Scholar]
- 24.Huang P, Liu Y, Lee C, et al. DSAP: deep-sequencing small RNA analysis pipeline. Nucleic Acids Res. 2010;38:W385–91. doi: 10.1093/nar/gkq392. [DOI] [PMC free article] [PubMed] [Google Scholar]
- 25.Rice P, Longden I, Bleasby A. EMBOSS: the European molecular biology open software suite. Trends Genet. 2000;16(6):276–7. doi: 10.1016/s0168-9525(00)02024-2. [DOI] [PubMed] [Google Scholar]
- 26.Vaz C, Ahmad HM, Sharma P, et al. Analysis of microRNA transcriptome by deep sequencing of small RNA libraries of peripheral blood. BMC Genom. 2010;11:288–306. doi: 10.1186/1471-2164-11-288. [DOI] [PMC free article] [PubMed] [Google Scholar]
- 27.Griffiths-Jones S, Saini HK, van Dongen S, et al. miRBase: tools for microRNA genomics. Nucleic Acids Res. 2008;36:D154–8. doi: 10.1093/nar/gkm952. [DOI] [PMC free article] [PubMed] [Google Scholar]
- 28.Thakur V, Wanchana S, Xu M, et al. Characterization of statistical features for plant microRNA prediction. BMC Genom. 2011;12:108–20. doi: 10.1186/1471-2164-12-108. [DOI] [PMC free article] [PubMed] [Google Scholar]
- 29.de Hoon MJ, Taft RJ, Hashimoto T, et al. Cross-mapping and the identification of editing sites in mature microRNAs in high-throughput sequencing libraries. Genome Res. 2010;20:257–64. doi: 10.1101/gr.095273.109. [DOI] [PMC free article] [PubMed] [Google Scholar]
- 30.Guo L, Liang T, Gu W, et al. Cross-mapping events in miRNAs reveal potential miRNA-mimics and evolutionary implications. PloS One. 2011;6:e20517–24. doi: 10.1371/journal.pone.0020517. [DOI] [PMC free article] [PubMed] [Google Scholar]
- 31.Palmieri N, Schlotterer C. Mapping accuracy of short reads from massively parallel sequencing and the implications for quantitative expression profiling. PloS One. 2009;4:e6323–33. doi: 10.1371/journal.pone.0006323. [DOI] [PMC free article] [PubMed] [Google Scholar]
- 32.Otto TD, Sanders M, Berriman M, Newbold C. Iterative correction of reference nucleotides (iCORN) using second generation sequencing technology. Bioinformatics. 2010;26:1704–7. doi: 10.1093/bioinformatics/btq269. [DOI] [PMC free article] [PubMed] [Google Scholar]
- 33.Zhu E, Zhao F, Xu G, Hou H, Zhou L, Li X, et al. mirTools: microRNA profiling and discovery based on high-throughput sequencing. Nucleic Acids Res. 2010;38(Web Server issue):W392–7. doi: 10.1093/nar/gkq393. [DOI] [PMC free article] [PubMed] [Google Scholar]
- 34.Farazi TA, Horlings HM, Ten Hoeve JJ, et al. MicroRNA sequence and expression analysis in breast tumors by deep sequencing. Cancer Res. 2011;71(13):4443–53. doi: 10.1158/0008-5472.CAN-11-0608. [DOI] [PMC free article] [PubMed] [Google Scholar]
- 35.Creighton CJ, Reid JG, Gunaratne PH. Expression profiling of microRNAs by deep sequencing. Brief Bioinform. 2009;10(5):490–7. doi: 10.1093/bib/bbp019. [DOI] [PMC free article] [PubMed] [Google Scholar]
- 36.Howard BE, Heber S. Towards reliable isoform quantification using RNA-SEQ data. BMC Bioinform. 2010;11(Suppl 3):S6. doi: 10.1186/1471-2105-11-S3-S6. [DOI] [PMC free article] [PubMed] [Google Scholar]