Abstract
Recent years have witnessed important public investments in physicians' compensation across Canada. The current paper uses data from Quebec to assess the impact of those investments on the volumes of services provided to the population. While total physician compensation costs, average physician compensation and average unit cost per service all rose extremely fast, the total number of services, number of services per capita and average number of services per physician either stagnated or declined. This pattern is compatible with the economic target income hypothesis and raises important policy questions.
Abstract
Ces dernières années, d'importants investissements publics dans la rémunération des médecins ont été consentis partout au Canada. Cet article utilise les données du Québec pour évaluer l'impact de ces investissements sur le volume de services fourni à la population. Alors que les dépenses totales liées à la rémunération des médecins, la rémunération moyenne par médecin et le coût unitaire moyen par service ont tous trois connu une hausse très rapide, la quantité totale de services, le nombre de services par personne et le nombre moyen de services par médecin ont soit stagné soit décliné. Ces observations sont conformes aux comportements attendus selon l'hypothèse économique de la recherche d'un revenu cible de la part des médecins ce qui soulève d'importantes questions à propos des politiques publiques.
Healthcare expenditures in Canada are rising steadily faster than GDP and thus constitute a growing proportion of the economy. In this general trend, physician compensation is, with prescription drugs, among the two largest cost drivers (CIHI 2011a). However, despite the increasing sums invested in physicians' services, converging sources show that health services accessibility remains unsatisfactory (CSBE 2013; Health Council of Canada 2013; Hutchison 2013). In 2007, after bitter negotiations between physicians' federations and the Quebec government, agreements were signed to increase fee schedules significantly over the following five years. The current paper uses 2007 to 2011 data on physician compensation and volumes of services in Quebec to assess the impact of those investments on volumes of services provided to the population. The underlying assumption is that as more money is invested in fee increases, physician behaviours, consistent with the “target income hypothesis,” will reduce the volumes of services provided.
Conceptual Model and Data
In economic theory, the target income hypothesis posits that people aim for a given level of income and will adjust their work practice to reach it. This implies, among other things, that when the rate paid for a given amount of work increases, workers might choose to work less rather than to increase their revenues. Rapid and steep increases in paid rates are thought to induce a stronger diminution of work intensity than modest and steady increases. In the same way, it is commonly suggested that workers with incomes in the highest deciles are more likely to choose quality of life and additional leisure over income increases. Given those postulates, it is not surprising that physicians are often given as an example to illustrate this hypothesis (Kantarevic et al. 2008; Rizzo and Blumenthal 1996).
The expenditure and service volume data used here come from RAMQ Table SM.21 (RAMQ 2012). Although the Canadian Institute for Health Information (CIHI 2013) provides physician compensation costs and volume data for all provinces, the marked discrepancy between data obtained from provincial agencies such as RAMQ on the one hand, and CIHI data on the other, call strongly into question the validity of any comparative analysis. Preliminary analysis conducted on the CIHI data suggested that no reliable interprovincial analysis could be performed.
In a fee-for-service (FFS) compensation model, each service provided is billed individually to the provincial reimbursement agency, thereby making valid and detailed data readily available on the volume of medical services provided under FFS compensation for each province. The challenge, however, is that a growing proportion of total physician compensation in Canada is paid according to non-FFS models such as salary or capitation, and there are no reliable data on volumes of services provided in non-FFS models. During the period studied here, the percentage of physician compensation paid on other bases than FFS rose from 26% to 29% for family physicians while it dropped from 21% to 17% for specialist physicians. To overcome the lack of data, we devised a simple formula to compute the total number of services. This formula rests on the postulate that the productivity of physicians paid on a non-FFS basis is identical to that of physicians paid through FFS. In practice, this postulate is likely to significantly overestimate the total volume of services for two reasons. First, non-FFS compensation includes non-volume related payments. Second, FFS is generally accepted as a compensation mechanism that stimulates volume increases compared to salary-type compensation (Gosden et al. 2000; Léger 2011). However, because we hypothesized the existence of a drop in the total volume of service, reliance on a method likely to overestimate actual volume makes sense. The total volume of services was computed according to the formulas below:
| Total volume = actual FFS volume + estimated non-FFS volume |
| Estimated non-FFS volume = [(non-FFS compensation in % of total compensation x number of FFS services) / FFS compensation in % of total compensation)] |
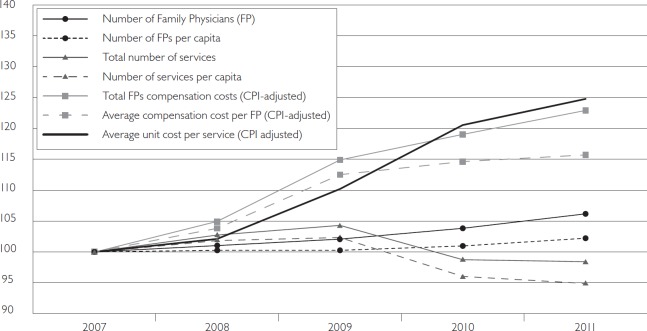
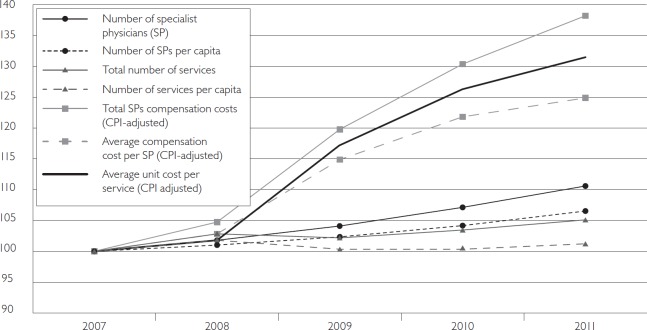
All cost data were adjusted for inflation using Quebec's general Consumer Price Index (CPI) (Statistics Canada 2013) prior to any other computation. We then computed physician compensation expenditures and volumes of services in various units and normalized them to an index of 100 to plot them on a single graph. The results are shown in Figures 1 and 2.
FIGURE 1.
Family physicians: Evolution of practice and costs
Source: Based on data from RAMQ 2012.
FIGURE 2.
Specialist physicians: Evolution of practice and costs
Source: Based on data from RAMQ 2012.
Results and Discussion
As the two graphs show, while total physician compensation costs, average physician compensation and average unit cost per service all rose extremely fast, the total number of services, number of services per capita and average number of services per physician either stagnated or declined. The only exception was a modest increase in the total number of specialized services, although not when expressed as per capita or per physician. It should also be noted that costs were CPI-adjusted, and hence all increases represent net gain controlled for inflation. The same analyses were also conducted singling out medical, surgical and laboratory specialists. The same trends were seen in all the groups, with the surgical specialists showing the steepest increase in overall costs.
From a public policy perspective, the general picture these graphs reveal is disturbing. Over those five years, an additional 1.5 billion dollars was paid to physicians in Quebec (amounting to average annual increases of over 7%, twice the rise in provincial GDP). However, the net impact of those investments was either a stagnation or reduction in the volume of services provided. Moreover, the decrease in the average volume of services per physician offsets most or all of the increase in the overall number of physicians. These observations are highly convergent with the target income hypothesis: as the unit price of service rose, physicians adjusted their work practice and, overall, limited the number of services provided.
The policy debate on physician compensation in Quebec is heavily influenced by pleas from physicians' federations to increase fee schedules so that they align with the Canadian average. The underlying argument is that lower-than-average fees lead to an exodus of medical human resources and, ultimately, a decrease in the volume and availability of services. This argument is consistently put forward, notwithstanding the fact that CIHI data on physician migration (CIHI 2011b) have shown a positive net migration trend for the last two years in Quebec. What our analysis shows, however, is that the increases in fee schedules recently implemented in Quebec – in part, to prevent a non-existing migratory trend – are likely to have a real negative impact on volumes of services provided.
As with any other allocation of public funds, arguments can be found to justify current investments in physician compensation, the perceived desirability of which depends on one's values and normative preferences. What the data presented here add to the debate is the technical aspect of the question. The recent increased investments in physician compensation appear to have lowered the volume of services provided. This finding prompts a very practical question: If, indeed, such investments are to be made, are there ways to make sure they do not cause a decrease in healthcare services accessibility? Improving the availability and accessibility of medical services in Canada while controlling healthcare expenditure will require convincing answers to this simple question.
Contributor Information
Damien Contandriopoulos, Associate Professor, Faculté des sciences infirmières, Université de Montréal, Montreal, QC.
Mélanie Perroux, Research Coordinator, Faculté des sciences infirmières, Université de Montréal, Montreal, QC.
References
- Canadian Institute for Health Information (CIHI). 2011a. Health Care Cost Drivers: The Facts. Retrieved October 29, 2013. <https://secure.cihi.ca/estore/productFamily.htm?locale=en&pf=PFC1672>.
- Canadian Institute for Health Information (CIHI). 2011b. Supply, Distribution and Migration of Canadian Physicians. Retrieved October 29, 2013. <https://secure.cihi.ca/estore/productFamily.htm?pf=PFC1968&lang=en&media=0>.
- Canadian Institute for Health Information (CIHI). 2013. National Physician Database, 2011–2012 Data Release. Retrieved October 29, 2013. <https://secure.cihi.ca/estore/productFamily.htm?locale=en&pf=PFC2368>.
- Commissaire à la santé et au bien-être du Québec (CSBE). 2013. Perceptions et expériences des médecins de première ligne: Le Québec comparé. Résultats de l'Enquête internationale sur les politiques de santé du commonwealth fund de 2012. Quebec: Author. [Google Scholar]
- Gosden T., Frode F., Kristiansen I., Sutton M., Leese B., Giuffrida A. et al. 2000. Capitation, Salary, Fee-for-Service and Mixed Systems of Payment: Effects on the Behaviour of Primary Care Physicians. Cochrane Database of Systematic Reviews 2000, Issue 3. Art. no. CD002215. 10.1002/14651858.CD002215. [DOI] [PMC free article] [PubMed] [Google Scholar]
- Health Council of Canada. 2013. How Do Canadian Primary Care Physicians Rate the Health System? Survey Results from the 2012 Commonwealth Fund International Health Policy Survey of Primary Care Doctors. Bulletin no. 7. Retrieved October 29, 2013. <http://www.healthcouncilcanada.ca/rpt_det.php?id=444>. [Google Scholar]
- Hutchison B. 2013. “From Hall to Now: Reflections on Canadian Medicare from a Primary Care Perspective.” 2013 Emmett Hall Memorial Lecture. Vancouver: Canadian Association for Health Services and Policy Research (CAHSPR). [Google Scholar]
- Kantarevic J., Kralj B., Weinkauf D. 2008. “Income Effects and Physician Labour Supply: Evidence from the Threshold System in Ontario.” Canadian Journal of Economics 41(4): 1262–84. 10.1111/j.1540-5982.2008.00503.x. [Google Scholar]
- Léger P.T. 2011. “Physician Payment Mechanisms: An Overview of Policy Options for Canada.” Ottawa: Canadian Health Services Research Foundation; Retrieved October 29, 2013. <http://www.cfhi-fcass.ca/sf-docs/default-source/hospital-funding-docs/CHSRF-LegerPhysicianRenumerationENG.pdf?sfvrsn=0>. [Google Scholar]
- Régie de l'assurance maladie du Québec (RAMQ). 2012. Tableau SM.21. Quebec: Author. [Google Scholar]
- Rizzo J.A., Blumenthal D. 1996. “Is the Target Income Hypothesis an Economic Heresy?” Medical Care Research and Review 53(3): 243–66. 10.1177/107755879605300301. [DOI] [PubMed] [Google Scholar]
- Statistics Canada. 2013. “Consumer Price Index (CPI), Seasonally Adjusted, 2011 Basket.” CANSIM table 326-0022. Retrieved October 29, 2013. <http://www5.statcan.gc.ca/cansim/a26?lang=eng&retrLang=eng&id=3260022&paSer=&pattern=&stByVal=1&p1=1&p2=1&tabMode=dataTable&csid=>.


