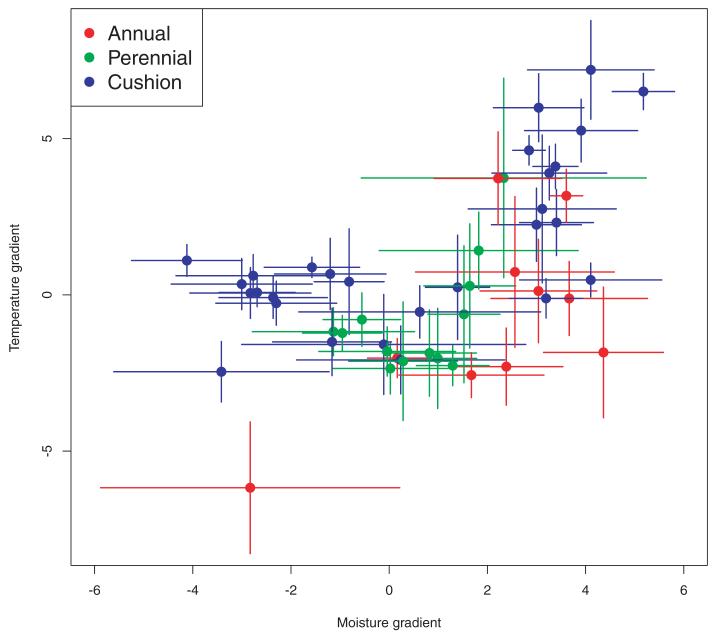
Figure 2.
Climatic niche separation. Ordination plot of mean OMI scores, with standard deviation bars, for 51 species of the Androsace genus. Moisture increases and temperature decreases when moving toward higher positive values. Species are colored according to their life forms. Cushions occupy a larger part of the climatic space than other life forms.

