Abstract
Hes1 is a member of the family of basic helix-loop-helix transcription factors and the Hes1 gene regulatory network (GRN) may be described as the canonical example of transcriptional control in eukaryotic cells, since it involves only the Hes1 protein and its own mRNA. Recently, the Hes1 protein has been established as an excellent target for an anti-cancer drug treatment, with the design of a small molecule Hes1 dimerisation inhibitor representing a promising if challenging approach to therapy.
In this paper, we extend a previous spatial stochastic model of the Hes1 GRN to include nuclear transport and dimerisation of Hes1 monomers. Initially, we assume that dimerisation occurs only in the cytoplasm, with only dimers being imported into the nucleus. Stochastic simulations of this novel model using the URDME software show that oscillatory dynamics in agreement with experimental studies are retained. Furthermore, we find that our model is robust to changes in the nuclear transport and dimerisation parameters. However, since the precise dynamics of the nuclear import of Hes1 and the localisation of the dimerisation reaction are not known, we consider a second modelling scenario in which we allow for both Hes1 monomers and dimers to be imported into the nucleus, and we allow dimerisation of Hes1 to occur everywhere in the cell. Once again, computational solutions of this second model produce oscillatory dynamics in agreement with experimental studies. We also explore sensitivity of the numerical solutions to nuclear transport and dimerisation parameters. Finally, we compare and contrast the two different modelling scenarios using numerical experiments that simulate dimer disruption, and suggest a biological experiment that could distinguish which model more faithfully captures the Hes1 GRN.
Keywords: Hes1, Spatial stochastic modelling, Dimerisation, Nuclear transport, URDME
1 Introduction
Gene regulatory networks (GRNs) lie at the core of intracellular signal transduction. GRNs can exhibit an oscillatory response in space and time to a range of external stimuli (Hirata et al. 2002; Geva-Zatorsky et al. 2006; Nelson et al. 2004; Shankaran et al. 2009). A negative feedback loop is often responsible for this behaviour, which controls the levels of mRNA and proteins. The proteins involved are transcription factors, which usually must form dimers or tetramers in order to function. The main function of transcription factors is to enhance or hinder transcription of mRNA, and to do this they must first pass through the nuclear membrane (via nuclear pores) and enter the nucleus. Once inside the nucleus, transcription factors bind to specific DNA sequences (promoter regions). A simple example of a regulatory network containing a negative feedback loop is the Hes1 GRN. The wealth of quantitative time course expression data available for this network makes it particularly amenable to mathematical modelling. The Hes1 GRN plays a central role in the timing of somitogenesis (Hirata et al. 2002). Hes1 can also protect quiescent fibroblasts from differentiation or senescence (Sang et al. 2008, 2010) and this has raised the notion of cancer therapies that specifically target Hes1. In particular, it was suggested in Sang et al. (2010) that disruption of Hes1 dimerisation could be an effective cancer treatment.
Dimerisation (and indeed polymerisation in general) is an important and common aspect of many intracellular reactions. Several key proteins vital for maintaining cellular homeostasis form dimers in order to function correctly. Examples include Hes1, p53, ERK and NF-κB (Kagemyama et al. 2007; Nicholls et al. 2002; Lidke et al. 2010; Oeckinghaus and Ghosh 2009). It is known that homodimerisation of Hes1 monomers results in greater stability of dimers in comparison to monomers (Bulcher et al. 2005), while some proteins cannot enter the nucleus unless they form a dimer (Jerke et al. 2009). Furthermore, Hes1 can form heterodimers with other bHLH proteins such as Hey1 and Hey2 that function even more efficiently than homodimers (Iso et al. 2001). In spite of the important roles dimerisation plays, many unknown factors remain such as where in the cell dimerisation occurs, and the rates of formation and disassociation of the dimers.
It is clear from experimental evidence that the proper function of GRNs depends critically on passage through the nuclear membrane by proteins and mRNAs. For example, transport of tumour suppressors and oncogene products across the nuclear membrane has been reported to be disrupted in cancer cells (Kim et al. 2000). It has also been suggested that modifying nuclear-cytoplasmic transport activity may block tumorigenesis (Kau et al. 2004). Therefore, it is important to model the structure of the nuclear membrane in detail, such as number of nuclear pores and spatial distribution of nuclear pores.
Intrinsic noise is commonly found in many intracellular signalling pathways (Barik et al. 2008, 2010; Shahrezaei and Swain 2008). The noise can arise due to low abundance of molecular species, randomness in certain key processes (e.g. binding and unbinding of transcription factors to promoter sites), stochasticity in production processes (transcription, translation) and degradation events (Wilkinson 2009). In addition to being inherently stochastic, intracellular signal transduction is inherently spatial. The eukaryotic cell hosts a variety of spatial compartments (e.g. cytoplasm, nucleus, nucleolus). Each compartment permits different metabolic activity and is often separated from the rest of the cell by a thin lipid membrane. Signalling molecules reach the appropriate spatial compartments through molecular movement such as diffusion and active transport. The key process of transcription occurs at highly localised sites—genes—in the nucleus. Within the cytoplasm, another key process—translation—occurs in the ribosomes. Clearly, mathematical models of GRNs will be more realistic the more they seek to account for stochastic and spatial features of these networks.
The application of spatial stochastic models to intracellular pathways is still a relatively new field of research. Some of the first spatial stochastic models were of the Min System in an Escherichia coli cell. Howard and Rutenberg (2003) used a stochastic analogue of a 1D system of reaction–diffusion equations and found that, for some parameter values, the protein concentrations were low enough that fluctuations were essential for the generation of patterns. In the model of Fange and Elf (2006) trajectories were generated using the next subvolume method (NSM), and numerical simulations were able to reproduce all documented Min phenotypes, where deterministic or non-spatial models failed. A spatial stochastic model of the MAPK pathway was developed in Takahashi et al. (2010). This model was implemented numerically using the Green’s function reaction dynamics approach, which allows for individual particle level simulation of molecular species. Using this technique, MAPK responses that could not be observed using a mean-field approach were produced. Another recent spatial stochastic model was developed to study in detail a generic transcription factor binding and unbinding to DNA (van Zon et al. 2006). Here, the spatial stochastic model was able to support the use of well-stirred, zero-dimensional models for describing noise in gene expression. It is clear from these few examples that spatial stochastic modelling can provide insight into intracellular signalling pathways that other approaches can not. For a comprehensive review of spatial stochastic modelling of intracellular processes, see Burrage et al. (2011).
In this paper, we extend the model of Sturrock et al. (2013) to include nuclear transport and dimerisation of Hes1 monomers. Whereas Sturrock et al. (2013) focused on the Hes1 GRN in embryonic stem cells, here we consider a generic study of the Hes1 GRN without specific application to any particular cell type. Initially, we follow the modelling assumptions of Momiji and Monk (2008) and assume that dimerisation occurs only in the cytoplasm, with dimers only being imported into the nucleus. Simulations of this novel model show that oscillatory dynamics in agreement with experimental studies are retained. Furthermore, we find that our model is robust to changes in nuclear transport and dimerisation parameters. Since the precise dynamics of the nuclear import of Hes1 and the localisation of the dimerisation reaction are not known, we consider a second modelling scenario in which we allow for both Hes1 monomers and dimers to be imported into the nucleus, and we allow dimerisation of Hes1 to occur everywhere in the cell. Once again, simulations of this second model produce oscillatory dynamics in agreement with experimental studies. We also explore sensitivity of the numerical solutions to nuclear transport and dimerisation parameters. Finally, we compare and contrast the two different models and suggest different biological experiments that could distinguish which model more faithfully captures the Hes1 GRN.
2 The Hes1 GRN
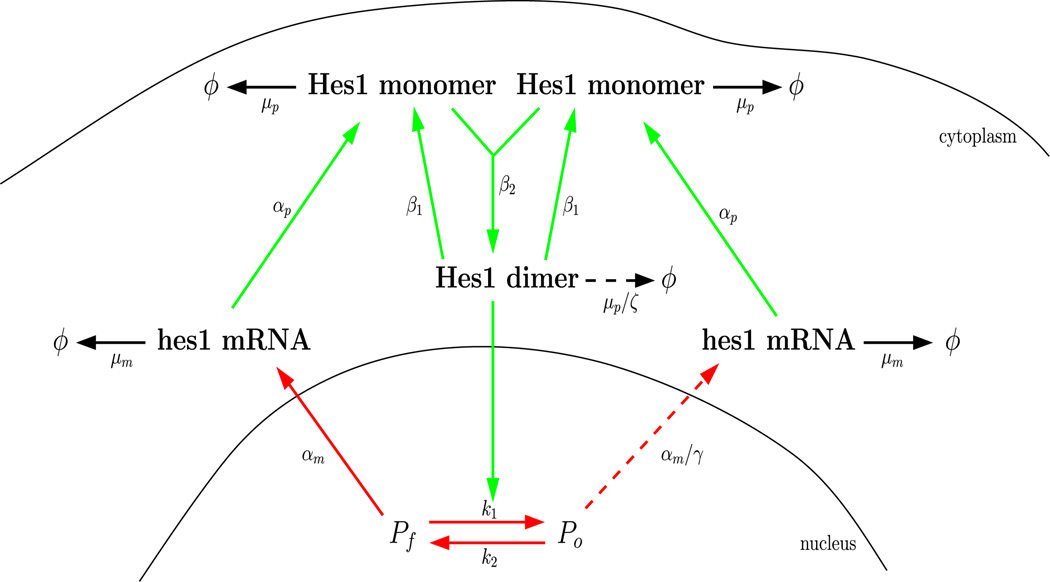
Hes1 is a member of the family of basic helix-loop-helix (bHLH) transcription factors and the Hes1 GRN may be described as the canonical example of transcriptional control in eukaryotic cells, since it only involves Hes1 protein and its mRNA. When the promoter site is free, hes1 mRNA is transcribed at its maximal rate. The newly created hes1 mRNA diffuses and is exported to the cytoplasm where it produces Hes1 protein monomers, which then bind together to form dimers in the cytoplasm. These dimers diffuse and are imported into the nucleus where they occupy the promoter and repress the transcription of hes1 mRNA (see Fig. 1). The occupied promoter site is still able to produce hes1 mRNA, but at a significantly reduced rate (Takebayashi et al. 1994).
Fig. 1.
The negative feedback loop in the Hes1 GRN. When the promoter site is free, hes1 mRNA is transcribed at its maximal rate. The nascent mRNA then diffuses and is exported to the cytoplasm where it produces Hes1 protein monomers via the process of translation. Hes1 monomers bind together to form dimers in the cytoplasm. Hes1 dimers diffuse and are imported into the nucleus. They go on to occupy the hes1 promoter and repress the transcription of hes1 mRNA. The occupied promoter site is still able to produce hes1 mRNA, but at a significantly reduced rate (Takebayashi et al. 1994) (Color figure online)
A number of experiments have been conducted to measure expression levels of hes1 mRNA and Hes1 protein in many different cultured mouse cell lines (Hirata et al. 2002). In response to a single serum treatment, it has been found that levels of hes1 mRNA and Hes1 protein exhibit oscillations with a regular period of approximately 2–3 hours. It has been found that these Hes1 oscillations are stable (both the period and amplitude are relatively constant) in presomitic mesoderm cells but unstable (the period and amplitude are variable) in individual dissociated presomitic mesoderm cells, suggesting that cell–cell communication is essential for stabilisation of such cellular oscillators (Masamizu et al. 2006). The results of Yoshiura et al. (2007) have shown that coupled Stat and Hes1 oscillations are important for efficient cell proliferation and provide evidence that expression modes of signalling molecules influence downstream cellular events.
Hes1 oscillations have also been observed in neural progenitor cells, again with a period of about 2–3 hours (Shimojo et al. 2008). It was found that these oscillations were responsible for the maintenance of neural progenitors and that sustained overexpression of Hes1 inhibited proliferation and differentiation of these cells. More recently, Hes1 expression was monitored in embryonic stem (ES) cells (Kobayashi et al. 2009), where it was discovered that Hes1 levels still oscillated in space and time, but with a period of 3–5 hours, longer than that of other cell lines. This lengthened period is thought to be a result of the increased stability of hes1 mRNA in ES cells. It has also been discovered that Hes1 oscillations contributed to heterogeneous differentiation responses of ES cells. Using fluorescence-activated cell sorting, ES cells with high and low expression levels of Hes1 were isolated and then immediately transferred to a neural differentiation medium. The experiment revealed that cells expressing low and high levels of Hes1 differentiated into neural and mesodermal cells, respectively (Kobayashi and Kageyama 2010, 2011).
Hes1 is also known to play a role in somitogenesis, the developmental process responsible for segmentation of the vertebrate embryo. During somitogenesis, a “segmentation clock” controls the timing of the assignment of mesodermal cells to discrete blocks. The segmentation clock depends on the oscillatory expression of a complex network of signalling pathways, including the Hes1 GRN which contains a negative feedback loop. This feedback loop is formed through interactions of the dimerised Hes1 protein with its own gene—Hes1 protein binds to N box sequences on the hes1 promoter and represses the transcription of hes1 mRNA.
Mathematical models of oscillatory dynamics in the Hes1 GRN have taken a variety of forms. The first attempt to model this pathway was presented in the experimental paper Hirata et al. (2002), where an ODE model was used. However, in order to reproduce the observed oscillations, a third unknown species was introduced. At about the same time, it was discovered that introducing delays to ODE models of gene regulatory networks could produce sustained oscillatory dynamics in the numerical solution (Tiana et al. 2002). Jensen et al. (2003) found that invoking an unknown species could be avoided by introducing delay terms to a model of the Hes1 GRN (representing the processes of transcription and translation). A delay differential equation (DDE) model of the Hes1 GRN was also studied in Monk (2003). The effect of low particle numbers in a similar DDE model of the Hes1 GRN was explored in Barrio et al. (2006). Here, the stochastic simulation algorithm (SSA) was extended to allow for delays. Zeiser et al. (2007) found that there is not much evidence for synergistic binding in the regulatory region of Hes1, and gave an estimate for the Hill coefficient. The details of the Hes1 pathway were scrutinised in greater depth in Momiji and Monk (2008), again using a delay differential equation system. In particular, an investigation into the effects of dimerisation and compartmentalisation was presented. The role of Gro/TLE1 was considered in Bernard et al. (2006). Other models have examined the role of the Hes1 GRN in somitogenesis (Agrawal et al. 2009). Spatio-temporal models of the Hes1 negative feedback loop were presented in Sturrock et al. (2011), using a partial differential equation model while extensions of this were considered in Sturrock et al. (2012). A spatial stochastic model of the Hes1 GRN in embryonic stem cells was studied in Sturrock et al. (2013).
3 The Reaction Diffusion Master Equation
The mathematical framework we use is a stochastic continuous time discrete space Markov process description of the dynamics of the biochemical reaction network. The state of the system is described by the random vector X(t) whose components {X1(t), …, XN(t)} describe the total copy number of each species j = 1, …, N. The stochastic process {Xt}t≥0 is a collection of such random variables indexed by time, and describes the time evolution of the system. The chemical species take part in M chemical reactions in the well-stirred reaction volume Ω. The state changes at random times τr according to chemical reactions. We denote a realisation of the stochastic process by with components xj. Reaction r then changes the state according to x′ = x(t+τr) = x(t)+nr where the stoichiometry vector nr defines the change in copy number of the reactants and products of the reaction. Each reaction is associated with a propensity function, ωr (x) that describes the rate of the reaction. It is interpreted as the probability that the reaction occurs in an infinitesimal time interval [t, t +dt]
| (1) |
Depending on the particular description of the chemical reaction, ωr will take different functional forms. As an example, consider a small system with species A, B, and C and a reaction pair describing the reversible binding between A and B forming the complex C.
| (2) |
Assuming mass action kinetics the propensity function for reaction one is ω1 = k1ab and that for reaction two is ω2 = k2c where lower case letters denote molecular copy numbers of the respective chemical species. The stoichiometry vectors are in this case n1 = [−1, −1, 1] and n2 =−n1.
The Markov process has the important memoryless property, i.e. given the state of the system at time t, the state at any future time depends only on the current state and not on anything that happened at a time s before t, s < t. As a consequence, the time to the occurrence of reaction r is an exponentially distributed random variable τr ~ exp(1/ωr (x)).
As a direct consequence of the Markov property the probability density function of the system is governed by the forward Kolmogorov equation, or the chemical master equation (CME). For brevity of notation, in the following we will write p(x, t) = p(x, t | x0, t0) for the probability that the system can be found in state x at time t conditioned on the initial condition x0 at time t0. The CME then takes the form
| (3) |
The above formulation describes a well-stirred system where it is assumed that mixing due to molecular movement has time to homogenise the spatial distribution between reactive encounters. Stochastically correct realisations of the processes can be generated by the stochastic simulation algorithm (SSA) (Gillespie 1976) or one of the many optimised, versions of this algorithm.
In this paper we are interested in a scenario where the reaction volume cannot be assumed to be well-mixed, in fact, the spatial distribution of Hes1 protein and hes1 mRNA throughout the cell and their transport between different parts of the cell plays a crucial role in establishing the oscillatory dynamics of the network. To explicitly account for spatial effects, the Markov model can be extended to account for diffusion and active transport. To introduce molecular movement due to diffusion we discretise space and divide the domain Ω into K non-overlapping voxels, or subvolumes, 𝒱i. For an example of such a discretisation, see Fig. 3. A system with N chemical species can now be described by the K × N matrix of random variables X(t). Again, denote a realisation of the system by . The entries of the row xi· in the matrix are the copy numbers of species j = 1, …, N in voxel i. Chemical reactions occur within the voxels by treating them as in the spatially homogenous case. In other words, we assume that inside any voxel in the mesh, the assumption of a well-stirred system holds so that molecules are effectively uniformly distributed in the individual voxels. For example, a bimolecular reaction r involving species Xj and Xj′ in voxel i can in this setting be written
| (4) |
The propensity function depends only on the copy number of the species in voxel i so that reactions are completely local. In general, the propensity can take different forms in different voxels. This will be the case if the rate constants vary in space, or more commonly, if a reaction is only active in parts of the domain. If no molecular motion occurs, the master equation for the full system will be
| (5) |
where μir is the 1 × N stoichiometry vector for reaction r in voxel i. For the case of one subvolume, K = 1, (5) reduces to the CME (3).
Fig. 3.
The 3D meshed domain approximation of a eukaryotic cell used in numerical simulations of the Hes1 model. The domain is discretised such that 8,867 voxels make up the domain. The cytoplasm is represented by a long ellipsoid, centre (0, 0), with major axis equal to 18.20 µm and minor axes equal to 6.00 µm and 3.00 µm. The nucleus is shown here as a blue ellipsoid, centre (0, 0), major axis 6 µm and minor axes equal to 4 µm and 2 µm. The cytoplasm (shown in green) is the part of the cell that is outside the nucleus. The gene subdomain is chosen to be the voxel closest to the centre of the cell (0, 0), a distance r from the nuclear membrane (Color figure online)
The diffusive motion of molecules from one voxel to an adjacent one is modelled by linear jump events
| (6) |
with propensity function a(xi·) = dijkxij. It takes a species j in voxel i to one of the immediate neighbours 𝒱k. The transition can be written . The K × 1 stoichiometry vector νijk acts on the column x·j and has all components zero except for νijk(i) = −1 and νijk(k) = 1.
For the case of molecular transport only, the master equation takes the form
| (7) |
For a system with both reactions and diffusion, the full reaction–diffusion master equation (RDME) is simply given by
| (8) |
Stochastic realisations of the RDME can be generated by versions of SSA optimised for reaction–diffusion systems, such as the next sub-volume method (NSM) (Elf and Ehrenberg 2004). In the NSM, reaction and diffusion events are grouped in each of the voxels, and to sample the next event that occurs in the system, the next voxel, or sub-volume, in which an event occurs is first sampled. Knowing the voxel, one next samples if the event is a reaction or diffusion event, and then finally, one samples which particular reaction or diffusion direction that fires. The NSM adapts ideas from the next reaction method (Gibson and Bruck 2000) to make the complexity of the step in which the next voxel is sampled logarithmic in the number of voxels in the mesh.
3.1 Unstructured Meshes
To generate realisations from the RDME we have used URDME (Drawert et al. 2012). URDME is a flexible software framework for stochastic simulation of reaction–diffusion processes, specialising in the use of unstructured, triangular and tetrahedral meshes to resolve realistic geometries. For a uniform Cartesian mesh, where the voxels are cubes with equal side length h, the rate constants dijk are given by D/h2. For unstructured meshes, the corresponding jump rate constants will vary depending on the size and shape of the voxels, for a detailed description of the theory for how to obtain correct rates, see Engblom et al. (2009). In short, the value of the propensity function for an event in the Markov model corresponds to the inverse of the expected time for that event to occur. In other words, the value 1/(dijkxij) is the expected time for the first species of type Xj to leave voxel 𝒱i and become well-mixed in voxel 𝒱k. A reasonable requirement on the rate constants dijk, irrespective of the mesh, is that they are chosen in such a way that the concentration process converges to the diffusion equation in the thermodynamic limit. This can be ensured by taking dijk corresponding to a numerical discretisation of the Laplace operator. The version of URDME we use in this study uses a finite element discretisation for this purpose. For a detailed discussion on the theory underlying the simulations in URDME, see Drawert et al. (2012) and Engblom et al. (2009).
4 A Spatial Stochastic Model of the Hes1 GRN with Cytoplasmic Dimerisation (Model A)
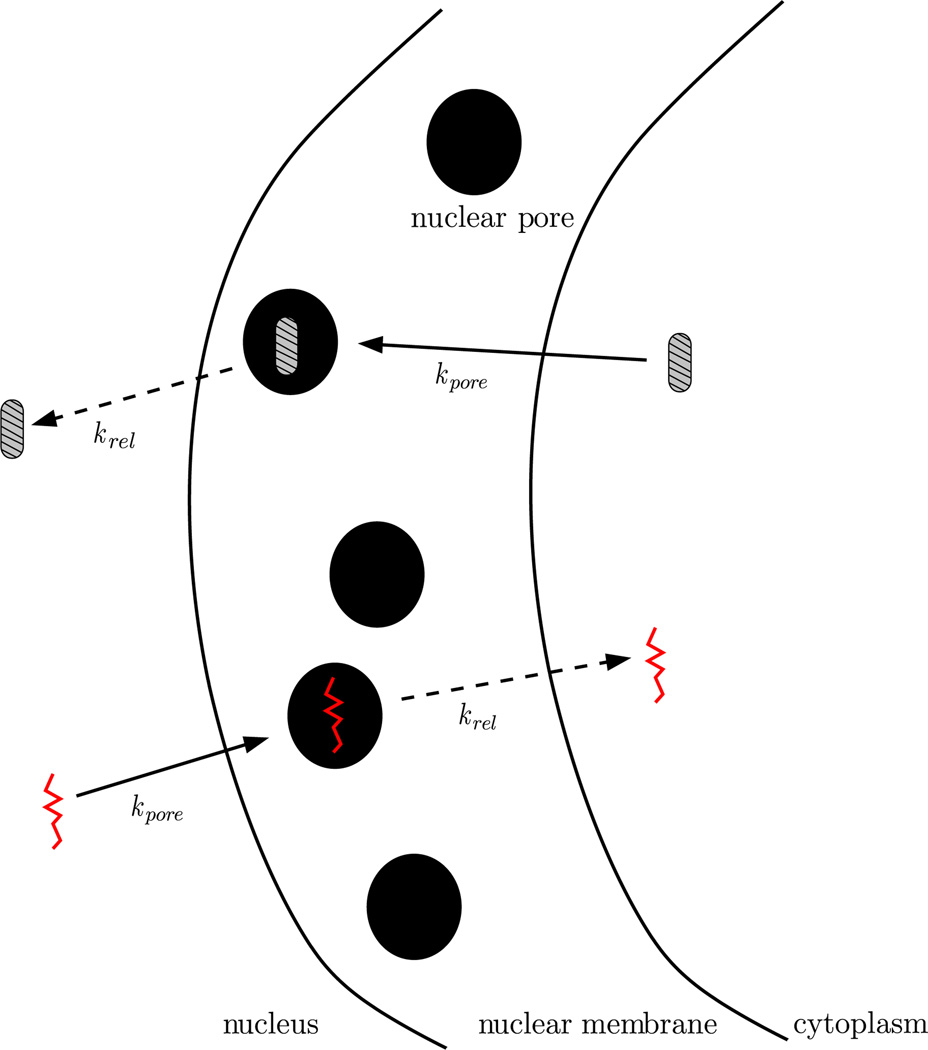
We assume that the molecular reactions in the Hes1 GRN follow previous modelling efforts of Momiji and Monk (2008). Figure 1 shows a schematic description of the network. Reaction arrows are coloured such that different colours correspond to reactions occurring in different cellular compartments. Red arrows correspond to reactions occurring at the promoter site of the cell, while green reaction arrows correspond to reactions occurring in the cytoplasm, and black arrows correspond to those occurring everywhere in the cell. We model all reactions by elementary mass action kinetics. As in Sturrock et al. (2013), we do not employ a phenomenological Hill function approximation for Hes1 binding to the promoter. Since our model is explicitly spatial, such an approach is neither appropriate nor necessary. We model nuclear transport as depicted schematically in Fig. 2. Nuclear pore complexes (NPCs) determine where species move in and out of the nucleus and how quickly they do so. The inclusion of nuclear transport has been attempted before in a spatial deterministic model (Cangiani and Natalini 2010), but here, we can go a step further. Exploiting the discrete spatial nature of our model, we explicitly model the NPCs on the nuclear membrane. In our model, an mRNA molecule travels through the nuclear membrane by first binding to a NPC (at a rate kpore). Once bound to a pore, the mRNA molecule shuttles through the pore and exits the nucleus (at a rate krel). Protein molecules shuttle into the nucleus in a similar manner. As a first approximation, we simplify nuclear transport by omitting the ran-cycle, which has been the study of numerous deterministic modelling efforts, see Cangiani and Natalini (2010) and references therein. We assume that both hes1 mRNA and Hes1 protein can diffuse as described above, with diffusion coefficient D = 1 × 10⁻¹¹ m2 min−1 (which is in line with available experimental data (Klonis et al. 2002)). We do not allow promoter species to diffuse, rather we assume the promoter species remain in the gene subdomain. A complete list of reactions, their localisation, a description, and initial parameter values used (with references where available) are found in Table 1. We denote hes1 mRNA by mRNA, Hes1 monomer by monomer, Hes1 dimer by dimer, a free promoter by Pf and an occupied promoter by Po.
Fig. 2.
Simplified model of unidirectional nuclear transport of mRNA (red) and protein (grey) between nucleus and cytoplasm. An mRNA or protein molecule travels through the nuclear membrane by first binding to a NPC at a rate kpore. Once bound to a pore, the mRNA or protein molecule shuttles through the pore and exits the nucleus or cytoplasm at a rate krel (Color figure online)
Table 1.
Reactions in model A of the Hes1 GRN, their localisation, description and baseline parameter values used
| Reaction | Localisation | Description | Parameter values | |
|---|---|---|---|---|
| Gene | Promoter occupation | k1 = 1.00 × 10⁹ M−1 min−1 (Tafvizi et al. 2011) | ||
| Gene | Promoter liberation | k2 = 0.10 min−1 (estimate) | ||
| Gene | mRNA transcription | αm = 3.00 min−1 (Barrio et al. 2006) | ||
| Gene | mRNA transcription (reduced) | αm = 3.00 min−1, γ = 100.00 (Barrio et al. 2006; Takebayashi et al. 1994) | ||
| Cytoplasm | Protein translation | αp = 1.00 min−1 (Barrio et al. 2006) | ||
| Cytoplasm | mRNA degradation | μm = 0.031 min−1 (Hirata et al. 2002) | ||
| Nucleus | mRNA degradation | μm = 0.031 min−1 (Hirata et al. 2002) | ||
| Cytoplasm | Monomer degradation | μp = 0.108 min−1 (Momiji and Monk 2008) | ||
| Cytoplasm | Dimer degradation | μp = 0.108 min−1, ζ = 3.00 (Hirata et al. 2002; Momiji and Monk 2008) | ||
| Nucleus | Dimer degradation | μp = 0.108 min−1, ζ = 3.00 (Hirata et al. 2002; Momiji and Monk 2008) | ||
| Cytoplasm | Monomer dimerisation | β1 = 1.00 × 10⁹ M−1 min−1 (estimate) | ||
| Cytoplasm | Dimer detachment | β2 = 0.10 min−1 (estimate) | ||
| Nuclear membrane | mRNA binding to nuclear pore | kpore = 1.00 × 10⁹ M−1 min−1 (estimate) | ||
| Nuclear membrane | Release of mRNA to cytoplasm | krel = 6.00 × 10³ min−1 (estimate) | ||
| Nuclear membrane | Dimer binding to nuclear pore | kpore = 1.0.0 × 109 M−1 min−1 (estimate) | ||
| Nuclear membrane | Release of dimer to nucleus | krel = 6.00 × 10³ min−1 (estimate) |
4.1 Domain, Initial and Boundary Conditions
The computational domain approximating a eukaryotic cell is shown in Fig. 3. The cell is represented by two ellipsoids with centre (0, 0). The ellipsoid representing the cytoplasm has a major axis of 18.20 µm and minor axes equal to 6.00 µm and 3.00 µm. The nucleus is represented by another ellipsoid with major axis of 6 µm and minor axes of 4 µm and 2 µm. These values are chosen to be consistent with experimental measurements of eukaryotic cells, specifically fibroblast cells (Demirel et al. 2006). The promoter site, or gene subdomain, is taken to be a single voxel at a radial distance r from the nuclear membrane. Unless otherwise stated, we choose the promoter site to be at r = 3 µm, i.e. the voxel closest to the centre of the cell (0, 0). We arbitrarily choose initial conditions such that 60 Hes1 proteins are uniformly distributed in the cytoplasmic subdomain, 10 mRNA molecules in the nuclear subdomain, and a single free promoter is found in the gene subdomain. We uniformly distribute 2,000 nuclear pores around the nuclear membrane (Banerjee et al. 2010). Zero-flux boundary conditions are applied at the cell membrane. The nuclear membrane is treated as is shown in Fig. 3.
4.2 Computational Simulation Results
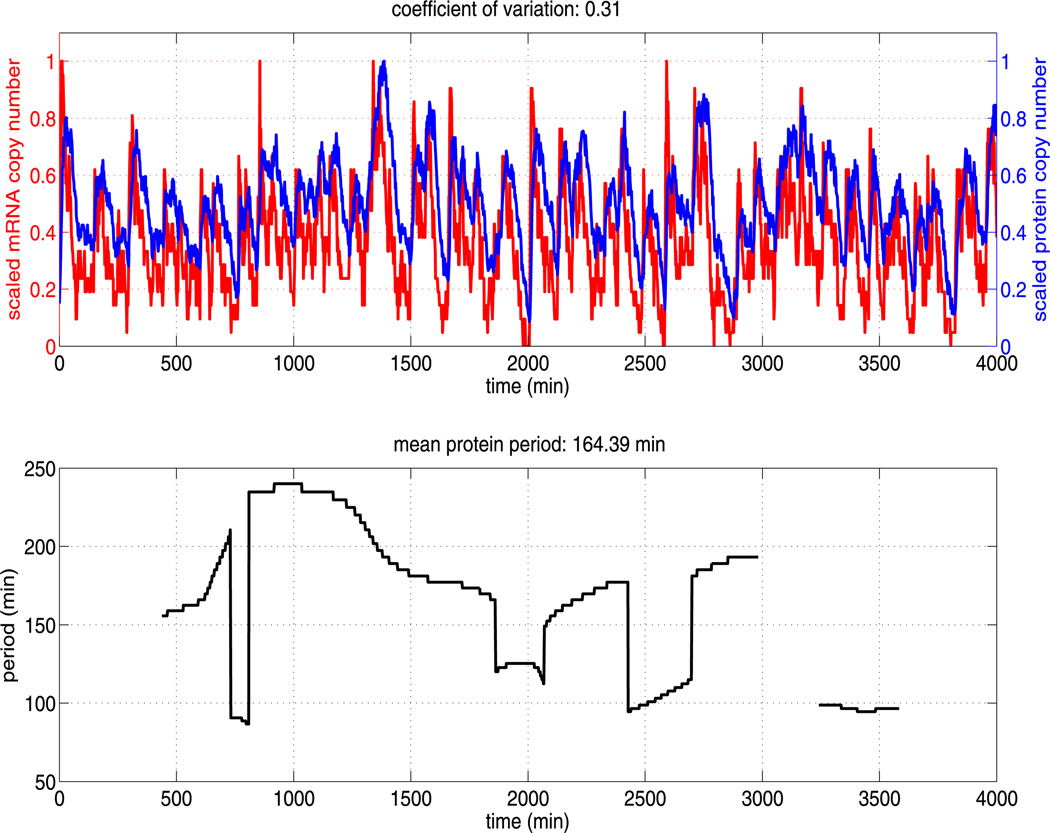
We performed simulations of model A using the baseline kinetic rate parameters as given in Table 1 and the numerical method described in Sect. 3. A sample trajectory is displayed in Fig. 4 (upper figure), along with the corresponding instantaneous period (lower figure). While biologists have only investigated the evolution of hes1 mRNA and Hes1 protein levels in cells for 2160 minutes after serum stimulation (Masamizu et al. 2006), we have monitored levels for longer (up to 4,000 minutes). We find the numerical solution exhibits a range of distinct transient periodic behaviours, with instantaneous periods ranging from roughly 80 minutes to 250 minutes. Overall, the mean period is approximately 164 minutes for this particular trajectory (as stated in the title of the lower plot). This is consistent with Hes1 oscillations observed in certain cell types, in particular presomitic mesoderm cells (Masamizu et al. 2006) and neural progenitors (Shimojo et al. 2008). We find the oscillatory dynamics to be highly variable in both period and amplitude. We also include the coefficient of variation (CV) for the protein levels in the title of the upper figure. We do this in an effort to quantify the variability in protein level expression. The CV is a widely used measure of protein variability (Chalancon et al. 2012).
Fig. 4.
The upper plot shows the (scaled) total copy number of mRNA and protein (monomer and dimer) for a single trajectory of the Hes1 model (see Table 1 for parameter values). The mRNA and protein oscillations have approximately the same scaled amplitude and highly variable period. The lower plot shows the corresponding time varying period of Hes1 protein as estimated by the continuous time wavelet transform (as implemented in WAVOS). As can be seen, the period is highly variable over time and an accurate estimate of the mean period requires long sampling times
The instantaneous period presented in the lower figure of Fig. 4 is estimated using a Morlet continuous time wavelet transform (CWT) as implemented in WAVOS (see Harang et al. 2012 for details). Given the highly oscillatory and noisy nature of our trajectories, the use of standard Fourier techniques can lead to inaccurate estimates of the period, as Fourier analysis assumes stationarity of the signal and its basis functions are unbounded in time (Mallat 1999).Wavelets, in contrast, are localised in both time and frequency. This localises the analysis, allowing the changes in signal properties to be tracked over time (Torrence and Compo 1998). Furthermore, we make use of Gaussian edge elimination to minimise artefacts in the approximation of the period.
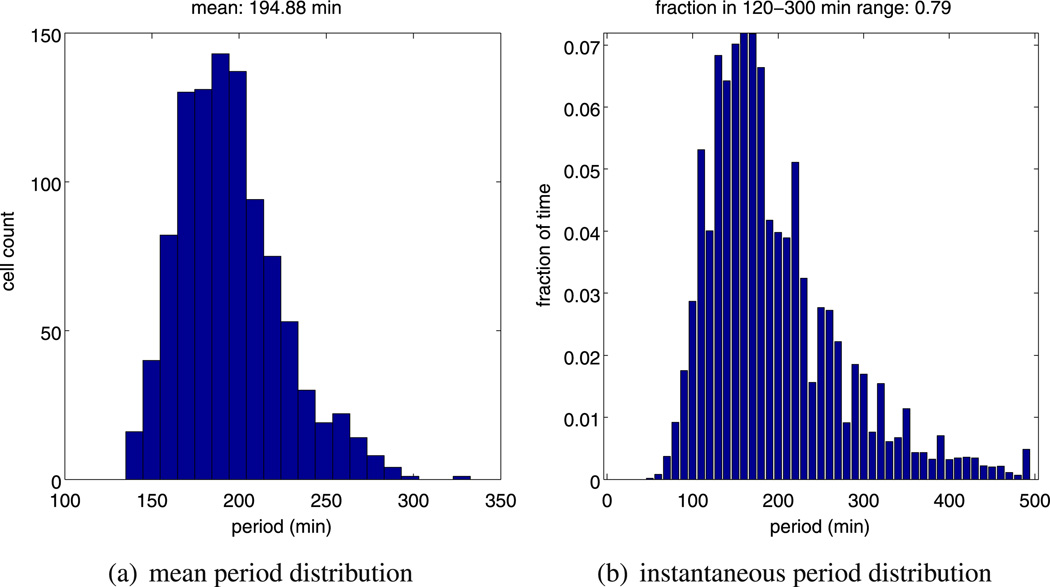
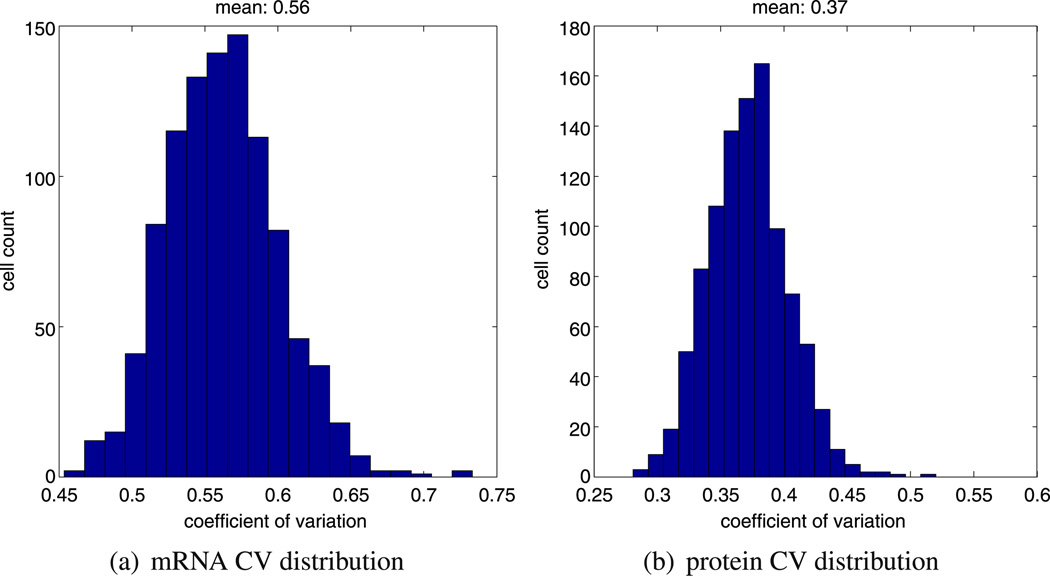
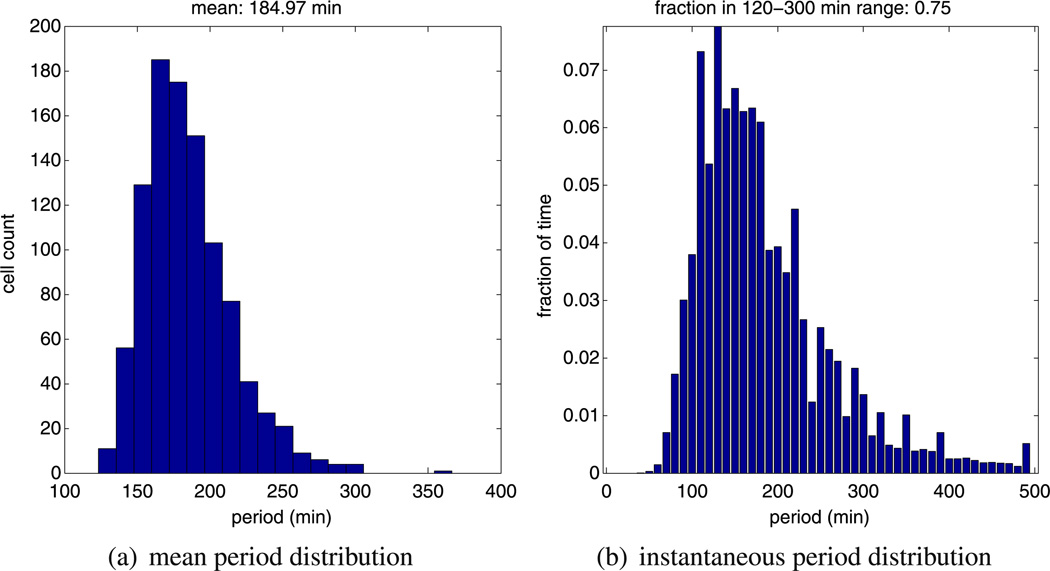
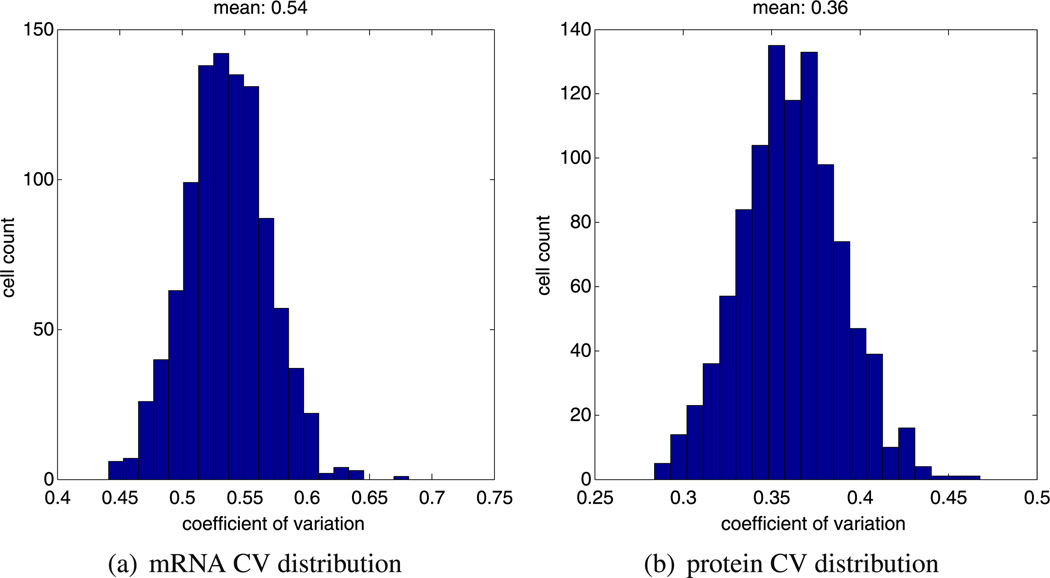
As noted previously in Sect. 2, Hes1 oscillations are observed in a range of cell types with periods of oscillation ranging from 120–300 minutes. Due to the highly variable and transient period, simply computing the mean period of an individual time series such as that in Fig. 5a yields an incomplete picture of the oscillatory dynamic. We generated ensembles of 1,000 independent realisations of the model starting with the same parameters. Biologically, this can be interpreted as considering a population of 1000 different, non-interacting cells. Based on this ensemble, we computed the distribution of the mean periods as well as the distribution of the instantaneous periods (see Fig. 5a) as measured by WAVOS. Inspecting Fig. 5a, we can see that almost all of our calculated periods lie within the biologically feasible 120–300 minutes range. However, in Fig. 5b, we can observe some instantaneous periods of up to 500 minutes. In Fig. 6, we plot the computed CV for hes1 mRNA and Hes1 protein for 1,000 independent realisations of our model. These results show that the CV for mRNA is comparatively higher than the CV for the proteins, in line with the results of Singh et al. (2012). This is unsurprising given the relatively low abundance of mRNA compared to protein.
Fig. 5.
Plots showing, (a) a histogram of the mean period distribution, and, (b) a histogram of the instantaneous period distribution for Hes1 protein numbers. These histograms were generated from ensembles of 1000 independent realisations of model A using the same parameters (as stated in Table 1)
Fig. 6.
Plots showing, (a) a histogram of the mRNA CV distribution, and, (b) a histogram of the protein CV distribution. Both histograms were generated from 1000 independent realisations of model A using the same parameters (as stated in Table 1)
4.3 Parameter Sensitivity Analysis: Nuclear Transport and Dimerisation
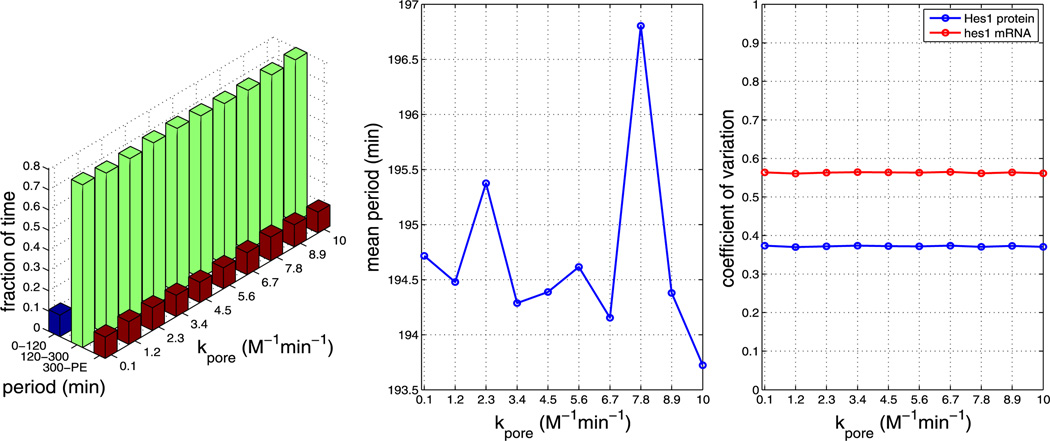
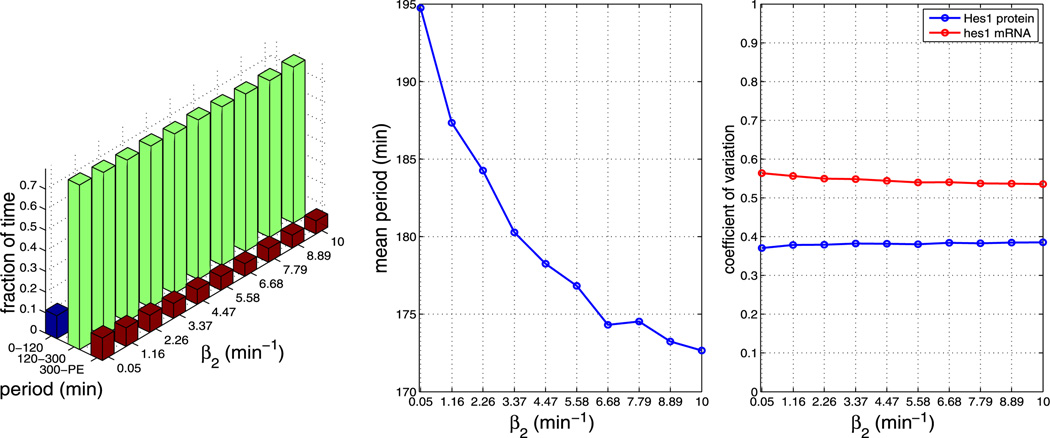
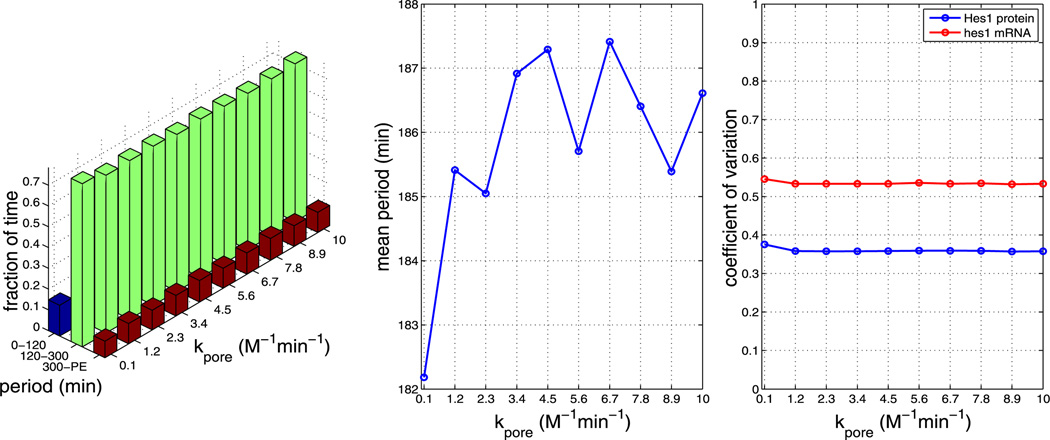
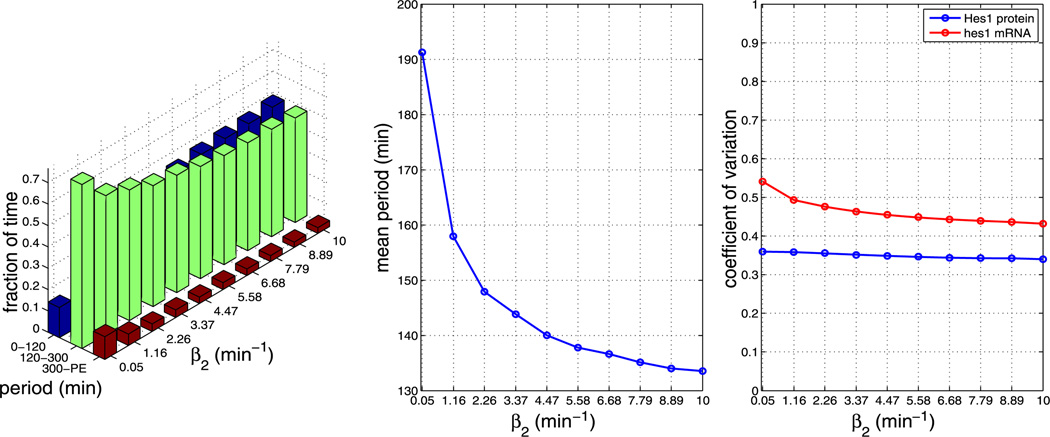
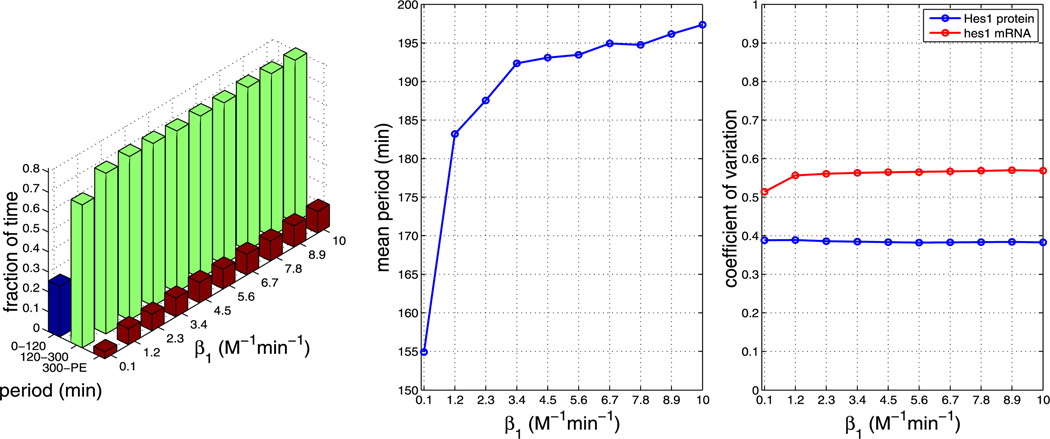
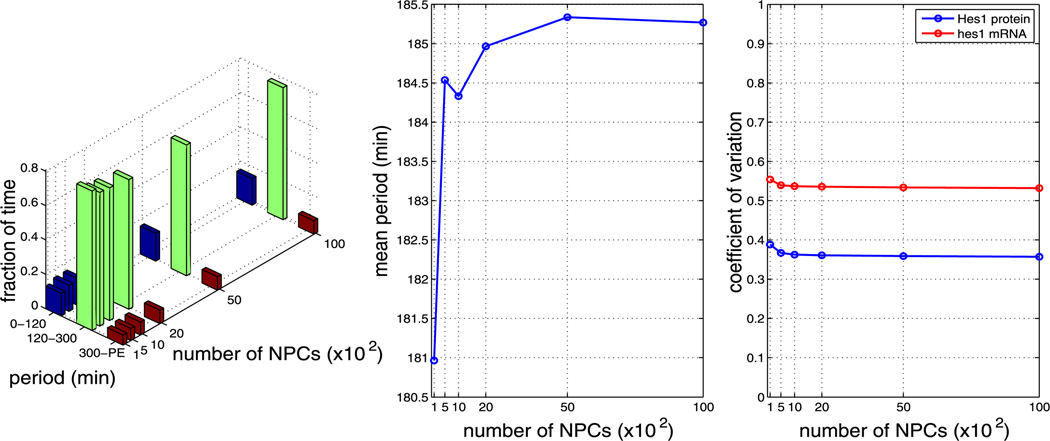
In the baseline simulations presented in Sect. 4.2, we chose kinetic rate parameters more or less arbitrarily to lie in the range of biophysically plausible values. Since these parameters are not determined experimentally for the Hes1 GRN, we explored the response of our model to variations in the key nuclear import and dimerisation rate parameters. For each parameter value, we generate 1,000 independent realisations. We note that using certain parameter sets causes our model to yield periods that are unrealistically long (>400 minutes) or simply fail to oscillate with non-negligible amplitude. We label these trajectories as cells exhibiting ‘persistent expression’ (PE) of Hes1. Plots containing our parameter sensitivity results for model A can be found in the Appendix. The left plots in Figs. 13–17 show the fraction of time the system spends oscillating with a period in the ranges 0–120 minutes, 120–300 minutes, and 300–PE. These fractions are computed in a similar manner to Fig. 5b, but were divided into bins chosen to reflect period ranges shorter than, in agreement with and larger than the mean periods observed experimentally in various cell types. The middle plots show the average period over the whole ensemble and the right plots show the coefficients of variation of Hes1 protein and hes1 mRNA. The data required for each figure takes approximately 3–5 hours to generate on a cluster using 200 cores, depending on parameter values.
Fig. 13.
Plots showing the effect of varying parameter kpore (all other parameters as per Table 1). The left plot shows the fraction of time the system spends oscillating with a period in the range 0–120 minutes, 120–300 minutes and 300–PE as kpore is varied. The middle plot shows how the mean period varies as kpore is varied. The right plot shows how the CV varies for mRNA and protein as kpore is varied. As can be seen from each plot, varying kpore has little effect on the system (Color figure online)
Fig. 17.
Plots showing the effect of varying parameter β2 (all other parameters as per Table 1). The left plot shows the fraction of time the system spends oscillating with a period in the range 0–120 minutes, 120–300 minutes and 300–PE as β2 is varied. The middle plot shows how the mean period varies as β2 is varied. The right plot shows how the CV varies for mRNA and protein as β2 is varied. As can be seen from the plots, varying β2 has an impact on the mean period. The plots reveal that increasing β2 decreases the mean period (Color figure online)
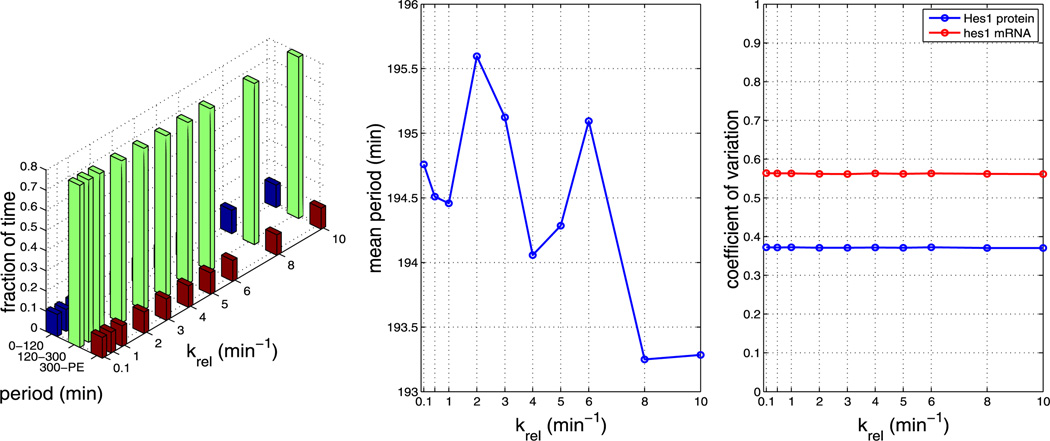
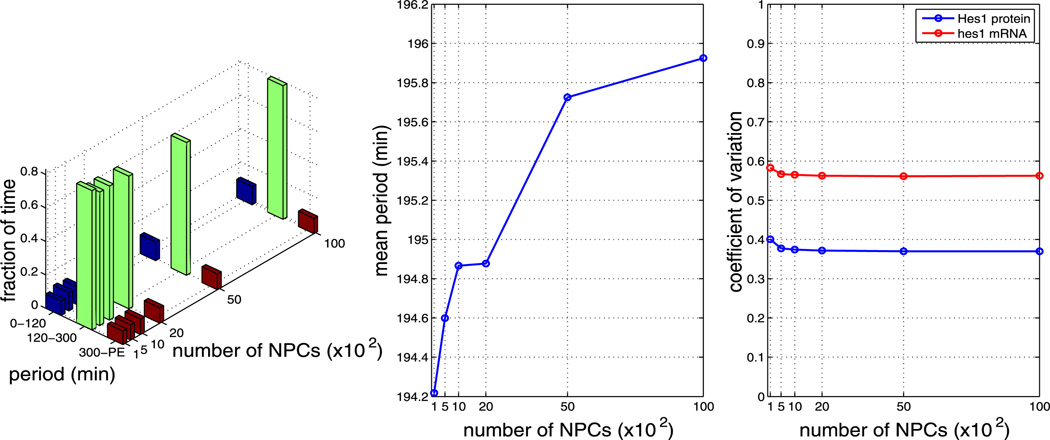
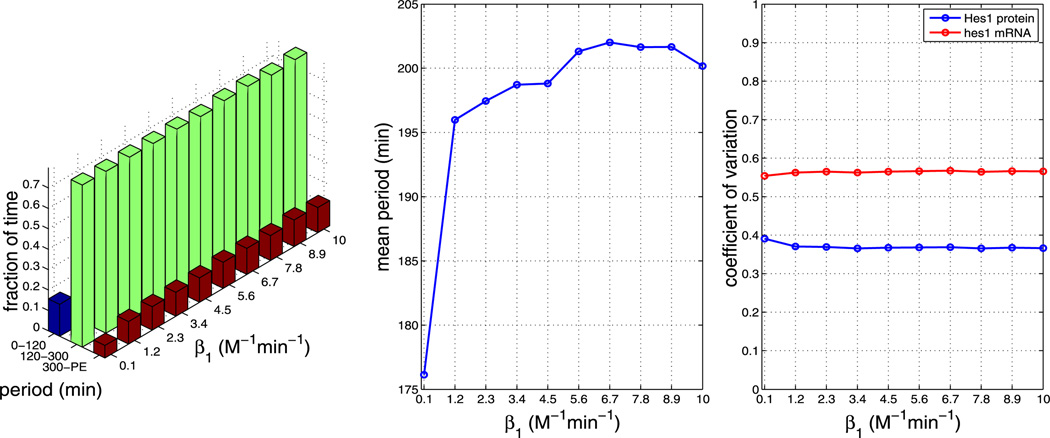
We find that, for all other parameters as in Table 1, the model is robust to changes in the pore binding rate (kpore), the number of NPCs and the NPC import rate (krel), i.e. the nuclear transport parameters. However, the mean period is sensitive to changes in the dimerisation parameters β1 and β2.
5 A Spatial Stochastic Model of the Hes1 GRN with Dimerisation Throughout the Cell (Model B)
In this section, we present an alternative Hes1 GRN model (which we refer to as ‘model B’). The motivation for this second model comes from the lack of knowledge regarding the localisation of the Hes1 dimerisation reaction. In general, there are cases where proteins are dimerised in the nucleus (Aranda and Pascual 2001) and cytoplasm (Herbst et al. 2012). In order to investigate whether or not the localisation of the dimerisation is important for the overall system behaviour, we now allow for the bimolecular dimerisation reaction to occur in both the nucleus and cytoplasm. In addition, we allow for both monomers and dimers to be imported to the nucleus. Finally, we enable dimers to break apart into monomers in the nucleus as well as the cytoplasm. All other modelling assumptions are the same as in Sect. 4 (model A), including the time simulations are performed for, the domain, initial conditions and boundary conditions. In addition, where possible, the same parameter values are used. In essence, we are only varying the model structure. A complete list of reactions, their localisation, a description and initial parameter values used (with references where available) are found in Table 2.
Table 2.
Reactions in model B of the Hes1 GRN, their localisation, description and baseline parameter values used
| Reaction | Localisation | Description | Parameter values | |
|---|---|---|---|---|
| Gene | Promoter occupation | k1 = 1.00 × 10⁹ M−1 min−1 (Tafvizi et al. 2011) | ||
| Gene | Promoter liberation | k2 = 0.10 min−1 (estimate) | ||
| Gene | mRNA transcription | αm = 3.00 min−1 (Barrio et al. 2006) | ||
| Gene | mRNA transcription (reduced) | αm = 3.00 min−1, γ = 100.00 (Barrio et al. 2006; Takebayashi et al. 1994) | ||
| Cytoplasm | Protein translation | αp = 3.00 min−1 (Barrio et al. 2006) | ||
| Cytoplasm | mRNA degradation | μm = 0.031 min−1 (Hirata et al. 2002) | ||
| Nucleus | mRNA degradation | μm = 0.031 min−1 (Hirata et al. 2002) | ||
| Cytoplasm | Monomer degradation | μp = 0.108 min−1 (Momiji and Monk 2008) | ||
| Nucleus | Monomer degradation | μp = 0.108 min−1 (Momiji and Monk 2008) | ||
| Cytoplasm | Dimer degradation | μp = 0.108 min−1, ζ = 3.00 (Hirata et al. 2002; Momiji and Monk 2008) | ||
| Nucleus | Dimer degradation | μp = 0.108 min−1, ζ = 3.00 (Hirata et al. 2002; Momiji and Monk 2008) | ||
| Cytoplasm | Monomer dimerisation | β1 = 1.00 × 10⁹ M−1 min−1 (estimate) | ||
| Cytoplasm | Monomer dimerisation | β1 = 1.00 × 10⁹ M−1 min−1 (estimate) | ||
| Cytoplasm | Dimer detachment | β2 = 0.10 min−1 (estimate) | ||
| Nuclear membrane | mRNA binding to nuclear pore | kpore = 1.00 × 10⁹ M−1 min−1 (estimate) | ||
| Nuclear membrane | Release of mRNA to cytoplasm | krel = 6.00 × 10³ min−1 (estimate) | ||
| Nuclear membrane | Monomer binding to nuclear pore | kpore = 1.00 × 10⁹ M−1 min−1 (estimate) | ||
| Nuclear membrane | Release of monomer to nucleus | krel = 6.00 × 10³ min−1 (estimate) | ||
| Nuclear membrane | Dimer binding to nuclear pore | kpore = 1.00 × 10⁹ M−1 min−1 (estimate) | ||
| Nuclear membrane | Release of dimer to nucleus | krel = 6.00 × 10³ min (estimate) |
5.1 Computational Simulation Results
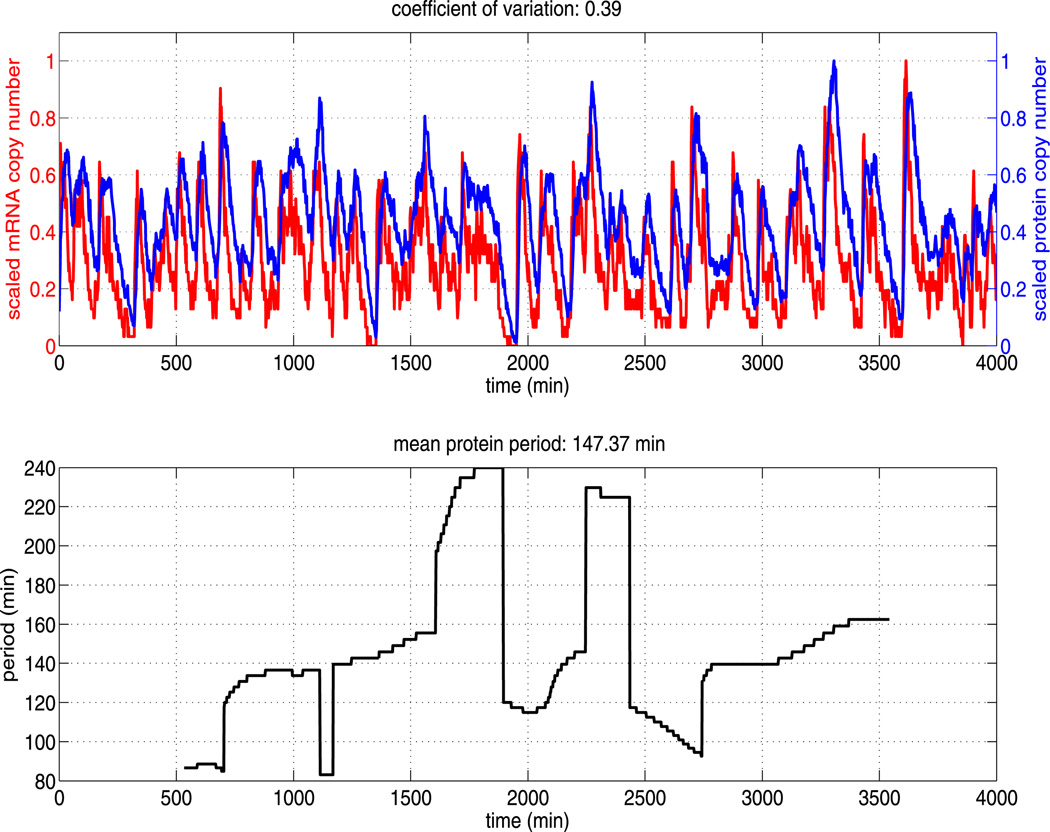
We performed simulations of our alternative Hes1 GRN model using the baseline kinetic rate parameters as given in Table 2 and the numerical method described in Sect. 3. A sample trajectory is displayed in Fig. 7 (upper figure), along with the corresponding instantaneous period (lower figure). As in Sect. 4.2, we compute trajectories for a time period of 4,000 minutes. In agreement with numerical simulations of model A, we find different transient periodic behaviour emerging in numerical solutions of model B, with instantaneous periods ranging from roughly 80 minutes to 240 minutes. The two models are in qualitative agreement but there are some quantitative differences between their numerical solutions. The mean period of our sample trajectory of model B is shorter than that produced by model A (147 minutes as opposed to 164 minutes) and the coefficient of variation is slightly higher (0.39 as opposed to 0.31).
Fig. 7.
The upper plot shows the (scaled) total copy number of mRNA and protein (monomer and dimer) for a single trajectory of the Hes1 model (see Table 2 for parameter values). The mRNA and protein oscillations have approximately the same scaled amplitude and highly variable period. The lower plot shows the time varying period as estimated by the continuous time wavelet transform (as implemented in WAVOS). As can be seen, the period is highly variable over time and an accurate estimate of the mean period requires long sampling times
Our alternative model also yields oscillatory periods in line with experimental evidence. This is clear from Figs. 8 and 9 where we plot the mean period distribution and instantaneous period distribution of 1,000 realisations of model B. Examining Fig. 8a, we can see that almost all the calculated periods lie within the biologically feasible 120–300 minutes range. Hence, we can say that the mean period distribution of model B is in approximate close agreement with model A (compare Figs. 8a and 5a). The instantaneous period distribution generated for model B also approximately agrees with the one generated by model A (compare Figs. 8b and 5b). In Fig. 9, we plot the computed CV for hes1 mRNA and Hes1 protein for 1,000 independent realisations of our model. These results are in good agreement with the CV results for model B, and we note that the CV for mRNA is once again higher than the CV for proteins.
Fig. 8.
Plots showing, (a) a histogram of the mean period distribution, and, (b) a histogram of the instantaneous period distribution for Hes1 protein numbers. These histograms were generated from ensembles of 1000 independent realisations of model B using the same parameters (as stated in Table 2)
Fig. 9.
Plots showing, (a) a histogram of the mRNA CV distribution, and, (b) a histogram of the protein CV distribution. Both histograms were generated from 1000 independent realisations of model B using the same parameters (as stated in Table 2)
5.2 Parameter Sensitivity Analysis: Nuclear Transport and Dimerisation
As we did for model A in Sect. 4.3, we now examine the sensitivity of the nuclear transport and dimerisation parameters for model B. Once again, for each parameter value we generate an ensemble of 1,000 independent realisations. Plots containing our parameter sensitivity results for model B can be found in the Appendix. The left plots in Figs. 18–22 show the fraction of time that the system spends oscillating with a period in the ranges 0–120 minutes, 120–300 minutes, and 300–PE. These fractions are computed in a similar manner to Fig. 8b, but were divided into bins chosen to reflect period ranges shorter than, in agreement with and larger than the mean periods observed experimentally in various cell types. These fractions are computed in a similar manner to Fig. 8b. The middle plots show the average period over the whole ensemble, and the right plots show the coefficients of variation of Hes1 protein and hes1 mRNA. The data required for each figure takes approximately the same amount of time to generate as it did for model A.
Fig. 18.
Plots showing the effect of varying parameter kpore (all other parameters as per Table 1). The left plot shows the fraction of time the system spends oscillating with a period in the range 0–120 minutes, 120–300 minutes and 300–PE as kpore is varied. The middle plot shows how the mean period varies as kpore is varied. The right plot shows how the CV varies for mRNA and protein as kpore is varied. As can be seen from each plot, varying kpore has little effect on the system (Color figure online)
Fig. 22.
Plots showing the effect of varying parameter β2 (all other parameters as per Table 1). The left plot shows the fraction of time the system spends oscillating with a period in the range 0–120 minutes, 120–300 minutes and 300–PE as β2 is varied. The middle plot shows how the mean period varies as β2 is varied. The right plot shows how the CV varies for mRNA and protein as β2 is varied. As can be seen from the plots, varying β2 has a large impact on the mean period. The plots show that increasing β2 decreases the mean period (Color figure online)
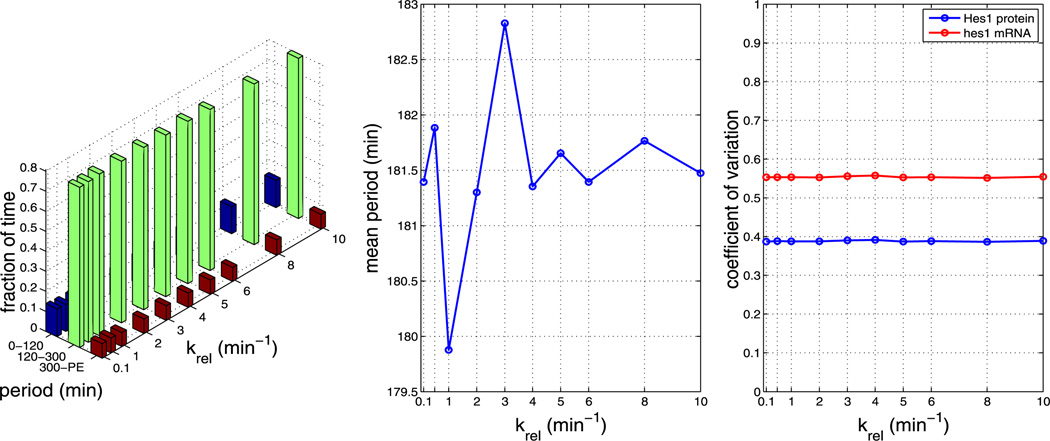
Consistent with findings for model A, we find that, for all other parameters as in Table 2, model B is very robust to changes in the nuclear transport parameters. In model B, the mean period is very sensitive to changes in the dimerisation parameters β1 and β2, even more so than in model A.
6 Dimerisation Only in the Cytoplasm or Dimerisation Throughout the Cell?
In this section, we discuss the ability of our model to make some tentative predictions as to where in the cell dimerisation occurs and how monomers and dimers are transported through the nuclear membrane. It should be noted that performing simulations of model A and model B with equal dimerisation parameters do not result in the same total dimer-to-monomer ratios. In model A, the dimer does not dissociate inside the nucleus, i.e. as soon as a dimer in model A has found a pore and has translocated into the nucleus, it will remain a dimer until it degrades. This effect is not countered by the fact that monomers are less stable than dimers, and model A tends to yield much higher total dimer-to-monomer ratios. The difference becomes more pronounced for smaller β1/β2 ratios. As an example, for the baseline parameter set, model A has a dimer to monomer ratio of about 18 while that of model B is about 15. In contrast, for the largest value of β2 in our parameter sweeps, the corresponding values are 9 and 3, respectively. Also, model B tends to produce realisations with higher total protein copy number.
Based on these simulations alone and on the available experimental observations, we cannot draw any firm conclusions about whether model A or model B is more biologically accurate. We do note, however, that in the baseline parameter set, we have used the experimentally measured hes1 mRNA degradation rate corresponding to fibroblast cells. Hes1 expression level in fibroblasts has been observed experimentally to oscillate predominantly in the 120–180 minutes range. Despite extensive, but not exhaustive searches of parameter space (data not shown), we have not been able to find period distributions that are quantitatively consistent with that period range for parameters that are biologically realistic using model A. Model B, however, can display distributions that are biased toward the 180–300 minutes bin for large values of β1 as well as distributions falling largely in the 120–180 minutes range if the system is biased toward the monomer state. In the case of model A, an experiment where one specifically looked for the presence of monomers in the nucleus could reveal whether the model assumptions are valid since dimers are assumed to be stable in the nucleus, and monomers does not get imported. However, based on our simulations, an indirect way would be to attempt to measure the β1 and/or β2 parameters for Hes1 dimerisation in fibroblast cells. If they agree with the cases in Figs. 21 and 22 where the distributions match the experimental behaviour, it would constitute compelling evidence for model B.
Fig. 21.
Plots showing the effect of varying parameter β1 (all other parameters as per Table 1). The left plot shows the fraction of time the system spends oscillating with a period in the range 0–120 minutes, 120–300 minutes and 300–PE as β1 is varied. The middle plot shows how the mean period varies as β1 is varied. The right plot shows how the CV varies for mRNA and protein as β1 is varied. As can be seen from the plots, varying β1 has a large impact on the mean period. The plots show that increasing β1 increases the mean period (Color figure online)
We want to highlight that in all of our parameter sweeps (for both model A and B) we observe periods that are highly variable with instantaneous period distributions with long tails. In our figures, we chose to divide the instantaneous periods into four bins, 0–120 minutes, 120–300 minutes, and 300–PE to reflect period ranges shorter than, in agreement with and larger than the mean periods observed experimentally in various cell types. In most of the cases we have considered, the system will spend an almost equal amount of time oscillating with instantaneous periods falling in the range 120–300 minutes.
Note that this is a prediction of the spatial stochastic model that cannot be extracted from more common deterministic models based on ordinary differential equations, delay differential equations, or partial differential equations. In the latter cases, the mean period and amplitude and possibly the phase lag between mRNA and protein are the only information that can feasibly be used to discriminate between models. Our simulations suggest that if only few cells and relatively short time courses are observed experimentally, predictions based on the mean period can be misleading. If more extensive experimental information matching the distribution information that we display here were available, we could potentially discern which of our different model scenarios captures the biology more faithfully.
7 Targeted Drug Treatment: Effects of Disrupting Dimerisation
It has been established in recent years that mechanisms leading to Hes1 induction could represent promising targets for cancer therapy (Sang et al. 2010). A potential method for sustaining Hes1 induction is to target the Hes1 dimerisation reaction. By preventing the formation of dimers, Hes1 would not be able to associate with its promoter and inhibit hes1 mRNA production, hence Hes1 protein levels would appear persistently high. This is an especially attractive option as the first Hes1 dimer inhibitors isolated from natural products have now emerged (Arai et al. 2009). Therefore, there is value in studying the effects of disrupting dimerisation in our models.
As we have seen, the two model scenarios behave similarly under a wide range of biophysically plausible values for the dimerisation and nuclear transport parameters under normal cellular conditions. The main qualitative differences we were able to observe were a heightened sensitivity of model B to large dimer dissociation rates and smaller dimerisation association rates, i.e. scenarios that favour the monomer state. We have already seen that with all other parameters as in the baseline set in Tables 1 and 2, greatly reducing the number of available NPCs has a minor effect on the oscillatory dynamics both in the cases of model A and model B. Next, we consider situations where we greatly impair the ability of Hes1 to form dimers. To that end, we will consider two scenarios:
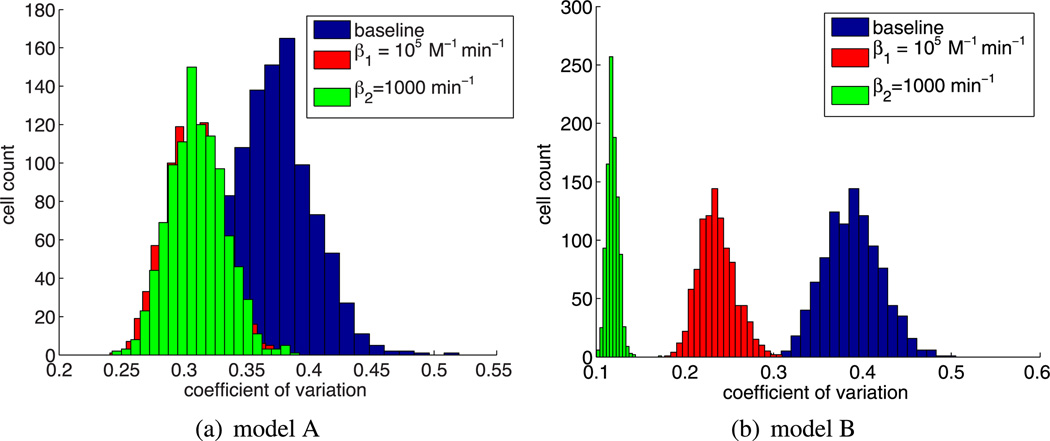
We reduce β1 by a factor of 104, i.e. dimerisation can still occur, but at a very low rate.
We leave β1 unaffected and instead disrupt the stability of the dimer by setting β2 = 1000 min−1. Since the dimers are assumed to be stable in the nucleus in model A, disruption there only affects cytoplasmic Hes1. For model B, disruption occurs everywhere in the cell.
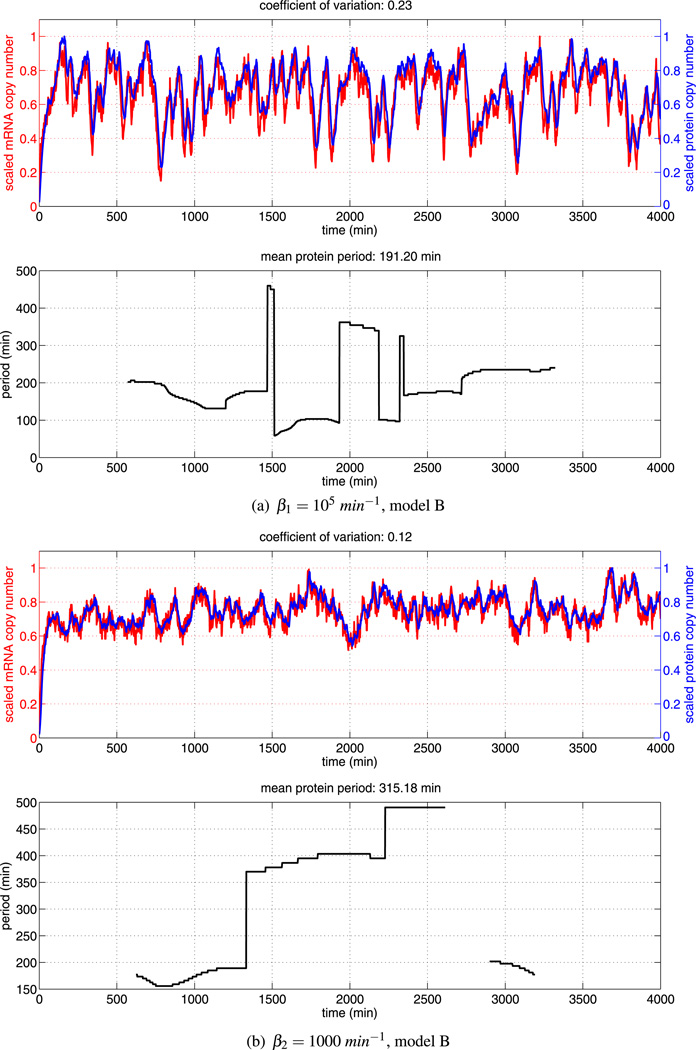
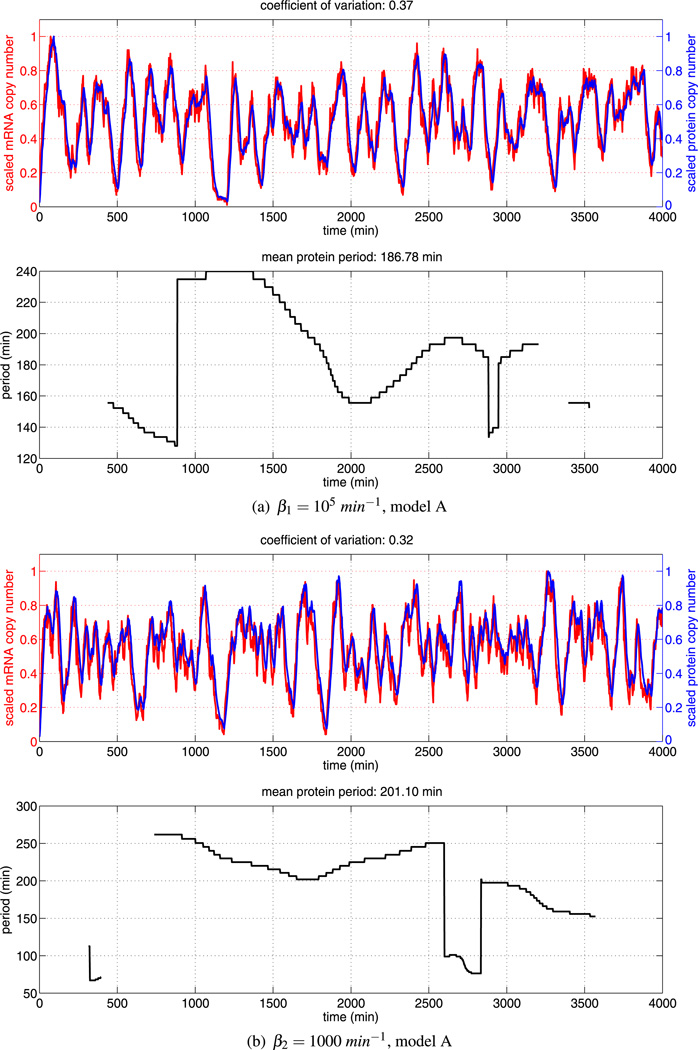
In order to quantify the different responses of model A and model B to the two scenarios, we present distributions of the coefficient of variation of Hes1 protein in Fig. 10. As can be seen from the sample trajectories in Fig. 12, a low coefficient of variation correlates well with sustained and elevated expression of protein and low amplitude oscillations. Our experiments suggest that, while dimer disruption has some effect in model A, it would be much more effective in yielding non-oscillatory trajectories with sustained protein levels in the case of model B (as shown in Figs. 11 and 12).
Fig. 10.
Coefficient of variation distributions for the different dimer disruption model scenarios (as indicated in the legends). While there is an effect on model A, the effect is much greater in model B. Low values of the coefficient of variation correlate with non-oscillatory solutions with sustained high protein levels or oscillations with a very low amplitude (Color figure online)
Fig. 12.
Sample trajectories for the disruption experiments for model B. Impairing dimer formation or dimer stability has a large effect on model B
Fig. 11.
Sample trajectories for the disruption experiments for model A. Impairing dimer formation or dimer stability has little effect on model A
The heightened sensitivity of model B compared to model A to dimer disruption can be understood from the difference in the model structures. For model A, disrupting dimer formation affects only the rate of which Hes1 can enter the nucleus. In the very unlikely event that a dimer does form and finds a pore and translocates, the dimer is stable and can repress transcription. In model B, however, the dimer disruption greatly impairs Hes1 protein’s ability to find and bind to the promoter, since it needs to be in its dimer form to act as a repressor. Hence, we can now add to our discussion in Sect. 6. We have found that the difference between the responses to dimer disruption between the two models is large enough to have the potential to form the basis for an experiment that indirectly discriminates between the two modelling scenarios. As there currently exist Hes1 dimerisation disruption drugs (Arai et al. 2009), an experiment disrupting Hes1 dimerisation in individual cells could be enlightening and validate either model A or model B.
8 Discussion
Hes1 lies at the crossroads of multiple signalling pathways, and is known to play a major role in tumour development. In recent years, it has been established as a promising target for drug treatment (Sang et al. 2010). While some tumours are likely to up-regulate Hes1 through the Notch pathway, the Hedgehog pathway and others, the direct targeting of Hes1 could result in a higher response rate than by targeting pathways in general. In addition, targeting Hes1 itself might result in fewer side effects because the many other genes also regulated by the Notch or Hedgehog pathways would be unaffected. It also offers greater specificity than treatment with HDACIs (histone deacetylase inhibitors), which have widespread effects on acetyl groups, on histones and other non-histone proteins.
As the possible benefits are substantial, it is especially exciting that the first Hes1 dimer inhibitor isolated from natural products was reported recently. Using an assay for Hes1 dimerisation, a natural products library was screened and two compounds that inhibit Hes1-mediated downregulation of gene expression intracellularly were identified (Arai et al. 2009). Of course, the sensitivity and efficacy of these molecules and related small molecules in vivo remains to be determined. Further, reducing Hes1 activity systemically would be expected to affect the physiology of normal cells, especially stem cells, which could result in stem cell depletion, immune dysfunction, and even ageing phenotypes. Thus, the design of a small molecule Hes1 inhibitor represents a promising, but challenging approach to therapy.
Given the importance of understanding the dynamics of Hes1 (in particular, Hes1 dimerisation) for cancer therapies, in this paper we have examined the Hes1 GRN in some detail using two spatial stochastic models. In the first model we presented, we followed previous modelling efforts and allowed only for Hes1 dimerisation in the cytoplasm, as well as only allowing Hes1 dimers to be imported into the nucleus. In the absence of definitive experimental evidence regarding dimerisation, we then formulated a second model in which the Hes1 dimerisation reaction occurred throughout the cell, with both Hes1 monomers and Hes1 dimers being imported to the nucleus. Both models incorporated a novel treatment of nuclear transport where the structure of the nuclear membrane is accounted for explicitly by randomly distributing nuclear pores on the surface of the nuclear-cytoplasmic boundary.
Simulations of our models yielded trajectories that successfully captured the noisy oscillatory response of Hes1 levels found in numerous experimental studies (Hirata et al. 2002; Masamizu et al. 2006; Yoshiura et al. 2007; Kobayashi et al. 2009; Kobayashi and Kageyama 2010, 2011). Both of our models produce variability in period and amplitude of hes1 mRNA and Hes1 protein (monomer and dimer) oscillations. For baseline parameter sets, our models yielded results in close agreement, both in terms of the coefficient of variation and the instantaneous period (calculated using a continuous time wavelet transform).We also performed a parameter sensitivity analysis on the nuclear transport and dimerisation parameters in both our models. We found that our models are robust to changes in nuclear transport parameters, but more sensitive to dimerisation parameters, with model B (dimerisation everywhere) appearing to be more sensitive than model A (cytoplasmic dimerisation).
We suggested both a direct experiment and an indirect measurement that could distinguish which of the two models is more faithful to the underlying biology. It is the hope of the authors that the work presented will encourage experimentalists to investigate the structure of this important GRN in greater depth.
Finally, we considered different methods of disrupting dimerisation in both the models. Namely through inhibiting the formation of dimers (reducing parameter β1) and by disrupting the stability of the dimers (increasing parameter β2). Here, we are able to report non-negligible quantitative differences in how the two models respond. In particular, the coefficient of variation distributions are markedly different for model A and model B. This yields yet another possible method for determining which of our models more accurately captures the Hes1 GRN (see Sect. 7 for details).
One aspect of intracellular dynamics which we have not included in the current model, but which is of relevance to our study, is that of molecular crowding, i.e. volume exclusion events due to other molecules or organelles. Molecular crowding generates an environment where diffusion is hindered by obstacles and traps, resulting in a form of molecular movement called “subdiffusion” (Mendez et al. 2010). More precisely, subdiffusion refers to a form of molecular movement in which the mean-square displacement of a molecule is not linear in time. Molecular crowding has important implications for both nuclear transport events and dimerisation events. In terms of nuclear transport, a recent study demonstrated that first passage times of molecules moving from the nucleus to the cytoplasm (and vice versa) are strongly modulated by molecular crowding (Roussel and Tang 2012). Brownian dynamics studies of dimerisation in a crowded environment have shown that crowding alters the dimerisation parameters and shifts the equilibrium state of the system towards the dimer state rather than the monomer state (Grima 2010). In terms of our models, accounting for molecular crowding may result in enhanced dimerisation, and hence, the associated oscillatory dynamics (particularly in model B as it is sensitive to changes in dimerisation parameters). Another aspect of the present model that may be influenced by macromolecular crowding is our study of drug treatment. The ability of a drug to find the dimers within the cell is strongly dependent on the intracellular environment (crowding would likely inhibit the drug-dimer interaction). In order to account for molecular crowding in mathematical models, numerous different approaches have been taken. In deterministic models, fractional partial differential equations have been employed with success in simplified settings, but have proved challenging in more realistic settings (Yadav et al. 2008). Many authors have taken a spatial stochastic approach to account for macromolecular crowding, and numerical studies have proven more tractable, for example, see Marquez-Lago et al. (2012).
Future work will consider extending the current study in various ways as well as analysing the current model in greater depth. In particular, we will compare and contrast numerical solutions of equivalent deterministic models for models A and B under different parameter sets. This will allow us to better understand the role of intrinsic noise in our models and we may be able to identify certain regions of the parameter space in which noise induces oscillatory dynamics (such as was studied in Scott et al. 2011). We may also modify our approach to account for macromolecular crowding, as discussed in the previous paragraph. In terms of modelling, we plan to investigate nuclear transport in more detail and begin to account for the ran-cycle. Many transcription factors are known to be actively transported toward the nucleus along microtubules (Lomakin and Nadezhdina 2010), therefore, we may account for this in future work. We will also conduct a global sensitivity analysis of our model using data clustering techniques. We may also consider cell–cell communication to see if this acts to stabilise and synchronise oscillatory behaviour as was found in Masamizu et al. (2006). We did not explore the possibility of combination drug therapy, which has been stated as an attractive avenue in controlling Hes1 activation (Sang et al. 2010). Naturally, our approach is readily applicable to many other pathways and we plan to investigate the more complex p53-Mdm2 GRN using a similar approach to the one presented in this paper.
Fig. 14.
Plots showing the effect of varying parameter krel (all other parameters as per Table 1). The left plot shows the fraction of time the system spends oscillating with a period in the range 0–120 minutes, 120–300 minutes and 300–PE as krel is varied. The middle plot shows how the mean period varies as kpore is varied. The right plot shows how the CV varies for mRNA and protein as krel is varied. As can be seen from each plot, varying krel has little effect on the system (Color figure online)
Fig. 15.
Plots showing the effect of varying the number of NPCs (all other parameters as per Table 1). The left plot shows the fraction of time the system spends oscillating with a period in the range 0–120 minutes, 120–300 minutes and 300–PE as the number of NPCs is varied. The middle plot shows how the mean period varies as the number of NPCs is varied. The right plot shows how the CV varies for mRNA and protein as the number of NPCs is varied. As can be seen from each plot, varying the number of NPCs has little effect on the system (Color figure online)
Fig. 16.
Plots showing the effect of varying parameter β1 (all other parameters as per Table 1). The left plot shows the fraction of time the system spends oscillating with a period in the range 0–120 minutes, 120–300 minutes and 300–PE as β1 is varied. The middle plot shows how the mean period varies as β1 is varied. The right plot shows how the CV varies for mRNA and protein as β1 is varied. As can be seen from the plots, varying β1 has an impact on the mean period. The plots reveal that increasing β1 increases the mean period (Color figure online)
Fig. 19.
Plots showing the effect of varying parameter krel (all other parameters as per Table 1). The left plot shows the fraction of time the system spends oscillating with a period in the range 0–120 minutes, 120–300 minutes and 300–PE as krel is varied. The middle plot shows how the mean period varies as krel is varied. The right plot shows how the CV varies for mRNA and protein as krel is varied. As can be seen from each plot, varying krel has little effect on the system (Color figure online)
Fig. 20.
Plots showing the effect of varying the number of NPCs (all other parameters as per Table 1). The left plot shows the fraction of time the system spends oscillating with a period in the range 0–120 minutes, 120–300 minutes and 300–PE as the number of NPCs is varied. The middle plot shows how the mean period varies as the number of NPCs is varied. The right plot shows how the CV varies for mRNA and protein as the number of NPCs is varied. As can be seen from each plot, varying the number of NPCs has little effect on the system (Color figure online)
Acknowledgements
The authors gratefully acknowledge the support of the ERC Advanced Investigator Grant 227619, “M5CGS—From Mutations to Metastases: Multiscale Mathematical Modelling of Cancer Growth and Spread” and of the National Institute of Health under Award Number 1R01EB014877-01. The content is solely the responsibility of the authors and does not necessarily represent the official views of the National Institute of Health. We also acknowledge Brian Drawert for his contributions to the infrastructure facilitating URDME simulations on clusters.
Appendix
Parameter Sensitivity Analysis Figures for Model A See Figs. 13–17.
Parameter Sensitivity Analysis Figures for Model B See Figs. 18–22.
Contributor Information
Marc Sturrock, University of Dundee, Dundee DD1 4HN, UK.
Andreas Hellander, Email: andreash@cs.ucsb.edu, University of California, Santa Barbara, CA 93106, USA.
Sahar Aldakheel, University of Dundee, Dundee DD1 4HN, UK.
Linda Petzold, University of California, Santa Barbara, CA 93106, USA.
Mark A.J. Chaplain, University of Dundee, Dundee DD1 4HN, UK
References
- Agrawal S, Archer C, Schaffer DV. Computational models of the notch network elucidate mechanisms of context-dependent signaling. PLoS Comput. Biol. 2009;5:e1000390. doi: 10.1371/journal.pcbi.1000390. [DOI] [PMC free article] [PubMed] [Google Scholar]
- Arai MA, Masada A, Ohtsuka T, Kageyama R, Ishibashi M. The first hes1 dimer in-hibitors from natural products. Bioorg. Med. Chem. Lett. 2009;19:5778–5781. doi: 10.1016/j.bmcl.2009.07.146. [DOI] [PubMed] [Google Scholar]
- Aranda A, Pascual A. Nuclear hormone receptors and gene expression. Physiol. Rev. 2001;81:1269–1304. doi: 10.1152/physrev.2001.81.3.1269. [DOI] [PubMed] [Google Scholar]
- Banerjee HN, Gibbs J, Jordan T, Blakshear M. Depletion of a single nucleoporin, Nup107, induces apoptosis in eukaryotic cells. Mol. Cell. Biochem. 2010;343:21–25. doi: 10.1007/s11010-010-0494-6. [DOI] [PubMed] [Google Scholar]
- Barik D, Paul MR, Baumann WT, Cao Y, Tyson JJ. Stochastic simulation of enzyme-catalyzed reactions with disparate timescales. Biophys. J. 2008;95:3563–3574. doi: 10.1529/biophysj.108.129155. [DOI] [PMC free article] [PubMed] [Google Scholar]
- Barik D, Baumann WT, Paul MR, Novak B, Tyson JJ. A model of yeast cell-cycle regulation based on multisite phosphorylation. Mol. Syst. Biol. 2010;6:405. doi: 10.1038/msb.2010.55. [DOI] [PMC free article] [PubMed] [Google Scholar]
- Barrio M, Burrage K, Leier A, Tian T. Oscillatory regulation of Hes1: discrete stochastic delay modelling and simulation. PLoS ONE. 2006;2:e117. doi: 10.1371/journal.pcbi.0020117. [DOI] [PMC free article] [PubMed] [Google Scholar]
- Bernard S, Čajavec B, Pujo-Menjouet L, Mackey MC, Herzel H. Modelling transcriptional feedback loops: the role of Gro/TLE1 in Hes1 oscillations. Philos. Trans. R. Soc. A. 2006;364:1155–1170. doi: 10.1098/rsta.2006.1761. [DOI] [PubMed] [Google Scholar]
- Bulcher NE, Gerland U, Hwa T. Nonlinear protein degradation and the function of genetic circuits. Proc. Natl. Acad. Sci. USA. 2005;102:9559–9564. doi: 10.1073/pnas.0409553102. [DOI] [PMC free article] [PubMed] [Google Scholar]
- Burrage K, Burrage PM, Leier A, Marquez-Lago T, Nicolau DV., Jr . Design and analysis of biomolecular circuits: engineering approaches to systems and synthetic biology. New York: Springer; 2011. Stochastic simulation for spatial modelling of dynamic processes in a living cell. [Google Scholar]
- Cangiani A, Natalini R. A spatial model of cellular molecular trafficking including active transport along microtubules. J. Theor. Biol. 2010;267:614–625. doi: 10.1016/j.jtbi.2010.08.017. [DOI] [PubMed] [Google Scholar]
- Chalancon G, Ravarani CNJ, Balaji S, Martinez-Arias A, Aravind L, Jothi R, Babu MM. Interplay between gene expression noise and regulatory network architecture. Trends Genet. 2012;28:221–232. doi: 10.1016/j.tig.2012.01.006. [DOI] [PMC free article] [PubMed] [Google Scholar]
- Demirel MC, So E, Ritty TM, Naidu SH, Lakhtakia A. Fibroblast cell attachment and growth on nanoengineered sculptured thin films. J. Biomed. Mater. Res., Part B, Appl. Biomater. 2006;81:219–223. doi: 10.1002/jbm.b.30656. [DOI] [PubMed] [Google Scholar]
- Drawert B, Engblom S, Hellander A. Urdme: a modular framework for stochastic simulation of reaction-transport processes in complex geometries. BMC Syst. Biol. 2012;6:76. doi: 10.1186/1752-0509-6-76. [DOI] [PMC free article] [PubMed] [Google Scholar]
- Elf J, Ehrenberg M. Spontaneous separation of bi-stable biochemical systems into spatial domains of opposite phases. Syst. Biol. 2004;1(2):230–236. doi: 10.1049/sb:20045021. [DOI] [PubMed] [Google Scholar]
- Engblom S, Ferm L, Hellander A, Lötstedt P. Simulation of stochastic reaction–diffusion processes on unstructured meshes. SIAM J. Sci. Comput. 2009;31(3):1774–1797. [Google Scholar]
- Fange D, Elf J. Noise-induced min phenotypes in E. coli. PLoS Comput. Biol. 2006;2:e80. doi: 10.1371/journal.pcbi.0020080. [DOI] [PMC free article] [PubMed] [Google Scholar]
- Geva-Zatorsky N, Rosenfeld N, Itzkovitz S, Milo R, Sigal A, Dekel E, Yarnitzky T, Liron Y, Polak P, Lahav G, Alon U. Oscillations and variability in the p53 system. Mol. Syst. Biol. 2006;2:E1–E13. doi: 10.1038/msb4100068. [DOI] [PMC free article] [PubMed] [Google Scholar]
- Gibson MA, Bruck J. Efficient exact stochastic simulation of chemical systems with many species and many channels. J. Phys. Chem. 2000;104:1876–1889. [Google Scholar]
- Gillespie DT. A general method for simulating the stochastic time evolution of coupled chemical reactions. J. Comput. Phys. 1976;22:403–434. [Google Scholar]
- Grima R. Intrinsic biochemical noise in crowded intracellular conditions. J. Chem. Phys. 2010;132:185102. [Google Scholar]
- Harang R, Bonnet G, Petzold LR. Wavos: a Matlab toolkit for wavelet analysis and visualization of oscillatory systems. BMC Res. Notes. 2012;26(5):163. doi: 10.1186/1756-0500-5-163. [DOI] [PMC free article] [PubMed] [Google Scholar]
- Herbst KJ, Allen MD, Zhang J. Luminscent kinase activity biosensors based on a versatile bimolecular switch. J. Am. Chem. Soc. 2012;133:5676–5679. doi: 10.1021/ja1117396. [DOI] [PMC free article] [PubMed] [Google Scholar]
- Hirata H, Yoshiura S, Ohtsuka T, Bessho Y, Harada T, Yoshikawa K, Kageyama R. Oscillatory expression of the bHLH factor Hes1 regulated by a negative feedback loop. Science. 2002;298:840–843. doi: 10.1126/science.1074560. [DOI] [PubMed] [Google Scholar]
- Howard M, Rutenberg AD. Pattern formation inside bacteria: fluctuations due to the low copy number of proteins. Phys. Rev. Lett. 2003;90:128102. doi: 10.1103/PhysRevLett.90.128102. [DOI] [PubMed] [Google Scholar]
- Iso T, Sartorelli V, Poizat C, Iezzi S, Wu H-Y, Chung G, Kedes L, Hamamori Y. HERP, a novel heterodimer partner of HES/E(spl) in notch signaling. Mol. Cell. Biol. 2001;21:6080–6089. doi: 10.1128/MCB.21.17.6080-6089.2001. [DOI] [PMC free article] [PubMed] [Google Scholar]
- Jensen MH, Sneppen J, Tiana G. Sustained oscillations and time delays in gene expression of protein hes1. FEBS Lett. 2003;541:176–177. doi: 10.1016/s0014-5793(03)00279-5. [DOI] [PubMed] [Google Scholar]
- Jerke U, Tkachuk S, Kiyan J, Stepanova V, Kusch A, Hinz M, Dietz R, Haller H, Fuhrman B, Dumler I. Stat1 nuclear translocation by nucleolin upon monocyte differentiation. PLoS ONE. 2009;4:e8302. doi: 10.1371/journal.pone.0008302. [DOI] [PMC free article] [PubMed] [Google Scholar]
- Kagemyama R, Ohtsuka T, Kobayashi T. The hes1 gene family: repressors and oscillators that orchestrate embryogenesis. Development. 2007;134:1243–1251. doi: 10.1242/dev.000786. [DOI] [PubMed] [Google Scholar]
- Kau TR, Way JC, Silver PA. Nuclear transport and cancer: from mechanism to intervention. Nature. 2004;4:106–117. doi: 10.1038/nrc1274. [DOI] [PubMed] [Google Scholar]
- Kim IS, Kim DH, Han SM, Chin MU, Nam HJ, Cho HP, Choi SY, Song BJ, Kim ER, Bae YS, Moon YH. Truncated form of importin alpha identified in breast cancer cells inhibits nuclear import of p53. J. Biol. Chem. 2000;275:23139–23145. doi: 10.1074/jbc.M909256199. [DOI] [PubMed] [Google Scholar]
- Klonis N, Rug M, Harper I, Wickham M, Cowman A, Tilley L. Fluorescence photo-bleaching analysis for the study of cellular dynamics. Eur. Biophys. J. 2002;31:36–51. doi: 10.1007/s00249-001-0202-2. [DOI] [PubMed] [Google Scholar]
- Kobayashi T, Kageyama R. Hes1 regulates embryonic stem cell differentiation by suppressing notch signaling. Genes Cells. 2010;15:689–698. doi: 10.1111/j.1365-2443.2010.01413.x. [DOI] [PMC free article] [PubMed] [Google Scholar]
- Kobayashi T, Kageyama R. Hes1 oscillations contribute to heterogeneous differentiation responses in embryonic stem cells. Genes. 2011;2:219–228. doi: 10.3390/genes2010219. [DOI] [PMC free article] [PubMed] [Google Scholar]
- Kobayashi T, Mizuno H, Imayoshi I, Furusawa C, Shirahige K, Kageyama R. The cyclic gene hes1 contributes to diverse differentiation responses of embryonic stem cells. Genes Dev. 2009;23:1870–1875. doi: 10.1101/gad.1823109. [DOI] [PMC free article] [PubMed] [Google Scholar]
- Lidke DS, Huang F, Post JN, Rieger B, Wilsbacher J, Thomas JL, Pouysségur J, Jovin TM, Lenormand P. ERK nuclear translocation is dimerization-independent but controller by the rate of phosphorylation. J. Biol. Chem. 2010;285:3092–3102. doi: 10.1074/jbc.M109.064972. [DOI] [PMC free article] [PubMed] [Google Scholar]
- Lomakin A, Nadezhdina E. Dynamics of nonmembranous cell components: role of active transport along microtubules. Biochemistry. 2010;75:7–18. doi: 10.1134/s0006297910010025. [DOI] [PubMed] [Google Scholar]
- Mallat SA. A wavelet tour of signal processing. New York: Academic Press; 1999. [Google Scholar]
- Marquez-Lago TT, Leier A, Burrage K. Anomalous diffusion and multifractional Brownian motion: simulating molecular crowding and physical obstacles in systems biology. IET Syst. Biol. 2012;6:134–142. doi: 10.1049/iet-syb.2011.0049. [DOI] [PubMed] [Google Scholar]
- Masamizu Y, Ohtsuka T, Takashima Y, Nagahara H, Takenaka Y, Yoshikawa K, Okamura H, Kageyama R. Real-time imaging of the somite segmentation clock: revelation of unstable oscillators in the individual presomitic mesoderm cells. Proc. Natl. Acad. Sci. USA. 2006;103:1313–1318. doi: 10.1073/pnas.0508658103. [DOI] [PMC free article] [PubMed] [Google Scholar]
- Mendez V, Fedotov S, Horsthemke W. Reaction-transport systems. New York: Springer; 2010. [Google Scholar]
- Momiji H, Monk NAM. Dissecting the dynamics of the Hes1 genetic oscillator. J. Theor. Biol. 2008;254:784–798. doi: 10.1016/j.jtbi.2008.07.013. [DOI] [PubMed] [Google Scholar]
- Monk NAM. Oscillatory expression of Hes1, p53, and NF-κB driven by transcriptional time delays. Curr. Biol. 2003;13:1409–1413. doi: 10.1016/s0960-9822(03)00494-9. [DOI] [PubMed] [Google Scholar]
- Nelson DE, Ihekwaba AEC, Elliott M, Johnson JR, Gibney CA, Foreman BE, Nelson G, See V, Horton CA, Spiller DG, Edwards SW, McDowell HP, Unitt JF, Sullivan E, Grimley R, Benson N, Broomhead D, Kell DB, White MRH. Oscillations in NF-κB signaling control the dynamics of gene expression. Science. 2004;306:704–708. doi: 10.1126/science.1099962. [DOI] [PubMed] [Google Scholar]
- Nicholls CD, McLure KG, Shields MA, Lee PWK. Biogenesis of p53 involves co-translational dimerisation of monomers and posttranslational dimerization of dimers. J. Biol. Chem. 2002;277:12937–12945. doi: 10.1074/jbc.M108815200. [DOI] [PubMed] [Google Scholar]
- Oeckinghaus A, Ghosh S. The NF-κB family of transcription factors and its regulation. Cold Spring Harb. Perspect. Biol. 2009;9:402–412. doi: 10.1101/cshperspect.a000034. [DOI] [PMC free article] [PubMed] [Google Scholar]
- Roussel MR, Tang T. Simulation of mRNA diffusion in the nuclear environment. IET Syst. Biol. 2012;6:125–133. doi: 10.1049/iet-syb.2011.0032. [DOI] [PubMed] [Google Scholar]
- Sang L, Coller HA, Roberts JM. Control of the reversibility of cellular quiescence by the transcriptional repressor HES1. Science. 2008;321:1095–1100. doi: 10.1126/science.1155998. [DOI] [PMC free article] [PubMed] [Google Scholar]
- Sang L, Roberts JM, Coller HA. Hijacking HES1: tumors co-opt the anti-differentiation strategies of queiscent cells. Trends Mol. Med. 2010;16:17–26. doi: 10.1016/j.molmed.2009.11.001. [DOI] [PMC free article] [PubMed] [Google Scholar]
- Scott M, Poulin FJ, Tang H. Approximating intrinsic noise in continuous multispecies models. Proc. R. Soc. A. 2011;467:718–737. [Google Scholar]
- Shahrezaei V, Swain PS. The stochastic nature of biochemical networks. Curr. Opin. Biotechnol. 2008;19:369–374. doi: 10.1016/j.copbio.2008.06.011. [DOI] [PubMed] [Google Scholar]
- Shankaran H, Ippolito DL, Chrisler WB, Resat H, Bollinger N, Opresko LK, Wiley HS. Rapid and sustained nuclear–cytoplasmic ERK oscillations induced by epidermal growth factor. Mol. Syst. Biol. 2009;5:332. doi: 10.1038/msb.2009.90. [DOI] [PMC free article] [PubMed] [Google Scholar]
- Shimojo H, Ohtsuka T, Kageyama R. Oscillations in notch signaling regulate maintenance of neural progenitors. Neuron. 2008;58:52–64. doi: 10.1016/j.neuron.2008.02.014. [DOI] [PubMed] [Google Scholar]
- Singh A, Razooky BS, Dar RD, Weinberger LS. Dynamics of protein noise can distinguish between alternate sources of gene-expression variability. Mol. Syst. Biol. 2012;8:1–9. doi: 10.1038/msb.2012.38. [DOI] [PMC free article] [PubMed] [Google Scholar]
- Sturrock M, Terry AJ, Xirodimas DP, Thompson AM, Chaplain MAJ. Spatiotemporal modelling of the Hes1 and p53-Mdm2 intracellular signalling pathways. J. Theor. Biol. 2011;273:15–31. doi: 10.1016/j.jtbi.2010.12.016. [DOI] [PubMed] [Google Scholar]
- Sturrock M, Terry AJ, Xirodimas DP, Thompson AM, Chaplain MAJ. Influence of the nuclear membrane, active transport and cell shape on the Hes1 and p53–Mdm2 pathways: insights from spatio-temporal modelling. Bull. Math. Biol. 2012;74:1531–1579. doi: 10.1007/s11538-012-9725-1. [DOI] [PubMed] [Google Scholar]
- Sturrock M, Hellander A, Matzavinos A, Chaplain MAJ. Spatial stochastic modelling of the hes1 gene regulatory network: intrinsic noise can explain heterogeneity in embryonic stem cell differentiation. J. R. Soc. Interface. 2013;10(80):20120988. doi: 10.1098/rsif.2012.0988. [DOI] [PMC free article] [PubMed] [Google Scholar]
- Tafvizi A, Mirny LA, Oijen AMV. Dancing on DNA: kinetic aspects of search processes on DNA. Chem. Phys. Chem. 2011;12:1481–1489. doi: 10.1002/cphc.201100112. [DOI] [PMC free article] [PubMed] [Google Scholar]
- Takahashi K, Tănase-Nicola S, ten Wolde PR. Spatio-temporal correlations can drastically change the response of a MAPK pathway. Proc. Natl. Acad. Sci. USA. 2010;107:2473–2478. doi: 10.1073/pnas.0906885107. [DOI] [PMC free article] [PubMed] [Google Scholar]
- Takebayashi K, Sasai Y, Sakai Y, Watanabe T, Nakanishi S, Kageyama R. Structure, chromosomal locus, and promoter analysis of the gene encoding the mouse helix-loop-helix factor HES-1. J. Biol. Chem. 1994;269:5150–5156. [PubMed] [Google Scholar]
- Tiana G, Jensen MH, Sneppen K. Time delay as a key to apoptosis induction in the p53 network. Eur. Phys. J. B. 2002;29:135–140. [Google Scholar]
- Torrence C, Compo GP. A practical guide to wavelet analysis. Bull. Am. Meteorol. Soc. 1998;79:61–78. [Google Scholar]
- van Zon JS, Morelli MJ, Tănase-Nicola S, ten Wolde PR. Diffusion of transcription factors can drastically enhance the noise in gene expression. Biophys. J. 2006;91:4350–4367. doi: 10.1529/biophysj.106.086157. [DOI] [PMC free article] [PubMed] [Google Scholar]
- Wilkinson D. Stochastic modelling for quantitative description of heterogeneous biological systems. Nat. Rev. Genet. 2009;10:122–133. doi: 10.1038/nrg2509. [DOI] [PubMed] [Google Scholar]
- Yadav A, Milu SM, Horsthemke W. Turing instability in reaction–subdiffusion systems. Phys. Rev. E. 2008;78:026116. doi: 10.1103/PhysRevE.78.026116. [DOI] [PubMed] [Google Scholar]
- Yoshiura S, Ohtsuka T, Takenaka Y, Nagahara H, Yoshikawa K, Kageyama R. Ultradian oscillations of Stat, Smad, and Hes1 expression in response to serum. Proc. Natl. Acad. Sci. USA. 2007;104:11292–11297. doi: 10.1073/pnas.0701837104. [DOI] [PMC free article] [PubMed] [Google Scholar]
- Zeiser S, Muller J, Liebscher V. Modeling the Hes1 oscillator. J. Comput. Biol. 2007;14:984–1000. doi: 10.1089/cmb.2007.0029. [DOI] [PubMed] [Google Scholar]


