INTRODUCTION
Proton CT (pCT) has been identified as a potential solution for the range uncertainty problem of proton (or heavy ion) radiation therapy. In recent years, and with limited funding, a pCT scanner system suitable for head-size phantoms was developed (see report by Hurley et al. in these proceedings [1]. The concepts for this system were borrowed from High Energy Physics. This system, although suitable for the evaluation of this new imaging modality and its potential clinical advantages, is too slow for clinical application, both with respect to the data acquisition speed and the speed of image reconstruction.
In 2011, a collaboration of the Department of Radiation Medicine at Loma Linda University Medical Center, the Santa Cruz Institute of Particle Physics at UC Santa Cruz, and the Department of Computer Science and Engineering at California State University San Bernardino received funding from the NIH for a 4-year project to further develop pCT by building a new pCT scanner system (phase 2) that will be suitable for clinical applications.
This report summarizes the design concepts for the new pCT system that will be evaluated within this project.
DESIGN CONCEPTS
Overview
The current Phase 1 pCT head scanner is not optimized for the high proton data rates that are required for clinical operation. This is related to limitations of the data readout of the Phase 1 data acquisition system and the rate limitations of the CsI energy detector. Another limitation is the relatively long image reconstruction time on conventional computing hardware. A third limitation of the Phase 1 scanner is its sensitive area of 9 cm × 18 cm, which is only suitable for phantoms up to the size of a pediatric head (Fig. 1).
Fig. 1.
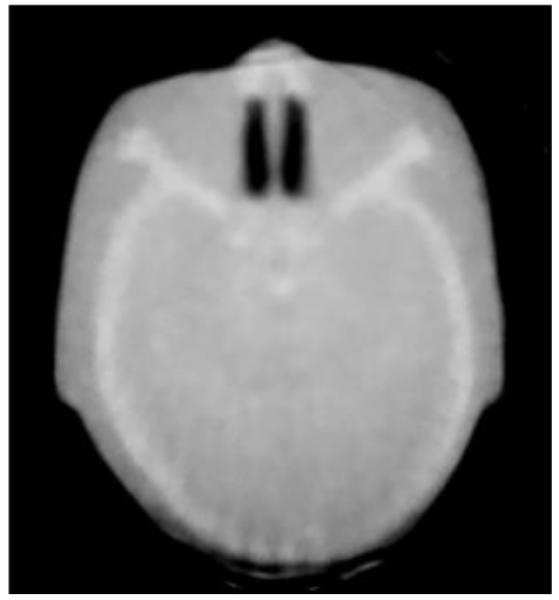
Example of a pediatric head phantom scan obtained with the Phase 1 pCT scanner. Note that due to the limited size of the Phase 1 tracking system the lower (posterior) part of the phantom was not completely captured, leading to reconstruction artifacts.
The planned Phase 2 scanner addresses all of these limitations. We will construct a large-area detector for the clinical pCT scanning with data acquisition rates increased by at least a factor 10 from current rates to a sustained rate of about 2MHz. The Phase 2 system follows the same concept as the first prototype pCT scanner.
The general scheme is illustrated in Fig. 2. The sensitive area of the tracking system and energy detector is still 9 cm in longitudinal direction but is increased from currently 18 cm to 36 cm in the other direction, allowing much larger objects and body regions to be scanned.
Fig. 2.
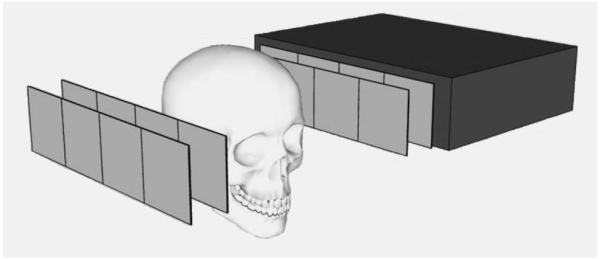
Schematic of the Phase 2 pCT scanner. The proton beam enters from the left. Protons are tracked by the segmented silicon strip detectors and then stopped in the residual energy detector or a range counter.
Tracking System
The Phase 2 tracking system will be constructed as x-y planes of silicon strip detectors (SSD). This guarantees that the most likely path (MLP) of each proton within the phantom/patient can be determined with sub-millimeter accuracy. The procedure of the MLP estimation [2] has been verified by us in a proton beam test using the silicon detector technology [3]. Silicon sensors are a good choice as a tracker material: they are readily available from industrial suppliers, relatively thin (0.2-0.4 mm), without need for consumables like gases, and relatively fast so that the aim of the investigation to sustain a proton acquisition rate of 2 MHz can be satisfied.
The size of silicon strip detectors is limited by the size of high-resistive wafers, which have a maximum size of 15 cm diameter. Larger area than 10 cm × 10cm can be constructed by tiling several SSD together. This is shown in Fig. 3.
Fig. 3.
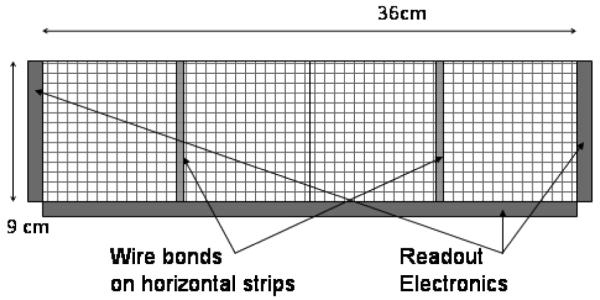
Layout of one of the four x-y tracker planes using 9 cm × 9 cm single-sided silicon detectors with one side rotated by 90 degrees. Of the four sensors with horizontal strips, two pairs have their strips wire-bonded together and are read out separately on the right and left side. The sensors with vertical strips are read out individually on the bottom.
A characteristic feature of the Phase 1 system that needs improvement is the insensitive area around the edges of each SSD. This edge of typically 1 mm width guarantees a very low leakage current and efficient detection of charged particles in the active area. But when used in large-scale imaging like the Phase 1 scanner, the dead areas have caused artifacts in the reconstructed images.
Overlapping of the sensors to avoid the dead areas, as done in the Phase 1 pCT scanner, has led to complications in the reconstruction process, as it is impossible to know with certainty whether the proton path intersected the overlap region and to correct for the additional energy loss. We have addressed this problem with the development of a method eliminating a large part of the dead area by scribing and cleaving the sensor edge and passivating it with a thin layer deposition in a process called Plasma Enhanced Chemically Vapor Deposition (PECVD) [4]. This process creates a charge layer at the interface to the silicon detector, thus reducing the leakage current and preserving the efficiency of the particle detection. Fig. 4 shows a “slim” edge on a p-on-n silicon strip sensor.
Fig. 4.
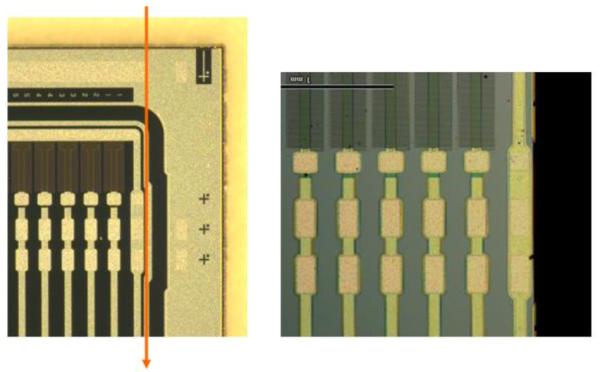
SSD with a “slim” edge of less than 250 μm on a p-on-n sensor with 228 μm pitch. The corner of a sensor manufactured by Hamamatsu Photonics for the GLAST mission is shown on the left with the planned cut indicated by the red line. The sensor was etch-scribed with XeF2, cleaved and passivated with nitrogen-PECVD. The slim edge with strips and bias ring is shown on the right; only traces of the guard ring are visible.
It has been demonstrated that the dark current is acceptable even after even after the guard ring is cut. We have not seen any reduction in particle detection efficiency after such treatment. Simulations with Geant4 have shown that the non-active gap of about 0.5 mm will not cause artifacts.
Tracker Data Acquisition Concept
The data acquisition begins in the front-end ASIC, where the amplifier signals are digitized by discriminators, stored in a FIFO while awaiting a trigger, and then processed into a list of clusters when a trigger is received. Up to four events are buffered in the ASIC in order to minimize dead time by producing a uniform output data flow from the stochastic triggers and input data. Data from 12 chips flow in parallel to an FPGA, which needs sufficient memory buffers and processing power to rearrange the parallel input streams into a single output serial stream. This has already been demonstrated to work in computer simulations using Verilog HDL descriptions of the ASICs and the FPGA. The data reduction takes advantage of the sparse data expected in the detector. A proton normally leaves only a single cluster in each layer, and the electronic noise rate will be negligible.
Figure 5 shows the FPGA-based data acquisition concept. Twelve FPGAs are needed to acquire the data from the 144 front-end chips. Twelve serial lines then carry the data from those FPGAs to the event builder, which sits on the computer PCI bus. The tracker data for a single proton will consist of about 350 bits. The high speed of the PCI bus allows complete events to flow into the computer’s memory at the desired rate of at least a million protons per second.
Fig. 5.
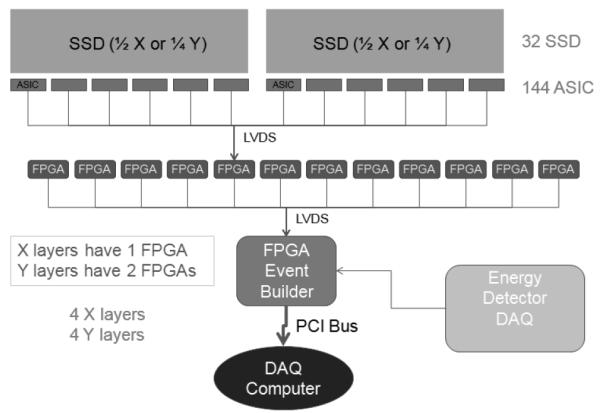
Schematic outlining the concept for the data acquisition system of the Phase 2 tracking.
Energy Detector versus Range Counter
The accuracy of the reconstructed stopping power values in a pCT images depends mostly on the resolution of the measurement of water-equivalent path length (WEPL) of individual protons. The WEPL of a proton can be derived either directly by measuring the residual WEPL with a range counter or indirectly from an energy-dependent detector (calorimeter) response. For the Phase 2 clinical pCT scanner, we are evaluating the feasibility of several different types of range or energy detectors for this measurement.
One concept is a range counter, consisting of a stack of thin plastic scintillators, which are read out by wave-length shifting (WLS) optical fibers collecting the scintillation and directing it silicon photomultipliers (SiPMs). The last (most downstream) tile determines the residual water-equivalent range of each proton and, since its initial range is known, the WEPL can be derived. Efficient SiPMs have been developed in recent years and are available commercially. This range detector concept is currently being evaluated by our colleagues in the Department of Physics at Northern Illinois University in collaboration with Fermi National Accelerator Laboratory. Another option, which is currently being evaluated by us, is a direct readout of the scintillators tiles with 3×3mm2 SiPMs. Potential limitations of this design are SiPM noise and temperature sensitivity.
In order to investigate the resolution of a range counter, a Geant4 simulation was performed using polystyrene tiles of varying thickness between 1 and 6 mm. The main limiting factor for a range counter resolution is range straggling both in the phantom and the counter itself. Since the total path length does not depend on the phantom thickness, the range straggling should be constant and about 1% of the maximum range, e.g. 2.6 mm for protons of 200 MeV initial energy. Fig. 6 shows the WEPL resolution of the simulated range counter as a function of tile thickness.
Fig. 6.
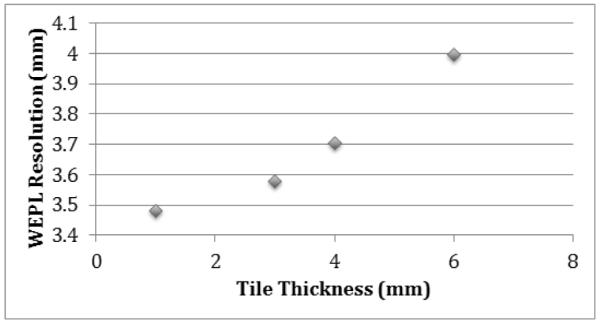
WEPL resolution as a function of tile thickness, derived from a Geant4 simulation with plates of varying thickness and protons of 200 MeV energy. The midplane of the most distal plate in which the energy deposited was larger than a given noise threshold was assumed to be the stopping point of each proton.
The second design currently being evaluated in our lab, is the multi-stage energy detector, shown schematically in Figure 7.
Fig. 7.
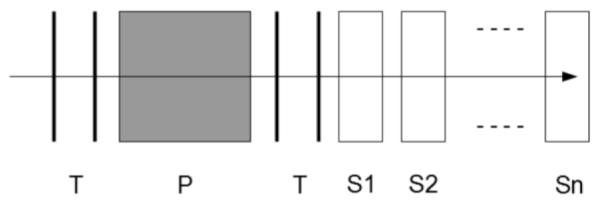
Schematic drawing of a proton CT system with a multi-stage energy detector. T is the proton tracker, P is the phantom or patient, and Sn are the stages of the energy detectors. The energy-dependent response of the most distal stage is calibrated against water-equivalent thickness of the phantom
The multi-stage scintillator design is in essence a hybrid between a range counter and a calorimeter. In a range counter, the WEPL measurement comes from the determination of the depth at which the proton stopped inside the range counter. In a calorimeter, the WEPL measurement is derived from the response of the calorimeter in proportion to the amount of energy deposited by the proton, with the proton stopping entirely within the calorimeter. The multi-stage energy detector, on the other hand, gives information about the energy deposited and the range, by looking at the last stage in which energy was deposited and how much energy was deposited in that stage. The response of each can be calibrated against the water-equivalent thickness of the phantom. First measurements and analytical and Geant4 simulations demonstrate that the WEPL resolution is potentially in the 2-3 mm range, and thus better than that of a range counter.
The stages of the multi-stage design can be read out either by PMTs, in cases they are relatively thick, or with Si photodiodes for stage thicknesses less than 4 cm. In the first case, one needs to be aware of the potential influence of stray magnetic field in a Gantry room and in the latter the relatively large capacitance of the photodiodes may limit the data acquisition rate.
Implementation of fast pCT Image Reconstruction on a GPU Cluster
While the fast acquisition of raw data from the pCT detectors is based on FPGAs, a modern GPU concept was chosen for further processing of the data and subsequent image reconstruction. Various parallel algorithms to solve the large and sparse system of linear equations inherent in the pCT reconstruction problem are currently developed and their performance on different GPU cards is explored, with the overall intention of making pCT image reconstruction practical for clinical usage.
We are considering two basic classes of algorithms to do the reconstruction: block-iterative and string-averaged projection methods [5]. Block iterative projection (BIP) algorithms allow for parallel computation within a block of equations, and then require sequential computation between blocks. String averaging projection (SAP) algorithms, on the other hand, allow for parallel computation between strings, but require sequential computations within a string of equations. As the focus shifts towards using a cluster of GPUs to perform the reconstruction, SAP algorithms will be preferentially explored. Both SAP and BIP allow the system matrix of the linear system to be partitioned into blocks or strings of rows. Column partitioning of the matrix would require partitioning the actual object to be imaged into subsections to solve for, assuming the bounding sections to be water-equivalent, and then communicating with neighboring sections to get updates on the actual densities for those boundaries. The analysis of column partitioning as a possible approach to fast pCT calculation implemented on a GPU cluster is being investigated.
To support this research we have acquired four Nvidia C2090 GPUs, currently the fastest parallel computation cards available, with 512 stream processors each and 6GB of RAM. These cards have been installed in CSUSB’s GPU compute cluster, and the entire cluster will be used for testing and optimizing the algorithms.
OUTLOOK
The evaluation of the existing Phase 1 pCT scanner at LLU will continue while we are constructing the next generation of a pCT system. Work will continue at UC Santa Cruz to implement the Verilog code on FPGA development boards donated by Xilinx. The tracker ASIC design will be completed, fabricated and tested this year. Work is in progress to complete range detector and bulky energy detector prototypes to verify simulation results. The decision between the two competing pCT energy/range detector designs will then be made and fabrication of the final Phase 2 detector and its readout will commence during this year. CSUSB researchers will investigate a novel image reconstruction algorithms and test their implications to data organization for use on a fast GPU cluster.
ACKNOWLEDGMENT
The project described is supported by Award Number R01EB013118 from the National Institute of Biomedical Imaging and Bioengineering (NIBIB). The content of this paper is solely the responsibility of the authors and does not necessarily represent the official views of the National Institute of Biomedical Imaging And Bioengineering or the National Institutes of Health.
REFERENCES
- 1.HURLEY RF, SCHULTE RW, BASHKIROV VA, COUTRAKON G, SADROZINSKI HF-W, PATYAL B. The Phase 1 Proton CT Scanner and Test Beam Results at LLUMC. Am. Nucl. Soc. these proceedings. [PMC free article] [PubMed] [Google Scholar]
- 2.WILLIAMS DC. The Most Likely Path of an Energetic Charged Particle Through a Uniform Medium. Phys. Med. Biol. 2004;49:2899. doi: 10.1088/0031-9155/49/13/010. [DOI] [PubMed] [Google Scholar]
- 3.BRUZZI M, BLUMENKRANTZ N, FELDT J, HEIMANN J, SADROZINSKI HF-W, et al. Prototype Tracking Studies for Proton CT. IEEE Trans. Nucl. Sci. 2007;54:140. [Google Scholar]
- 4.CHRISTOPHERSEN M, FADEYEV V, PHLIPS BF, SADROZINSKI HF-W, PARKER C, ELY S, WRIGHT JG. Alumina and Silicon Oxide Sidewall Passivation for p- and n-Type Sensors. 8th Hiroshima Symposium on Tracking Detectors HSTD8; Taipei, Taiwan. Dec 5-8, 2011; submitted to Nucl. Instr. Meth. A. [Google Scholar]
- 5.PENFOLD SN. Ph.D. Thesis. University of Wollongong; 2010. Image Reconstruction and Monte Carlo Simulations in the Development of Proton Computed Tomography for Applications in Proton Radiation Therapy. [Google Scholar]


