Abstract
We present an integrated analytical method for analyzing peptide microarray antibody binding data, from normalization through subject-specific positivity calls and data integration and visualization. Current techniques for the normalization of such data sets do not account for non-specific binding activity. A novel normalization technique based on peptide sequence information quickly and effectively reduced systematic biases. We also employed a sliding mean window technique that borrows strength from peptides sharing similar sequences, resulting in reduced signal variability. A smoothed signal aided in the detection of weak antibody binding hotspots. A new principled FDR method of setting positivity thresholds struck a balance between sensitivity and specificity. In addition, we demonstrate the utility and importance of using baseline control measurements when making subject-specific positivity calls. Data sets from two human clinical trials of candidate HIV-1 vaccines were used to validate the effectiveness of our overall computational framework.
Keywords: Peptide microarrays, Antibodies, Normalization, Positivity calls, Software, Visualization
1) Introduction
Peptide microarrays are a powerful tool for profiling the fine specificity of antibody binding against thousands of peptides simultaneously. In a typical experimental protocol, slides spotted with a library of peptide probes are bathed in sample serum, and serum antibodies bind to cognate peptide probes. Fluorescently labeled secondary antibodies are added to tag peptide-bound serum antibodies, and scanned slides yield a fluorescence intensity for each probe. A common choice of peptide library is a tiling array, in which peptides are drawn from the linear sequence of a protein in an overlapping fashion. Typical applications of peptide microarrays include epitope mapping and the profiling of vaccine-elicited antibody responses.Lin et al. (2009) employed peptide tiling arrays to map linear epitopes for milk allergens. In a similar vein,Shreffler et al. (2004) used peptide tiling arrays to map linear epitopes on a peanut allergen. One can also test a treatment's effect on an antibody profile, referring to a subject's set of antibodies as well as their concentrations. Detecting changes in antibody profiles can help define the immunogenic properties of a vaccine. In studies of immune correlates of vaccine efficacy, peptide microarrays can tease out differences in antibody responses that correlate with an outcome of interest such as risk of infection (Neuman de Vegvar et al., 2003; Haynes et al., 2012).
As with DNA microarrays, technological variation can contaminate true underlying signal measurements from peptide probes. Thus peptide microarray experimental protocols include numerous steps that may introduce systematic biases. In many cases, the antibody binding intensity values from peptide microarray assays are not directly comparable because of inherent non-specific binding activity. If not accounted for, such biases can severely deteriorate subsequent results. The statistical method of normalization aims to reduce these biases for improved assay standardization. Most methods for peptide microarray normalization are based on techniques developed for gene expression microarrays (Kerr et al., 2000; Bolstad et al., 2003). Reilly and Valentini (2009) and Renard et al. (2011) used linear models to estimate and remove systematic errors. Schrage et al. (2009) used quantile normalization in the context of kinome profiling. Although DNA and peptide microarrays are similar in principle, experimental protocols differ substantially. Peptide microarray probes use short amino-acid sequences rather than nucleic acid sequences and require a fluorescently labeled secondary antibody to tag peptide-bound primary antibodies. This secondary binding reaction can increase background noise due to non-specific binding to peptides. The tremendous physiochemical diversity within a large library of peptides increases the likelihood of weak antibody binding that is not related to the antibodies of interest. DNA microarrays are also subject to non-specific hybridization (Naef and Magnasco, 2003), but many methods designed to cope with this are tailored to the particular biochemistry of DNA microarrays (Wu et al., 2004, Carvalho et al,. 2006). Thus, methods for DNA microarray normalization might not be optimal for peptide microarrays, and there is a need for peptide-specific normalization methods.
Once data have been properly normalized, true positives need to be identified that represent peptide-bound antibodies of interest. Again, in the context of peptide microarrays, most studies have used methods developed for the identification of differentially expressed genes. Schrage et al. (Schrage et al.) used Limma (Smyth, 2004) to compare kinome profiles across cell lines. Nahtman et al. (2007) used SAM (Efron and Tibshirani, 2002) to compare antibody profiles among TB-positive and TB-negative individuals. These methods can only compare profiles across groups of individuals and unfortunately cannot be used on a per subject basis. Due to between-subject variability of host immune systems, multiple subjects may produce different antibody profiles in response to an identical stimulus (e.g. vaccine or infection). As a consequence, it is important that the positivity method allow subject-specific determinations to be made. This is particularly true for vaccine immunogenicity studies, where it is common practice to report the proportion of subjects who generate a positive response after vaccination. The high throughput nature of peptide microarrays allows responses to be measured across thousands of peptides spanning numerous epitopes. As far as we are aware, only two groups have addressed the problem of subject-specific calls (Reilly and Valentini, 2009; Renard et al., 2011). Reilly and Valentini (2009) proposed a rule to call positive peptides those with signals above two standard deviations of the mean, where the mean and standard deviation are calculated across all peptides on a slide. In a similar fashion, Renard et al. (2011) used Gaussian mixture models to discriminate signal carrying peptides from background noise. Based on our experience, these two approaches can lead to a high false positive rate.
We present a complete analytical and visualization framework for the analysis of peptide microarray data that directly addresses the shortcomings mentioned above. The analytical tool, named pepStat, includes normalization, data smoothing and subject-specific positivity calls. The novel normalization method uses peptide physiochemical properties to estimate and remove non-specific peptide binding activity of antibodies. When the slide layout comprises overlapping n-mers, normalized signal intensities are then smoothed using a running mean, which consolidates signals across overlapping peptides and reduces background noise. We propose a method for generating subject-specific positivity calls by fixing a global threshold based on the false discovery rate (FDR). The visualization stage, named Pviz, is a general framework for high throughput data reduction and visualization, providing genome-browser type visualization. Pviz can simultaneously visualize and compare results from multiple studies, along with user-provided annotations of the antigen of interest (e.g. HIV-1 landmarks). Using two HIV-1 vaccine trial datasets, we illustrate our complete analytical framework compared to other methods, including normalization techniques developed for one-channel DNA microarrays, and the subject-specific positivity methods.
2. Methods
2.1. Datasets
As a basis for comparing methodologies, we consider two HIV-1 vaccine trial datasets.
RV144
The HIV-1 vaccine used in the RV144 efficacy trial consisted of priming with a recombinant canarypox vector and boosting with this vector and a bivalent gp120 protein. A pilot set of peptide microarray binding data was generated using plasma samples from 80 vaccine recipients and 20 placebo HIV-1 uninfected recipients, with pre and post-vaccination (2 weeks post final boosting) plasmas assayed together for all subjects. In addition, 20 of the 80 plasmas from vaccinees were assayed in two different laboratories, leading to a smaller “replicated” dataset. Further details about these data can be found in Karasavvas et al. (2012), while more details about the design and findings of the RV144 phase III clinical trial can be found in RerksNgarm et al. (2009). We will refer to these two RV144 pilot datasets as RV144a and RV144b, respectively.
HVTN204
HVTN204 was a phase 2 clinical trial of two HIV-1 vaccine candidates used in a prime-boost protocol. The two vaccines were VRC-HIVDNA016-00-VP (“DNA vaccine”) and VRC-HIVADV014-00-VP (“adenoviral vector vaccine”). The DNA priming agent comprised six plasmids containing the HIV genes gag, pol, nef and three gp140s (subtypes A, B, and C). The boost consisted of four adenovirus vectors separately expressing HIV-1 Gag/Pol and subtypes and subtypes A, B, and C gp140s. The dataset consists of a subset of 15 HIV-1 uninfected vaccinees with pre and post-vaccination assays run on all subjects.
Both experiments used the same peptide microarray design consisting of 1423 peptides tiling multiple subtypes (clades) of the HIV-1 envelope protein gp160 manufactured by JPT Peptide Technologies, Berlin, Germany (Tomaras et al., 2011). The peptide sequences covered the entire gp160 consensus sequences of 6 HIV-1 subtypes A, B, C, D, CRF01_AE and CRF02_AG, and a consensus group M gp160, Con-S (Gaschen et al., 2002). All peptides were synthesized as 15-mers overlapping by 12 amino acids. Amino acid sequences were indexed according to the gp160 sequence of HIV-1 strain HxB2. Each peptide was assigned a position within the HxB2 reference sequence corresponding to the midpoint of the alignment for that peptide.
Data Preprocessing
Foreground and background intensities from microarray scans were loaded from GenePix results (gpr) files. Background-corrected intensities were estimated using the normexp method, reviewed and developed in Ritchie et al. (2007) and implemented in the limma R package. Intensities were log2 transformed for further analysis. For each dataset, within-slide peptide replicates (in our case, 3) were summarized by their median prior to producing signal calls. The median summary is robust against outliers and questionable observations, and reduces the likelihood of false positives during further analysis.
2.2. Statistical modeling
Data Normalization
The primary goal of data normalization in antibody binding assays is to remove non-biological sources of bias and increase the comparability of true positive signal intensities across slides. Here, we introduce a novel normalization method applied to peptide microarrays that resembles normalization methods used for tiling DNA-based microarrays. It differs by using physiochemical properties of individual peptides instead of probe sequences as is commonly done for DNA based arrays (Johnson et al., 2006; Droit et al., 2010). As demonstrated by a yeast whole-proteome array (Michaud et al. 2003), epitope specificity can vary greatly across multiple antibodies, with a number of antibodies binding to non-cognate proteins. We expect that observed signal intensities contain effects unrelated to true peptide binding (i.e. antibodies binding to cognate peptides), such as non-specific binding of primary or secondary antibody.
We apply the z-scales developed in Sandberg et al. (1998) to model non-specific antibody binding to arrays. The z-scales are the first five principal components of 26 physiochemical amino acid properties such as molecular weight, thin layer chromatography values for various substrates, electronegativity, and others. A single z-scale represents a weighted combination of physiochemical properties that strongly differentiates amino acids. For example, the third z-scale mainly describes an amino acid's polarity. We obtain the five Z-scale values ζpj, j = 1,…, 5 for peptide p by summing the scores of the amino acids that it comprises.
Using the peptide z-scale values, we model the peptide intensities yp as
where εp is distributed σt4, a scaled student-t distribution with 4 degrees of freedom, β0 is an intercept term, and βj is the overall effect of the j-th physiochemical property. The use of t-distributed errors dramatically reduces the influence of extreme values when estimating model coefficients. In turn, relatively sparse true binding events do not unduly impact the estimation of non-specific binding events. Note that our model only includes linear terms; including higher order terms (e.g. ) did not improve the method's performance (data not shown). This model is fitted to each slide, and the fitted values estimate the portion of signal that arises due to systematic biases, such as batch effects and non-specific antibody binding. Normalized signal intensities are taken to be the residuals .
As a comparison, we tried a normalization method similar to the MAT model of Johnson et al. (2006) that is used to normalize DNA tiling experiments, in which DNA probes are normalized according to their ACGT counts. In our case, we model the peptide level intensities, yp as
where γjp counts the number of times amino acid j appears in peptide p, β0 is an intercept term, and βj is the overall effect of the j-th amino acid content. Again, this model is fitted to each slide separately, and normalized values are defined by the model residuals. For both methods above, within-slide peptide intensities are median summarized prior to modeling as described in the data section.
We compare physiochemical normalization against quantile normalization of Bolstad et al (2003) and a linear model approach. Nahtman et al. (2007), Reilly and Valentini (2009), and Renard et al. (2011) use linear models to control for factors such as spatial, print needle, and array effects. Slides from all data sets use the same array layout. Arrays comprise three subarrays with identical probe layouts. Within a subarray, probes are divided into sixteen blocks arranged in a four by four grid. Each block contains 121 probes spotted in an eleven by eleven grid by a distinct printing needle.
The overall probe composition of blocks varies, but each block contains seven control peptides. We use control peptides to estimate spatial, print needle, and array effects. Control peptides were not printed with sufficient density to estimate finer spatial effects such as row or column effects. We estimate array effects Ai, subarray effects Sj, needle effects Nk, control peptide effects Pl, as well as possible interactions. The intensity yijkl of control peptide l under needle k on subarray j of array i is modeled as
Terms (AS)ij and (AN)ik allow print needle and subarray effects to vary across arrays. The term (SN)jk allows print needle effects to vary across subarrays. The interaction (AP)ij allows control peptide effects to vary across arrays, which accommodates the possibility that sera from different patients react differently toward control peptides. To correct the remaining peptide intensities, we subtract corresponding estimates of array, subarray, and needle effects and their two-way interactions.
A three-way interaction term (ASN)ijk was initially included in the model. This term represents a spatial effect that is array, subarray, and needle specific. The (ASN)ijk term was not statistically significant for the RV144A and HVTN data sets, and hence is not used to correct peptide intensities. In the RV144B data set, the significance of the (ASN)ijk interaction entirely depended on the inclusion of two slides from one subject with very strong three-way interaction effects. Correcting for (ASN)ijk in RV144B increased overall intensity variability and did not improve ROC performance, so we also omit the (ASN)ijk interaction term from the RV144B correction. For this linear model and quantile normalization, within-slide replicates are median-summarized after normalization.
We define the normalized baseline corrected intensity of peptide p, zp, as the normalized intensity of peptide p post-vaccination minus its normalized intensity pre-vaccination. While our normalization method does capture some effects of non-specific binding events, subtracting pre-treatment intensities after normalization removes strong, consistent non-specific binding effects for which physiochemical properties alone fail to account. As we later show, baseline correction can substantially reduce signal variability.
Data smoothing
Normalization methods help remove systematic biases, but experimental variation may generate relatively noisy signal. Normalized (and baseline corrected) intensities alone also fail to take advantage of the overlapping nature of peptides on the array. When peptides on the arrays are overlapping n-mers from the linear amino acid sequence of a larger protein, two peptides could share a large portion of, or completely contain, an antibody epitope. We expect that the binding effects of two overlapping peptides will be positively correlated. Therefore we propose a sliding mean technique to borrow strength across neighboring peptides and to reduce signal variability.
About each peptide p, we define a window Wp(d) to be the set of peptides with position within d /2 of the position of p, according to their common HxB2 alignment positions. Let λp denote the position of the midpoint of peptide p. A peptide p' is a member of Wp(d) if and only if |λp− λp'|<d /2. The amount of overlap between two peptides depends on the length of the peptides, as well as the tuning parameter d. For our slide design, letting d = 9 results in a minimum overlap of nine amino acids for peptides contained in a common window. This value was chosen as the median of the length of known HIV gp160 continuous epitopes listed in the LANL database (Korber et al., 2001). To compute the sliding mean statistic ýp(d) for a peptide p, we simply average the response indices of neighboring peptides in a window Wp(d), resulting in a smoothed signal with dramatically lower variability. For peptides sharing a common position in an alignment, this also implies that the two peptides will receive the same sliding mean value, i.e. if λp = λp' then ýp(d) = ýp'(d) even if p ≠ p'. Though this is a loss of resolution, this statistic increases detection of binding hotspots that noisy signals might otherwise obscure.
Positivity calls
We propose a thresholding method for smoothed intensities to control the false discovery rate (FDR) across peptides and subjects, especially helpful in the absence of negative controls. The FDR is a multiple testing procedure that aims to control the proportion of positive calls that are false (Storey, 2002).
Assuming that for each subject, the distribution of peptide intensities is symmetric about zero, with long right tails in the event of true binding, the FDR can be estimated as follows for a given threshold T. We let
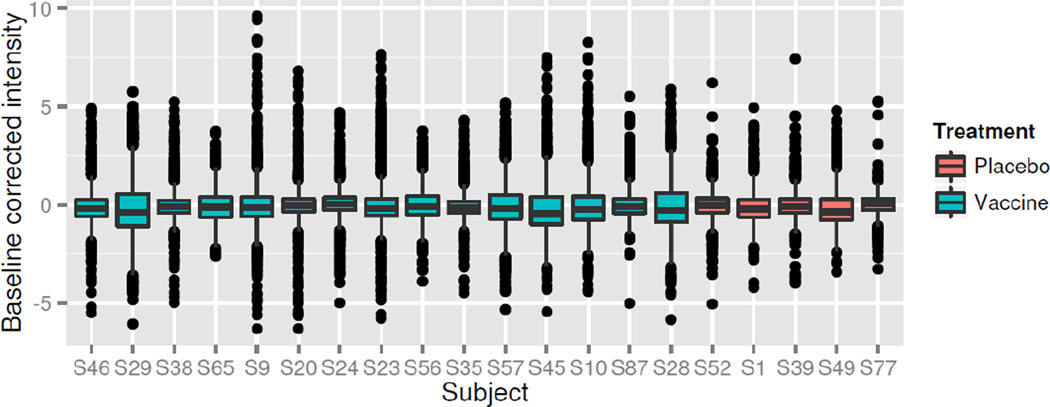
where Fs(T) is the estimated FDR for subject s at the threshold T. The numerators and denominators are computed only on the set of unique peptide indices, i.e. unique λp values. Using an argument of symmetry, the numerator is a good estimate of the number of false positives in the upper tail, for a given threshold T. The values Fs(T) are thus estimates of the false discovery rate within each subject, for a given threshold. The estimated overall FDR for a threshold T is the median of the values F (T)=meds Fs(T), across all subjects. The threshold T is selected as the threshold minimizing the difference |F (T)− f | where f is the target FDR (e.g. 10%). All peptides with responses ýsp(d) greater than T are called positive. The assumption of symmetry is generally satisfied after proper normalization and baseline correction, resulting in accurate FDR estimation (Figure 1) when using Z-scale normalization.
Figure 1. Distribution Symmetry.
Boxplots of Z-scale normalized peptide indices for fifteen randomly selected vaccines and five randomly selected placebo subjects from RV144 data. Responses are approximately symmetric about zero from subject to subject, with long right tails indicating peptide binding in vaccined subjects.
2.3. Software infrastructure
In order to efficiently process, analyze, and visualize peptide microarray data, we have developed an analysis pipeline consisting of four open-source R (Ihaka and Gentleman, 1996) packages: pepStat, HIV.db, PEP.db, and Pviz. Working directly from the GenePix results (gpr) files, pepStat extracts, normalizes and summarizes intensities before calculating positivity calls for each peptide and subject. When reading the data, the user may provide a comma-separated value (.csv) file that maps file names to metadata required for analysis, such as treatment (i.e. Placebo/Vaccine) and visit information (Pre/Post vaccination), subject identifiers, etc. pepStat automatically uses this information to compute normalized baseline corrected intensities, and calculate response groups broken down by treatment information. The HIV annotation database HIV.db contains various HIV and SIV annotation features that can be used to annotate specific HIV landmarks. The PEP.db package contains information about our peptide microarray designs including sequence information, HxB2 alignments and positions, that are required by pepStat. The structure of both HIV.db and PEP.db is modular, so that new annotations and/or peptide designs can be added for future analysis. Finally, Pviz can be used to efficiently integrate and visualize different data sources (e.g. peptide level data, sequence data and HIV annotations).
The data analysis platform allows for easy reproducibility of results while enabling investigators to quickly review and share peptide microarray results, derive new hypothesis, and generate high quality graphics for publications and reports. Our pipeline has been developed and optimized for HIV, but non-HIV data can be processed if the user creates the necessary peptide and annotation structures, similar to those in our PEP.db and HIV.db packages. Our infrastructure efficiently manipulates genomic coordinates and sequences by employing packages such as Biostrings and IRanges, available as part of the Bioconductor project (Gentleman et al., 2004). Our software is publicly available at https://github.com/RGLab.
3. Results
3.1 Comparison of pepStat normalization to other methods
ROC analysis
We use the receiver operating characteristic (ROC) to illustrate the benefits of normalization and to compare our pepStat normalization with other methods. Calculations are based on baseline corrected intensities z p as described in section 2.2. The ROC is a curve that describes a method’s ability to discriminate binary outcomes. A method’s ROC highlights the trade-off between sensitivity and specificity. The ROC traces false and true positive rates as a function of a detection threshold. The false positive rate is the proportion of positive calls that are not truly positive, and the true positive rate is the proportion of truly positive events that are called positive by a method. In our case, we varied a signal threshold T. When applied to the RV144a/b data sets, ROCs reveal how well various normalization methods separate the intensities of bound and unbound peptides. We also apply the ROC to smoothed data after normalization.
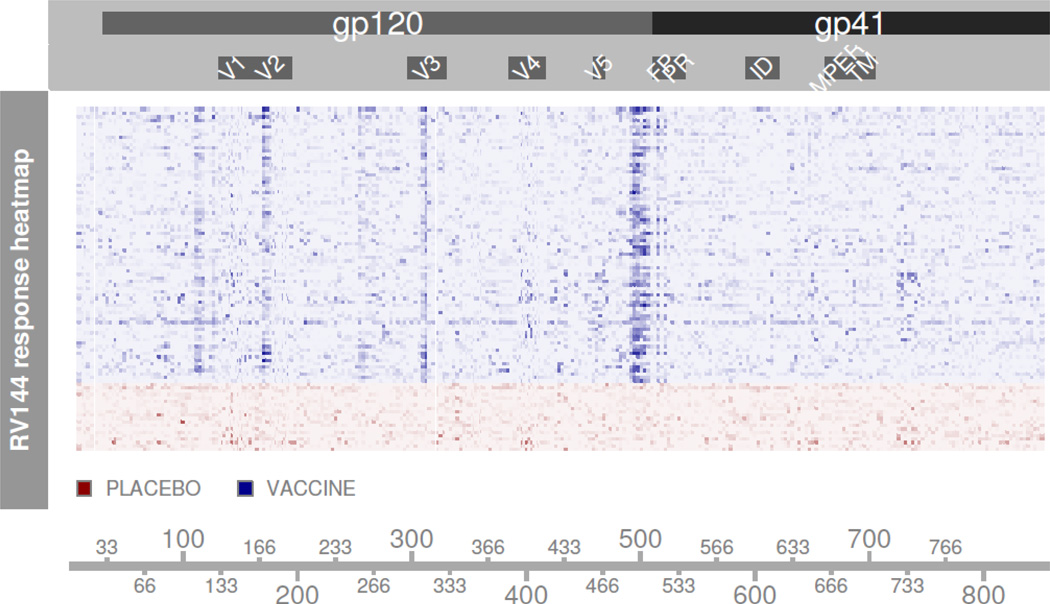
A reference truth is necessary to determine whether a positive call was truly positive. Because of prior-infections, allergies, or other non-specific binding mechanisms, subjects may elicit true positive binding events unrelated to treatment in both pre and post-treatment measurements. Baseline correction likely removes such binding events, hence we assume placebo subjects generate no true positive results. The peptide arrays cover both glycoproteins gp120 and gp41. Because the RV144 vaccine contains a gp120 insert, all peptides in gp120 have the potential to generate positive binding events among vaccinated subjects. The canarypox vector contains the env sequence for both gp120 and gp41, but the vaccine lacks a gp41 insert. Figure 2 demonstrates a lack of signal in gp41, leading us to characterize any binding to gp41 peptides as non-specific. In gp120 we include peptides in the C1 region just prior to the V1 loop, V2/V3 loop peptides, and gp120 C-terminus (C5 region) as likely positive peptides.
Figure 2. Signal Summary.
Heatmap entries are un-normalized RV144a peptide indicies. Rows represents single subjects, columns represent a position in HxB2 alignment. Subjects are divided into blocks based on treatment assignment. Darker hues correspond to higher levels of response. Placebo subjects show no clear response patterns, while vaccinated subjects show four distinct vertical bands corresponding to responses in the C1 region, V2/V3loops, and the C-terminus of gp120.
These immunogenic regions contain known epitopes and show consistent, strong signal across multiple vaccine subjects, as detected via inspection of Figure 2. Remaining gp120 peptides are considered true negative peptides. We stress that this reference truth is not the exact truth of who responded to vaccine stimulus; it only covers regions where a binding event is not unexpected. Some subjects possibly generated antibodies binding to peptides outside of our reference truth, while other subjects likely failed to generate an antibody response toward certain immunogenic regions. Thus ROCs are likely distorted from their true paths, but still allow relative comparisons between methods. When comparing smoothed data, peptides sharing the same alignment position are collapsed to a single position measurement. The reference truth for the smoothed data ROC comparison calls a position positive if any peptide within the position was labeled positive by the previous criteria.
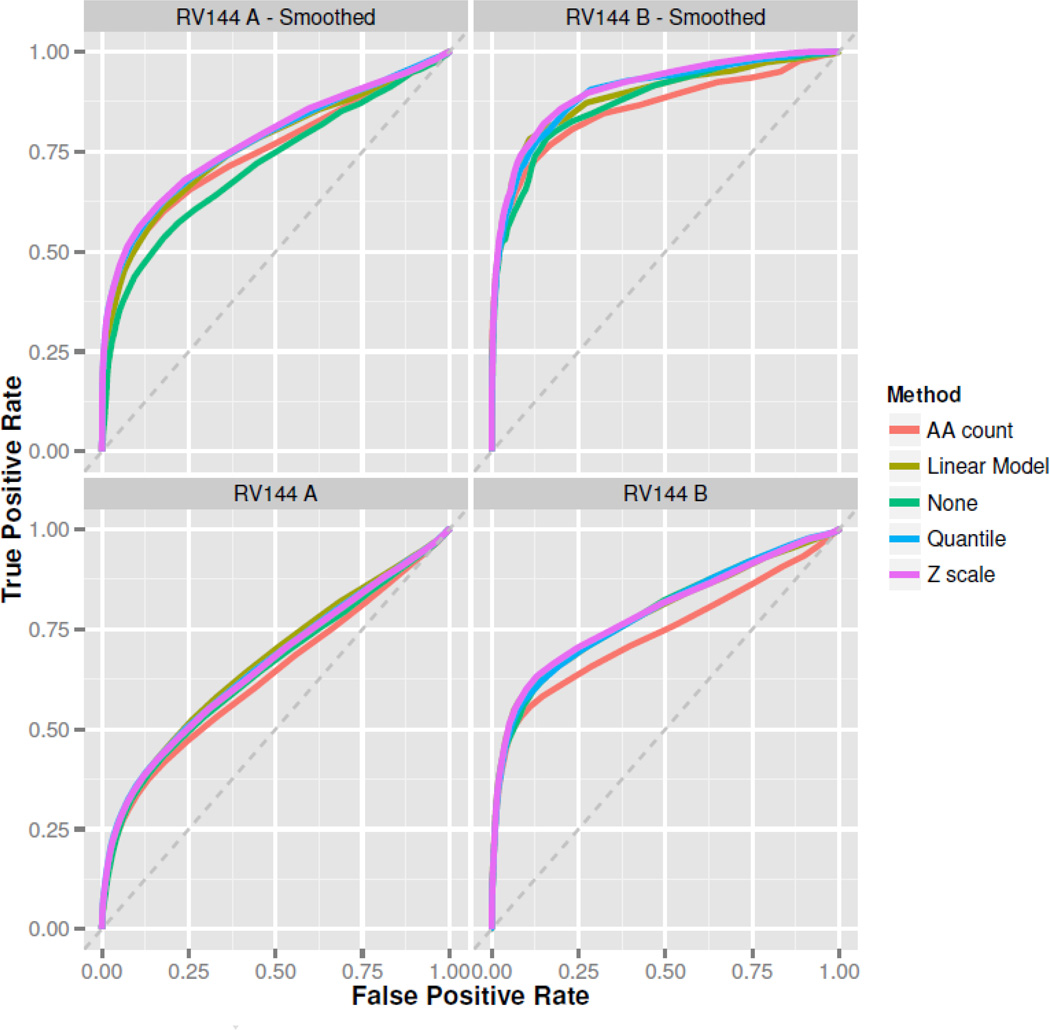
Figure 4 shows the approximate ROCs for the normalization techniques under consideration. Taller curves imply better discrimination, and the area under the ROC curve (AUC) is a numerical summary of a method's performance. Higher AUC corresponds to better discrimination. In RV144A the quantile, linear model, and Z-scale methods perform approximately the same, and exceed the performance of no normalization and the amino acid count method. With unsmoothed data, linear model normalization has highest AUC in RV144A, while Z-scale normalization has the highest AUC in RV144B (Table 1). In both unsmoothed data sets, normalization by the amino acid count method performs worse than not normalizing the data at all. The amino acid model possibly overfits the data and removes true signal along with background non-specific binding. Quantile, linear model, and Z-scale methods again outperform the amino acid count method and no normalization after applying our smoothing procedure to the data. Z-scale has the highest AUC in both smoothed data sets, followed by the quantile method, then the linear model method (Table 1).
Figure 4. RV144 ROC Analysis.
Five receiver operating characteristics (ROCs) are generated from response indices for the RV144a and RV144b datasets, using various normalization methods with smoothed and unsmoothed data. Taller curves imply better discrimination between bound and unbound peptides. The “Z-scale” normalization method narrowly beats out all the other methods in most cases, with linear model normalization typically doing nearly as well.
Table 1.
Area under curve (AUC) for the ROCs of normalization methods on baseline corrected intensity values, before smoothing and after smoothing. Best performing methods are highlighted in bold.
| RV144 A Unsmoothed |
RV144 B Unsmoothed |
RV144 A Smoothed |
RV144 B Smoothed |
|
|---|---|---|---|---|
| Z-scale | .659 | .792 | .779 | .907 |
| Linear Model | .668 | .788 | .762 | .889 |
| Quantile | .662 | .789 | .776 | .898 |
| None | .649 | .789 | .716 | .876 |
| AA count | .632 | .739 | .751 | .857 |
An advantage of Z-scale normalization, implemented in pepStat, is that it does not require sub-array information that are not always available to the data analyst. Linear model methods can also run into computational difficulties when treating a large number of arrays simultaneously. Fitting interaction effects can result in intractably large design matrices, and code may need to be written in a case-by-case basis.
FDR comparison
We used placebo data to evaluate our FDR estimation approach. FDR-based calling procedures attempt to control the expected proportion of positive calls that are false positives. The number of positive calls Pc in the vaccine group is known, for a given threshold T. This quantity is a sum of the unknown number of true and false positives, Pc = FP+TP. To estimate the observed proportion of false discoveries, we must know FP. We use the placebo group to estimate FP, because the distribution of non-signal-carrying peptides is approximately the same between vaccinated and placebo subjects. We count the number of positions exceeding threshold T among placebo subjects, then multiply by the ratio of the number of vaccinated subjects to placebo subjects. The resulting quantity is an estimate of FP among vaccinated subjects, allowing an estimate of the false discovery proportion FP/FP+TP.
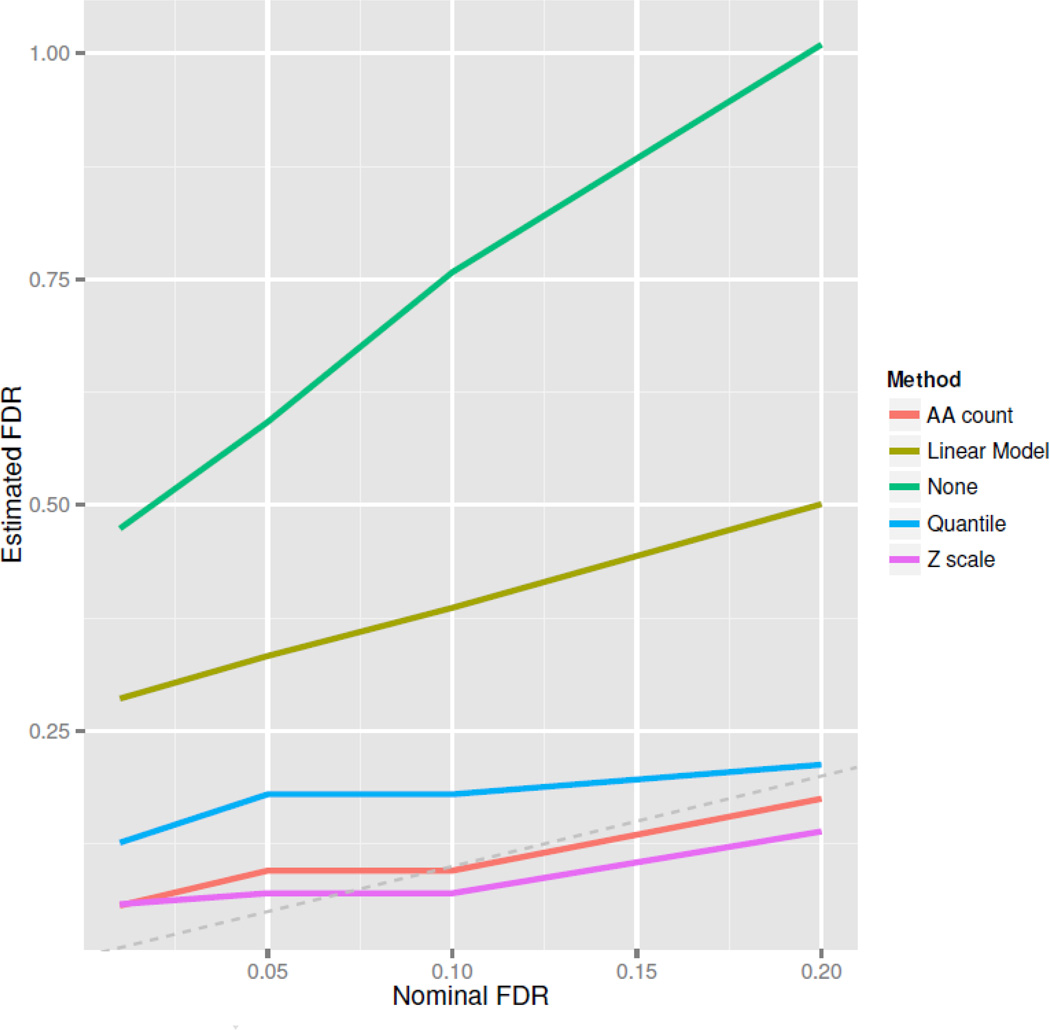
If our thresholding approach properly controls the FDR, then this quantity should approximately equal the nominal FDR. Figure 5 shows the estimated FDR against the nominal FDR for different normalization methods, after pepStat smoothing. The Z-scale, amino acid count, and quantile normalization methods give approximately correct FDR control and appear well suited for our thresholding technique. Linear model-based normalization and no normalization show poor FDR control with the threshold method. Thus taking into account the ROC analysis and FDR estimation, our Z-scale normalization appears to be preferable to competing methods.
Figure 5. FDR Estimation.
We use placebo data in RV144a to estimate the false discovery proportion (FDP) for thresholds generated by our FDR method. Curves represent the estimated FDP at various nominal false discovery rate (FDR) levels. The FDP is a random quantity, but should usually be close to the FDR. The amino acid count-model and the Z-scale model show good FDR control.
3.2. Visualization and summary analysis
We compare three positivity-calling methods. First we apply our FDR based thresholding procedure to smoothed and unsmoothed baseline-corrected, Z-scale normalized intensities. Next, we apply a two-component Gaussian mixture model (GMM) to the unsmoothed data as employed in the rapmad method of Renard et al. (2011). The upper 95th percentile of the “null signal” distribution provides a threshold. Lastly we use a cutoff of mean plus two standard deviations on unsmoothed data, as suggested in Reilly and Valentini (2009).
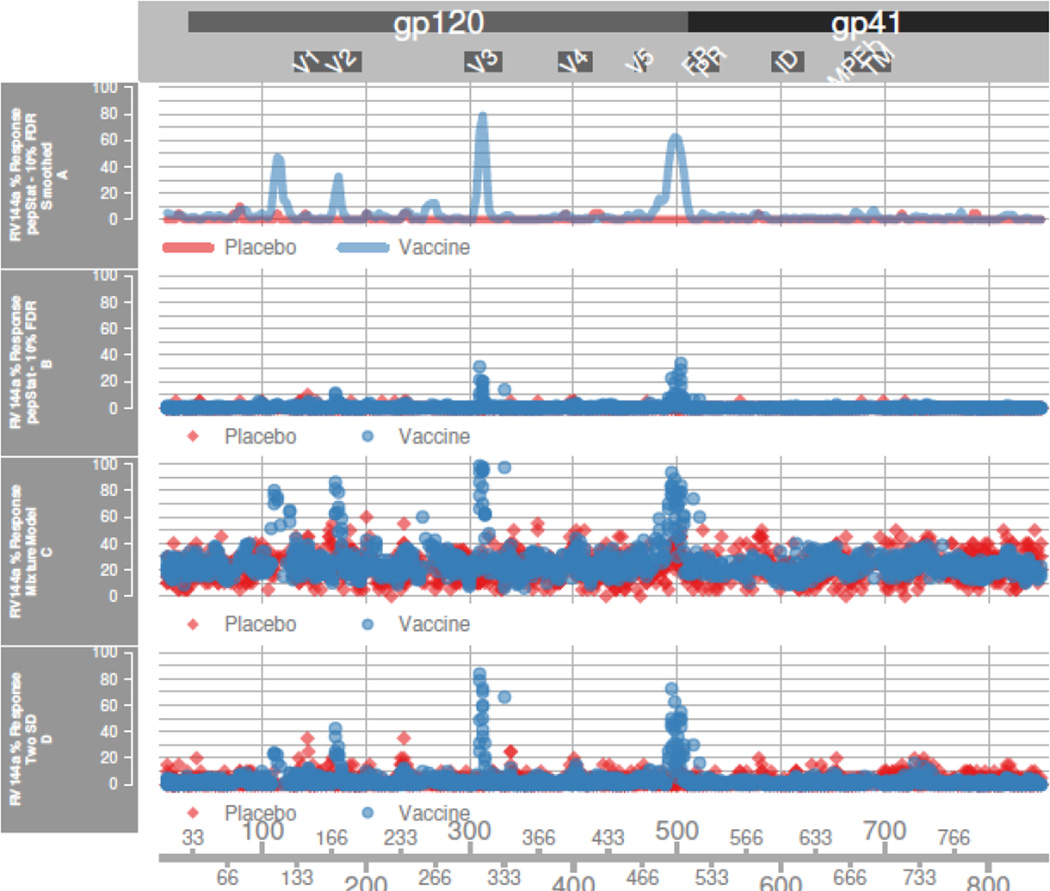
Figure 3 traces the percentage of subjects in RV144A marking positive calls for each peptide. Each peptide is indexed as a function of its position in HIV reference sequence HxB2, contained in the PEP.db package. The R package HIV.db provides an annotation database for HIV, while the Pviz package facilitates data visualization of protein profiles along with annotations. On Figure 3 we show one landmark annotation track, although other tracks containing different annotations can easily be added.
Figure 3. RV144a Response.
Percentage of subjects with positive response at position p in HxB2 alignment, for RV144a data. The GMM and mean plus two standard deviation (twoSD) calling methods make peptide specific calls. pepStat makes position specific calls in panel B and peptide specific calls in panel A. The Rapmad and twoSD methods call many more placebo false positives than pepStat.
In panel B of Figure 3 our 10% FDR based threshold is stringent on unsmoothed data, making relatively few false positive calls in placebo groups. In return, the method has somewhat diminished power for detecting responses in vaccinated subjects. Using smoothed data in panel A with our FDR-based thresholding procedure, we see a dramatic increase in vaccine group response rates in anticipated immunogenic regions compared to unsmoothed data. Meanwhile, placebo subjects in the RV144a dataset still show very low levels of false positive calls after smoothing. With the smoothed data, four distinct response peaks arise in the RV144a vaccine group, corresponding to the C1, the V2/V3 loops, and the C5 regions. Vaccinated RV144a subjects also show very low levels of false positive calls in the gp41 protein, where we expect no signal due to its exclusion as a vaccine protein component. Our smoothing procedure dramatically reduces noise in the data, leading to higher sensitivity for our positivity calling procedure.
Panel C shows the results of a GMM-based threshold on unsmoothed data. We detect much higher response rates in anticipated immunogenic regions, but in return we generate very high response rates across all subjects in most peptides. The two-SD method on unsmoothed data in panel D falls somewhere between, also showing high response rates in immunogenic regions but still generating high levels of false positive calls. Supplementary figure 1 demonstrates that a GMM-based model does not neatly capture a “signal” distribution, but rather seems to model heavy tails observed in the intensity distribution. When applied to the smoothed data, the GMM threshold produces very low sensitivity, while the two-SD method has comparable sensitivity to our thresholding technique at the expense of low specificity (supplementary figure 2).
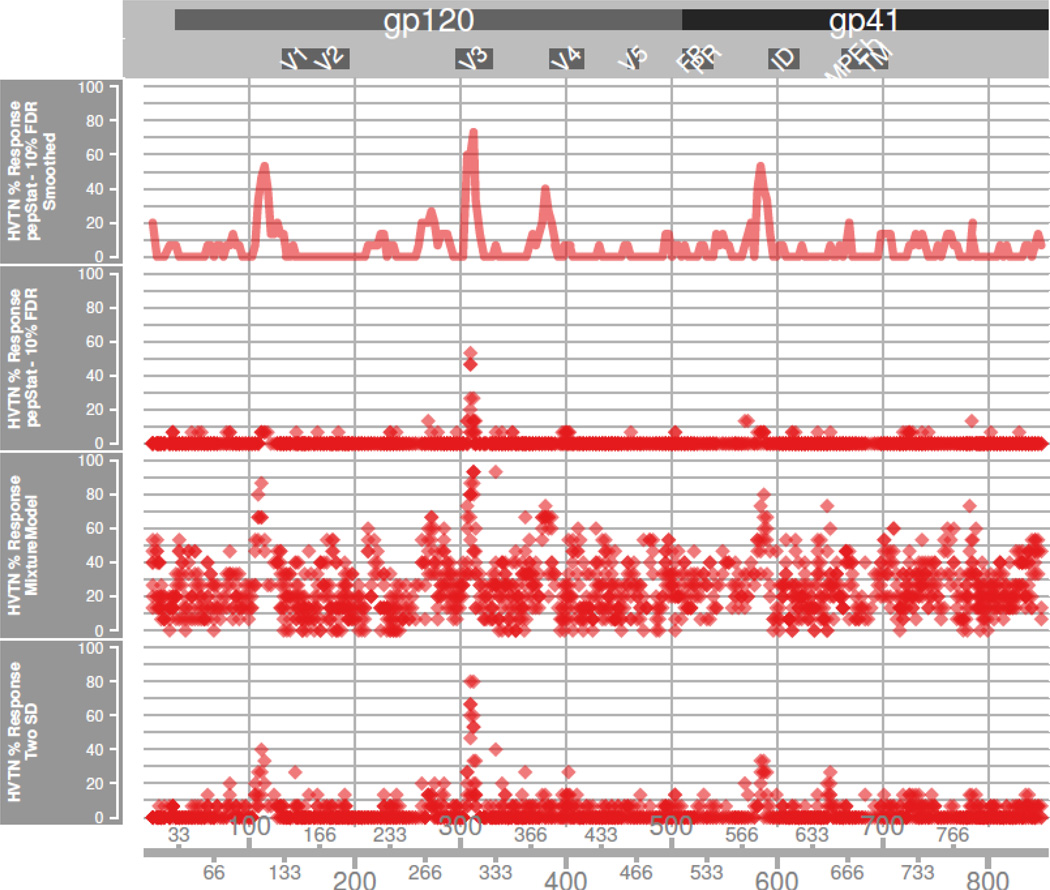
The four largest response peaks among the HVTN subjects correspond again to the C1 and V3 regions but also include the C3/V4 region and the immunodominant (ID) region of gp41. Our visualization framework, Pviz, quickly allows us to compare where responses differ between vaccines. The first panel of Figure 6 immediately shows that these specific HVTN204 vaccinees did not show a V2 loop response shown to be negatively correlated with infection in the RV144 secondary analyses (Haynes et al., 2012). Supplementary figure 3 shows the performance of the two-SD and GMM thresholding on the smoothed data, although these methods were not designed to be applied this way.
Figure 6. HVTN Response.
The percentage of subjects with positive response at position p in HxB2 alignment, for RV144a data. The Rapmad and mean plus two standard deviation (twoSD) calling methods make peptide specific calls on unsmoothed data, while for pepStat we show calls on smoothed and unsmoothed data. For Rapmad and twoSD methods, we plot the average percentage of response for peptides sharing common HxB2 positions. Rapmad generates a great number of likely noisy calls. The twoSD method produces cleaner calls, but appears less sensitive than the pepStat method.
Pviz, which inherits all plotting options of the Bioconductor package Gviz, can also visualize subject-specific peptide intensities. Figure 2 shows a heatmap of subject-level normalized and baseline- corrected intensities as a function of HxB2. The data are again broken down by the treatment information where the four hotspots can be seen as vertical bars in the vaccine group but not in the placebo group. Heatmap plots can also help visualize the correlation among localized responses. Here it can be seen that for the RV144, people generating a V2 response often also generated a response for V3 and C5.
3.3. Importance of baseline measurements
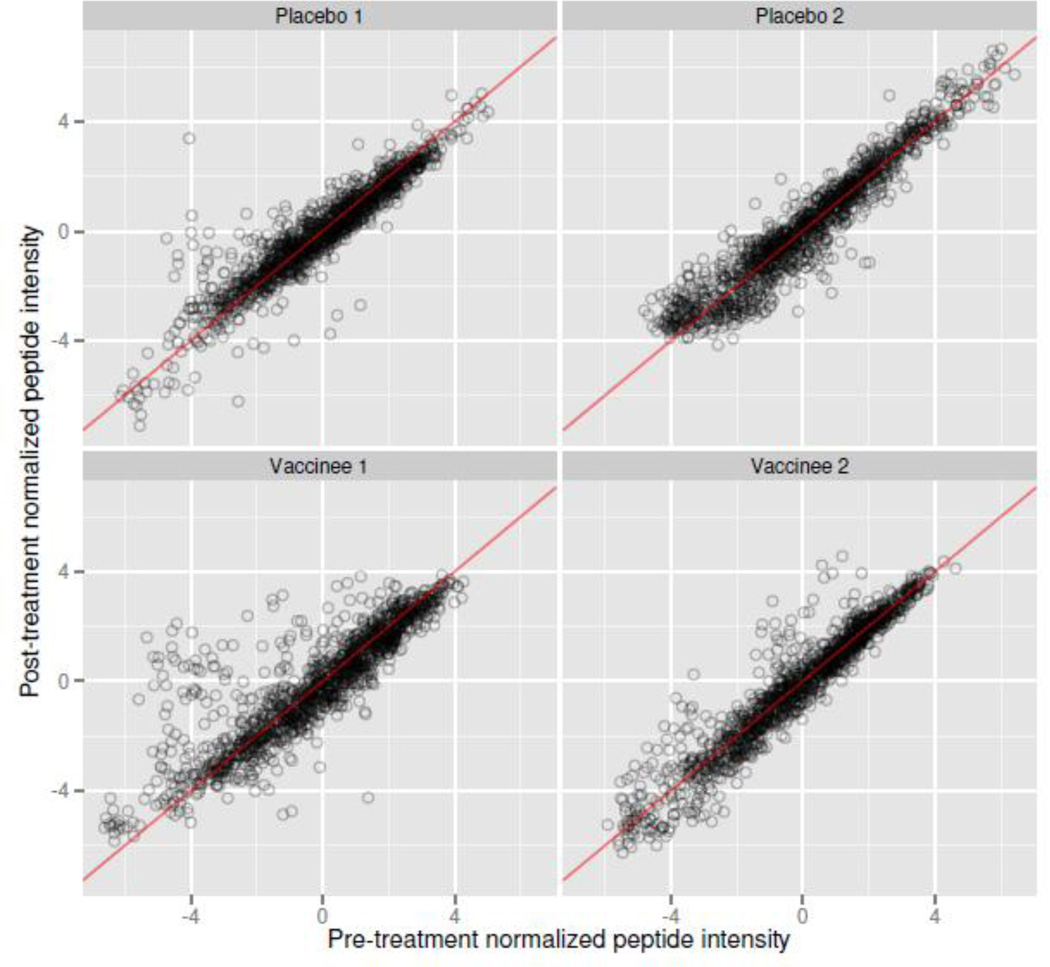
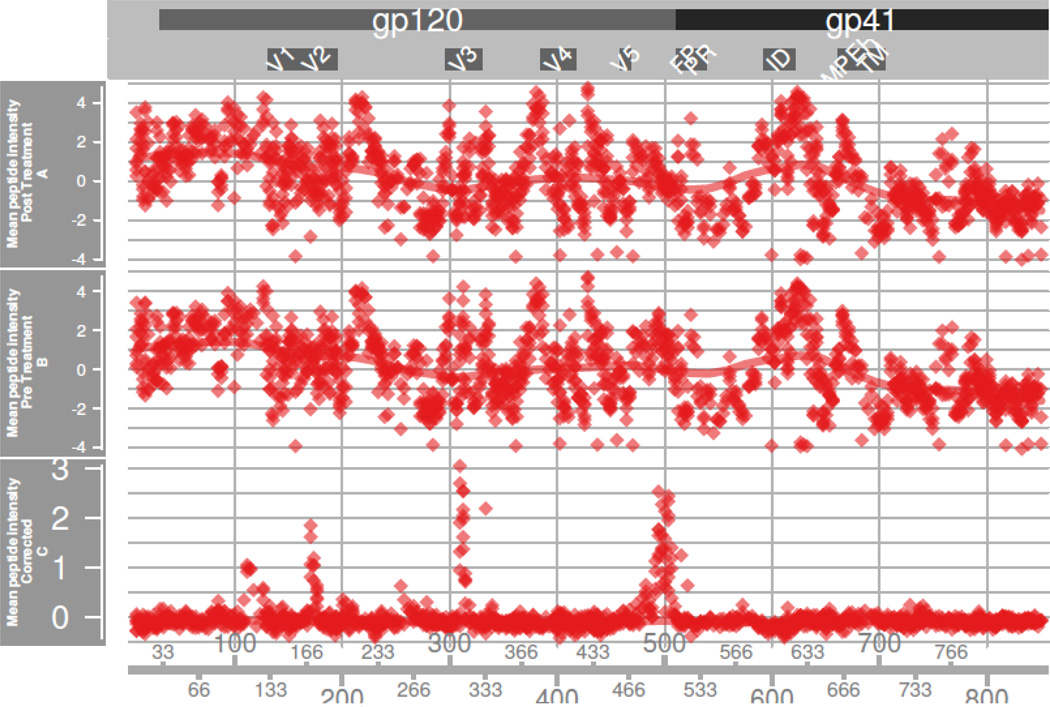
We explored the importance of baseline control samples for positivity calls in addition to normalization. In the RV144 data, among twenty placebo subjects, seventeen showed correlations greater than .9 between pre and post-treatment Z-scale normalized median-summarized peptide intensities, and all were at least .7 or greater. Figure 7 demonstrates these high correlations, showing the pre vs. post- normalized peptide intensities for 2 placebo and 2 vaccinated subjects. Most pre/post peptide intensities align around the diagonal line y = x, indicating the presence of consistent non-specific binding that should not be ignored. Signal carrying peptides can be observed for the two vaccinees as points above the diagonal line. Because of such high correlations, subtracting baseline intensities from post-treatment intensities dramatically reduces variability among unbound peptides (Figure 8). Panels A and B show concordant peptide effects across subjects before and after treatment, except on peptides against which subjects produce antibodies. In panel C, effects for non-reactive peptides collapse around zero after subtracting baseline measurements. In the presence of high correlation, baseline subtraction reduces signal variability and helps separate bound from unbound peptides. Similar patterns can be observed in the HVTN data (data not shown).
Figure 7. Baseline Correlation.
Scatterplots of pre versus post-treatment Z-scale normalized peptide intensity values, from randomly sampled placebo and vaccinated subjects. The red line is the identity line. Unbound peptides correlate very strongly between samples within subject, demonstrating that subject-specific controls can dramatically reduce response variability. Points well above the line y = x in vaccinated subjects likely correspond to bound peptides.
Figure 8. Baseline Correction.
In RV144a, we plot three tracks of across-subject Z-scale normalized peptide intensity means as a function of their HxB2 position: means of peptides in pre-treatment samples, means of peptides in post-treatment samples, and the mean of the differences. A smoother line tracks overall trends. By visual inspection one sees that the pre and post-treatment tracks are highly similar. The differences are tightly centered around zero, except at positions experiencing a vaccine response. This indicates the presence of weak nonspecific effects that normalization cannot remove.
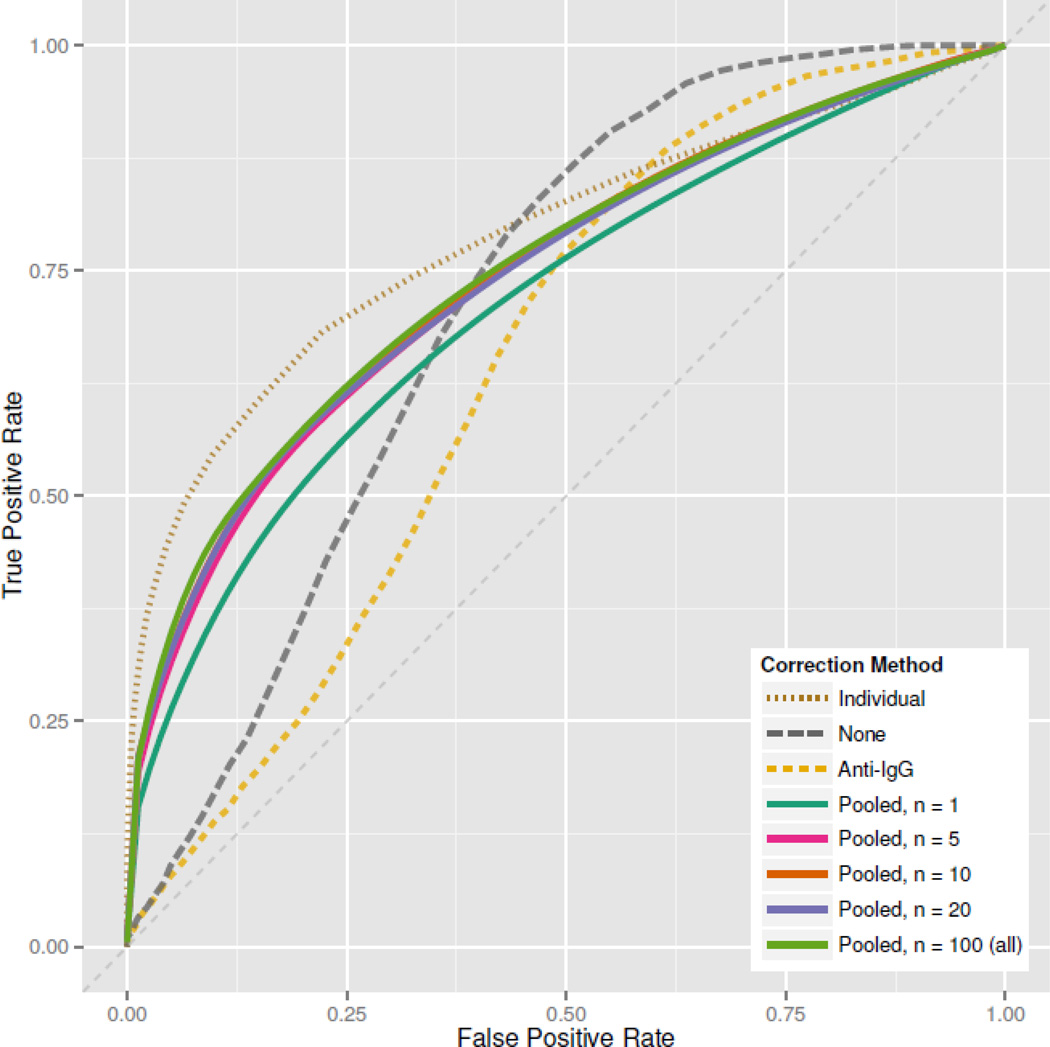
In both the RV144 and HVTN data, baseline controls were pre-vaccination samples from all subjects. In experiments where such paired samples are not available (e.g. natural infection) we recommend the use of a pool of baseline (or negative) controls, averaged to generate a reference control for all slides. In Figure 9 we compare RV144a ROCs from using individual baselines, pooled baseline controls, a secondary antibody control, and no baseline control, after Z-scale normalization. Pooled baseline control ROCs were generated by repeatedly sampling n = 1, 5, 10, 20 or all control samples, and computing an average ROC.
Figure 9. Correction Comparison.
ROCs based on different baseline correction methods, using Z-scale normalized peptide intensities in RV144a. “Pooled” methods are based on sampling n pre-treatment subjects and averaging their peptide responses as a single baseline control. For “pooled” methods, the displayed ROC is the average of 25 ROCs generated by randomly sampling n subjects. Individual specific baseline controls clearly outperform other methods, but we see that pooling baselines with n as small as 10 can produce reasonable results. Notably, a secondary antibody-only control performs poorly.
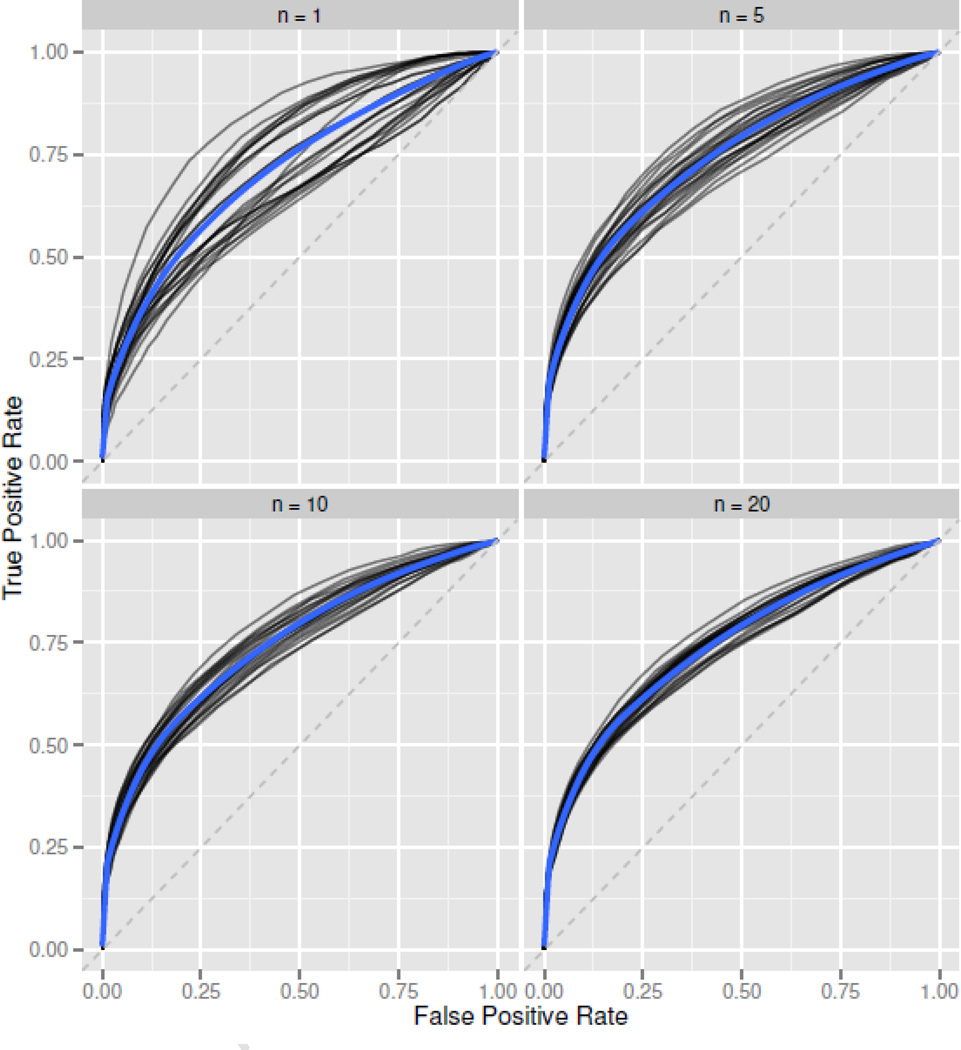
Subject-specific baseline controls give the highest ROC. Pooled baseline controls perform nearly as well, with larger pools performing slightly better than smaller pools. After about n = 10 baseline subjects, ROC gains are minimal and sample-to-sample ROC variability is relatively small (Figure 10). Without any baseline control the ROC is quite poor, especially at low false positive rate values where high true positive rates are most valuable. The secondary antibody control performs worst of all methods. This control is not well correlated with subject peptide responses, and subtraction tends to increase rather than decrease index variability. Subject serum contains primary antibody prior to treatment, and secondary antibody controls alone likely fail to capture primary/secondary antibody reactions that produce non-specific signals. Baseline controls are very important for making subject-specific positivity calls, and if possible we recommend using subject-specific peptide intensity measurements taken at baseline, or prior to treatment.
Figure 10. Pooled ROC Variability.
ROCs based on the “Pooled” baseline correction method, using Z-scale normalized peptide intensities in RV144a. Each black line is an ROC generated by randomly sampling n pre-treatment subjects for use as an averaged baseline. The blue line is a smoother applied to the set of black ROCs, giving an “average” ROC for a given sample size. This gives an idea of the variability associated with using a sample size of n as a pooled baseline control. ROC variability decreases quickly as sample sizes increase.
4. Conclusion
We have developed an integrated analytical pipeline for peptide microarray data including normalization, subject-specific positivity calls, and data aggregation and visualization. Our pipeline was primarily developed for HIV related studies, but its flexible design can be used easily with other studies. Our Z-scale normalization routine, implemented in pepStat, quickly and effectively removes systematic biases from slides while also helping to remove some effects of non-specific binding. Although only applicable to slide layouts comprising overlapping n-mers, the pepStat sliding mean window is a simple and powerful tool for detecting weak antibody binding hotspots by borrowing strength from neighboring peptides and reducing signal variability. Hotspot detection can lend insight to the cause of a treatment's efficacy and/or give direction to targeted future analyses. For example, after the pre-specified RV144 correlates analyses on vaccinees’ serum identified V2 vaccine-elicited IgG antibodies indirectly correlating with HIV risk of infection, detection of a V2 loop response on the RV144 peptide microarray led further validity to the observation and increased interest in assessing whether or not V2 antibodies are also vaccine-induced mechanistic correlates of protection (Haynes et al., 2012). Detecting a peptide microarray V2 loop response in the RV144 data also facilitated a targeted analysis of vaccine-induced sieving effects against HIV-1 viruses (Rolland et al., 2012).
Our principled FDR method of setting positivity thresholds improves calling specificity over previous methods and gives the threshold a concrete interpretation, even when our sliding window technique is not applicable. GMM based thresholds depend strongly on normality assumptions, which may not hold after preprocessing. Our thresholding technique depends on a looser assumption of symmetry of non-reacting peptides about zero, which approximately holds after our Z-scale normalization. Renard et al. (2011) recommend techniques for removing unreliable spots and spots reactive with secondary antibody. Such preprocessing may bring the data closer to normality, but, lacking the appropriate historical training data and empty slide data, we did not explore these techniques. Although our sliding mean technique improves hotspot detection, more sophisticated modeling techniques could help share additional information between subjects and improve the sensitivity of peptide positivity calls.
In addition, we demonstrate the utility of using baseline control methods when making subject-specific positivity calls. Subject-specific baselines perform well in the presence of high pre and post-treatment response correlations (e.g. > .7), which can be diagnosed with simple scatter plots and summary statistics. Our results also suggest that pooling as few as ten randomly sampled baseline controls is an adequate substitute.
Supplementary Material
Acknowledgments
The authors thank the participants, investigators, and sponsors of the RV144 Thai trial, including the U.S. Military HIV Research Program (MHRP); U.S. Army Medical Research and Materiel Command; NIAID; U.S. and Thai Components, Armed Forces Research Institute of Medical Science; Ministry of Public Health, Thailand; Mahidol University; Sanofi Pasteur; and Global Solutions for Infectious Diseases. We acknowledge support from the Bill and Melinda Gates Foundation VISC (Vaccine Immunology Statistical Center) [grant numbers OPP38744, OPP1032317] and the National Institute of Health funded HIV Vaccine Trials Network [grant number U01 AI068635-01]. Finally, we are grateful to JPT for their help and technical assistance.
Footnotes
Publisher's Disclaimer: This is a PDF file of an unedited manuscript that has been accepted for publication. As a service to our customers we are providing this early version of the manuscript. The manuscript will undergo copyediting, typesetting, and review of the resulting proof before it is published in its final citable form. Please note that during the production process errors may be discovered which could affect the content, and all legal disclaimers that apply to the journal pertain.
References
- Bolstad BM, Irizarry RA, Astrand M, Speed TP. A comparison of normalization methods for high density oligonucleotide array data based on variance and bias. Bioinformatics. 2003;19:185–193. doi: 10.1093/bioinformatics/19.2.185. [DOI] [PubMed] [Google Scholar]
- Carvalho B, Bengtsson H, Speed TP, Irizarry RA. Exploration, normalization, and genotype calls of high-density oligonucleotide SNP array data. Biostatistics. 2007;8(2):485–499. doi: 10.1093/biostatistics/kxl042. [DOI] [PubMed] [Google Scholar]
- Droit A, Cheung C, Gottardo R. rMAT - an R/Bioconductor package for analyzing ChIP-chip experiments. Bioinformatics. 2010;26:678–679. doi: 10.1093/bioinformatics/btq023. [DOI] [PubMed] [Google Scholar]
- Efron B, Tibshirani R. Empirical Bayes methods and false discovery rates for microarrays. Genetic Epidemiology. 2002;23:70–86. doi: 10.1002/gepi.1124. [DOI] [PubMed] [Google Scholar]
- Gaschen B, Taylor J, Yusim K, Foley B, Gao F, Lang D, Novitsky V, Haynes B, Hahn BH, Bhattacharya T, et al. Diversity considerations in HIV-1 vaccine selection. Science (New York, N.Y.) 2002;296:2354–2360. doi: 10.1126/science.1070441. [DOI] [PubMed] [Google Scholar]
- Gentleman RC, Carey VJ, Bates DM, Bolstad B, Dettling M, Dudoit S, Ellis B, Gautier L, Ge Y, Gentry J, et al. Bioconductor: open software development for computational biology and bioinformatics. Genome Biology. 2004;5:R80. doi: 10.1186/gb-2004-5-10-r80. [DOI] [PMC free article] [PubMed] [Google Scholar]
- Haynes B, Gilbert P, McElrath M. Immune-correlates analysis of an HIV-1 vaccine efficacy trial. England Journal of. 2012:1275–1286. doi: 10.1056/NEJMoa1113425. [DOI] [PMC free article] [PubMed] [Google Scholar]
- Ihaka R, Gentleman R. R: A Language for Data Analysis and Graphics. Journal of Computational and Graphical Statistics. 1996;5:299. [Google Scholar]
- Johnson WE, Li W, Meyer CA, Gottardo R, Carroll JS, Brown M, Liu XS. Model-based analysis of tiling-arrays for ChIP-chip. Proceedings of the National Academy of Sciences of the United States of America. 2006;103:12457–12462. doi: 10.1073/pnas.0601180103. [DOI] [PMC free article] [PubMed] [Google Scholar]
- Karasavvas N, Billings E, Rao M, Williams C, Zolla-Pazner S, Bailer RT, Koup RA, Madnote S, Arworn D, Shen X, et al. The Thai Phase III HIV Type 1 Vaccine Trial (RV144) Regimen Induces Antibodies That Target Conserved Regions Within the V2 Loop of gp120. AIDS Research \& Human Retroviruses. 2012 doi: 10.1089/aid.2012.0103. 121004062356001. [DOI] [PMC free article] [PubMed] [Google Scholar]
- Kerr MK, Martin M, Churchill GA. Analysis of variance for gene expression microarray data. Journal of Computational Biology : a Journal of Computational Molecular Cell Biology. 2000;7:819–837. doi: 10.1089/10665270050514954. [DOI] [PubMed] [Google Scholar]
- Korber B, Brander C, Haynes BF, Koup R, Kuiken C, Moore JP, Walker BD, Watkins DI. HIV molecular immunology 2001. Los Alamos, NM: Los Alamos National Laboratory; 2001. [Google Scholar]
- Lin J, Bardina L, Shreffler WG, Andreae DA, Ge Y, Wang J, Bruni FM, Fu Z, Han Y, Sampson HA. Development of a novel peptide microarray for large-scale epitope mapping of food allergensJAllergy Clin. Immunol. 2009;124:315–322. 322.e1–322.e3. doi: 10.1016/j.jaci.2009.05.024. [DOI] [PMC free article] [PubMed] [Google Scholar]
- Michaud GA, Salcius M, Zhou F, Bangham R, Bonin J, Guo H, Snyder M, Predki PF, Schweitzer BI. Analyzing antibody specificity with whole proteome microarrays. Nat Biotechnol. 2003;21:1509–1512. doi: 10.1038/nbt910. [DOI] [PubMed] [Google Scholar]
- Naef F, Magnasco MO. Solving the riddle of the bright mismatches: labeling and effective binding in oligonucleotide arrays. Physical Review E. 2003;68(1) doi: 10.1103/PhysRevE.68.011906. 011906. [DOI] [PubMed] [Google Scholar]
- Nahtman T, Jernberg A, Mahdavifar S, Zerweck J, Schutkowski M, Maeurer M, Reilly M. Validation of peptide epitope microarray experiments and extraction of quality data. Journal of Immunological Methods. 2007;328:1–13. doi: 10.1016/j.jim.2007.07.015. [DOI] [PubMed] [Google Scholar]
- Neuman de Vegvar HE, Amara RR, Steinman L, Utz PJ, Robinson HL, Robinson WH. Microarray profiling of antibody responses against simian-human immunodeficiency virus: postchallenge convergence of reactivities independent of host histocompatibility type and vaccine regimen. Journal of Virology. 2003;77:11125–11138. doi: 10.1128/JVI.77.20.11125-11138.2003. [DOI] [PMC free article] [PubMed] [Google Scholar]
- Reilly M, Valentini D. Peptide Microarrays. Methods in Molecular Biology. 2009;570:373–389. doi: 10.1007/978-1-60327-394-7_21. [DOI] [PubMed] [Google Scholar]
- Renard BY, Lower M, Kuhne Y, Reimer U, Rothermel A, T u reci O, Castle JC, Sahin U. rapmad: Robust analysis of peptide microarray data. BMC Bioinformatics. 2011;12:324. doi: 10.1186/1471-2105-12-324. [DOI] [PMC free article] [PubMed] [Google Scholar]
- Rerks-Ngarm S, Pitisuttithum P, Nitayaphan S, Kaewkungwal J, Chiu J, Paris R, Premsri N, Namwat C, de Souza M, Adams E, et al. Vaccination with ALVAC and AIDSVAX to prevent HIV-1 infection in Thailand. The New England Journal of Medicine. 2009;361:2209–2220. doi: 10.1056/NEJMoa0908492. [DOI] [PubMed] [Google Scholar]
- Ritchie ME, Silver J, Oshlack A, Holmes M, Diyagama D, Holloway A, Smyth GK. A comparison of background correction methods for two-colour microarrays. Bioinformatics. 2007;23:2700–2707. doi: 10.1093/bioinformatics/btm412. [DOI] [PubMed] [Google Scholar]
- Rolland M, Edlefsen PT, Larsen BB, Tovanabutra S, Sanders-Buell E, Hertz T, Kim JH. Increased HIV-1 vaccine efficacy against viruses with genetic signatures in Env V2. Nature. 2012 doi: 10.1038/nature11519. [DOI] [PMC free article] [PubMed] [Google Scholar]
- Sandberg M, Eriksson L, Jonsson J, Sjostrom M, Wold S. New chemical descriptors relevant for the design of biologically active peptides. A multivariate characterization of 87 amino acids. Journal of Medicinal Chemistry. 1998;41:2481–2491. doi: 10.1021/jm9700575. [DOI] [PubMed] [Google Scholar]
- Schrage YM, Briaire-de Bruijn IH, de Miranda NFCC, van Oosterwijk J, Taminiau AHM, van Wezel T, Hogendoorn PCW, Bovee JVMG. Kinome Profiling of Chondrosarcoma Reveals Src-Pathway Activity and Dasatinib as Option for Treatment. Cancer Research. 2009;69:6216–6222. doi: 10.1158/0008-5472.CAN-08-4801. [DOI] [PubMed] [Google Scholar]
- Shreffler WG, Beyer K, Chu THT, Burks A, Sampson HA. Microarray immunoassay: association of clinical history, in vitro IgE function, and heterogeneity of allergenic peanut epitopes. Journal of allergy and clinical immunology. 2004;113(4):776–782. doi: 10.1016/j.jaci.2003.12.588. [DOI] [PubMed] [Google Scholar]
- Smyth GK. Linear models and empirical Bayes methods for assessing differential expression in microarray experiments. Statistical Applications in Genetics and Molecular Biology. 2004;3 doi: 10.2202/1544-6115.1027. Article3. [DOI] [PubMed] [Google Scholar]
- Storey JD. A direct approach to false discovery rates. Journal of the Royal Statistical Society. Series B (Methodological) 2002;64:479–498. [Google Scholar]
- Tomaras Georgia D, Binley James M, Gray Elin S, Crooks Emma T, Osawa Keiko, Moore Penny L, Tumba Nancy, Tong Tommy, Shen Xiaoying, Yates Nicole L, Decker Julie, Wibmer Constantinos Kurt, Gao Feng, Alam S Munir, Easterbrook Philippa, Karim Salim Abdool, Kamanga Gift, Crump John A, Cohen Myron, Shaw George M, Mascola John R, Haynes Barton F, Montefiori David C, Morris Lynn. Polyclonal B Cell Responses to Conserved Neutralization Epitopes in a Subset of HIV-1-Infected Individuals. Journal of Virology. 2011;85(21):11502–11519. doi: 10.1128/JVI.05363-11. [DOI] [PMC free article] [PubMed] [Google Scholar]
- Wu Z, Irizarry RA, Gentleman R, Murillo FM, Spencer F. A model based background adjustment for oligonucleotide expression arrays. Journal of the American Statistical Society. 2004;99:909–917. [Google Scholar]
Associated Data
This section collects any data citations, data availability statements, or supplementary materials included in this article.


