

Abstract
A key transducer in energy conservation and signaling cell death is the mitochondrial H+-ATP synthase. The expression of the ATPase inhibitory factor 1 (IF1) is a strategy used by cancer cells to inhibit the activity of the H+-ATP synthase to generate a ROS signal that switches on cellular programs of survival. We have generated a mouse model expressing a mutant of human IF1 in brain neurons to assess the role of the H+-ATP synthase in cell death in vivo. The expression of hIF1 inhibits the activity of oxidative phosphorylation and mediates the shift of neurons to an enhanced aerobic glycolysis. Metabolic reprogramming induces brain preconditioning affording protection against quinolinic acid-induced excitotoxicity. Mechanistically, preconditioning involves the activation of the Akt/p70S6K and PARP repair pathways and Bcl-xL protection from cell death. Overall, our findings provide the first in vivo evidence highlighting the H+-ATP synthase as a target to prevent neuronal cell death.
Keywords: brain preconditioning, energy metabolism, H+-ATP synthase, inhibitory factor 1 (IF1), mitochondria
Introduction
The H+-ATP synthase of the inner mitochondrial membrane is a master regulator of energy metabolism and cell fate. In oxidative phosphorylation (OXPHOS), the H+-ATP synthase utilizes the H+ electrochemical gradient generated by the respiratory chain to synthesize most of the ATP that is required to sustain cellular activities of the differentiated aerobic cell. Many findings corroborate the molecular and functional integration of OXPHOS (Dey & Moraes, 2000; Tomiyama et al, 2006) and specifically of the H+-ATP synthase (Matsuyama et al, 1998; Shchepina et al, 2002; Santamaria et al, 2006; Alavian et al, 2011; Chen et al, 2011) with cell death. In fact, apoptosis has been shown to be strictly dependent upon subunits of the H+-ATP synthase in yeast, mammals, and plants (Matsuyama et al, 1998; Gross et al, 2000; Chivasa et al, 2011). The point of no return in cell death is the permeabilization of the inner mitochondrial membrane to low molecular weight solutes, through opening of the so-called permeability transition pore (PTP) (Galluzzi et al, 2009; Di Lisa et al, 2011). Although the molecular composition of the PTP remains unknown, recent findings support that the high-conductance channel is composed by dimers of the H+-ATP synthase (Giorgio et al, 2013), consistent with the finding that subunit c of the F0-channel of the H+-ATP synthase is required for the activity of the PTP (Bonora et al, 2013). Cyclophilin D that regulates the activity of the PTP also interacts and regulates the activity of the H+-ATP synthase (Giorgio et al, 2009).
Down-regulation of the H+-ATP synthase is functionally linked to resistance to chemotherapy in cancer cells (Shin et al, 2005; Hernlund et al, 2009; Li et al, 2010; Sanchez-Arago et al, 2013a), consistent with the emerging role of the mitochondrial synthase in the execution of cell death. More recently, cancer cells have been shown to escape from death by inhibiting the activity of the H+-ATP synthase by the overexpression of the ATPase inhibitory factor 1 (IF1) (Formentini et al, 2012; Faccenda et al, 2013; Sanchez-Arago et al, 2013b), which mimics the inhibitory effect of oligomycin (OL) in apoptosis (Matsuyama et al, 1998; Shchepina et al, 2002; Santamaria et al, 2006). IF1 is the physiological inhibitor of the mitochondrial H+-ATP synthase (Gledhill et al, 2007). Mechanistically, cell survival results from rewiring of energy metabolism and nuclear reprogramming due to a reactive oxygen species (ROS) signal that is produced in mitochondria after the IF1-mediated inhibition of the H+-ATP synthase (Formentini et al, 2012; Sanchez-Arago et al, 2013b).
We present a mouse model expressing a mutant of human IF1 (hIF1) in neurons under the control of a doxycyclin-regulated promoter. The purpose of this model was to inhibit by the most effective way the activity of the H+-ATP synthase in vivo. Studies in total brain, isolated mitochondria, and primary neuronal cultures demonstrate that overexpression of hIF1 partially inhibits oxidative phosphorylation triggering an adaptive metabolic response that results in increased aerobic glycolysis. The IF1-mediated metabolic reprogramming results in brain preconditioning and involves a mild oxidative stress that protects neurons from excitotoxic damage, enhancing motor behavior. Overall, our findings provide the first demonstration that links the inhibition of the H+-ATP synthase with protection from neuronal damage in vivo, highlighting the pivotal role that the engine of OXPHOS has a cell death regulator.
Results
A mouse model to inhibit the neuronal H+-ATP synthase in vivo
To assess the role of OXPHOS in neurons, we generated a transgenic mouse (H+) that integrates in its genome the mutant H49K of the human ATPase inhibitory factor 1 (hIF1) under a tetracycline-regulated promoter (TRE-H49K) (Fig 1A). The H49K mutant has a higher binding affinity for the β-catalytic subunit of the H+-ATP synthase (Cabezon et al, 2000). Double transgenic Tet-Off mice (H+/T+) were generated by breeding H+ animals with CamKII-tTA mice (T+) that express the tTA transgene (Fig 1A) in neurons. Western blots (Fig 1A) and immunohistochemistry of coronal brain slices (Fig 1B, Supplementary Figs S1 and S2) revealed that only the H+/T+ genotype expresses hIF1 in mitochondria of neurons, resulting in approximately 3-fold increase in the total cellular content of IF1 (Fig 1A). The expression of hIF1 did not affect the expression of other mitochondrial proteins (Fig 1C and Supplementary Fig S3). However, the concentration of ATP was significantly diminished in the brain of H+/T+ mice when compared to controls (Fig 1D). These changes were accompanied by an increased concentration of AMP (Fig 1D) and the concurrent phosphorylation of the metabolic sensor AMPK (Fig 1E) in the brain of H+/T+ mice. Interestingly, a significant increase in the expression of the glycolytic enzymes GAPDH and LDH-A (Fig 1E) was observed in brain extracts of H+/T+ mice. Despite these differences, H+/T+ mice were born in the expected Mendelian ratios and were normal in appearance, home-cage behavior, reproduction, and longevity up to 1-year follow-up.
Figure 1. Mice expressing hIF1 in neurons.

- PCR analysis for the H49K variant of hIF1 and tTA constructs in wild-type (wt), tTA (T+), H49K (H+) or double transgenic (H+/T+) mice is shown. Western blots reveal the expression of hIF1 and IF1 (12 kDa) in total brain extracts. hIF1 is only expressed in H+/T+ mice. β-actin expression is shown as a loading control.
- Immunohistochemistry (mitochondrial staining) for hIF1 and β-F1 ATPase (β-F1) in brain cortex of control (wt) and H+/T+ mice. Magnification 63×.
- Representative Western blots of the expression of hIF1, heat-shock protein 60 (HSP60), and mitochondrial complexes I (NADH9), II (SDH), III (core II), IV (COXI and COX IV), and V (β-F1) in total brain extracts of wt and H+/T+ mice. Two different samples per condition tested are shown.
- Content of adenine nucleotides in brain extracts of control (wt, closed bars) and H+/T+ mice (open bars).
- Western blots show the hIF1-dependent phosphorylation of AMPK (p-AMPK) and the concurrent increase in glycolytic proteins lactate dehydrogenase A (LDH-A) and glyceraldehyde-3-phosphate dehydrogenase (GAPDH) in brain extracts (see histograms to the right). Two different samples per condition tested are shown. β-F1 and HSP60 expressions are shown as loading controls.
- Hydrolytic activity of the H+-ATP synthase in isolated mitochondria from brain of control (wt, black trace) and H+/T+ (gray trace) mice. Where indicated, 10 μM oligomycin (OL) was added.
- Variation in the membrane potential (TMRM+ staining) of isolated mitochondria from control (black trace) and H+/T+ animals (gray trace) charged with 100 nM TMRM+. The effect of 1 μM antimycin A in the presence of 10 mM ATP is shown.
Data information: In (D, E, and F), bars are the mean ± s.e.m. of six different samples; *P < 0.05 when compared to control by Student's t-test. See also Supplementary Figs S1, S2, and S3.
Source data are available online for this figure.
hIF1 inhibits the H+-ATP synthase
The hydrolytic activity of the H+-ATP synthase was significantly reduced in isolated brain mitochondria from H+/T+ mice when compared to controls (Fig 1F). Consistently, TMRM+ staining after the administration of antimycin A revealed a minor capacity of mitochondria from H+/T+ mice to sustain the membrane potential (ΔΨm) (Fig 1G). Likewise, oxygen consumption rates revealed that both State 3 (ADP-stimulated), uncoupled (FCCP-induced), and OL-sensitive respiration were significantly diminished when compared to controls (Fig 2A). The latter is consistent with the inhibition of the synthase activity of the ATP synthase by the expression of hIF1. No relevant differences were observed in ΔΨm in H+/T+ mice when compared to controls (Figs 1G and 2B). However, the addition of ADP triggered a larger ΔΨm depolarization in mitochondria of wild-type versus H+/T+ mice (Fig 2B), also consistent with the partial inhibition of the synthase activity of the H+-ATP synthase by hIF1. A mild increase in the carbonylation of specific proteins (Fig 2C) and in the basal levels of catalase, SOD1, and SOD2 (Fig 2D) was observed in the brain of H+/T+ mice when compared to controls. However, no significant differences in GSH and GSH/GSSG ratio were observed (Fig 2E), showing that the oxidative stress induced by hIF1 expression is of mild intensity.
Figure 2. hIF1 impairs oxidative phosphorylation.

- Polarographic profiles of isolated mitochondria from control (lower trace) and H+/T+ animals (upper trace). The effect of 10 mM glutamate/malate, 0.5 mM ADP, 5 μM oligomycin (OL), 5 μM FCCP, and 1 μM antimycin A (Ant) is shown. Histograms reveal a reduction in State III (StIII) and uncoupled (FCCP) respiration in mitochondria of H+/T+ mice (open bars) when compared to controls (wt, closed bars). OL-sensitive ATP synthase activity is also shown as a percentage of maximal respiration.
- Variation in the membrane potential (TMRM+ staining) of isolated mitochondria from control (black trace) and H+/T+ animals (gray trace) charged with 100 nM TMRM+. The effect of 5 mM succinate, 1 mM ADP, 5 μM OL, and 5 μM FCCP 1 is shown. Histograms show a larger reduction in ΔΨm after ADP administration in controls (wt, closed bars) when compared to hIF1-expressing mice (H+/T+, open bars).
- Representative Western blot of the extent of carbonylation of total brain proteins. Two different samples per condition tested are shown. Tubulin was used as loading control. The migration of molecular mass markers is indicated to the right. Arrows (to the left) identify the migration of the two proteins used in the quantification of protein carbonylation (histograms).
- Representative Western blots of catalase (cat), superoxide dismutase 1 and 2 (SOD1 and SOD2) expression in control (wt, closed bars) and hIF1-expressing (H+/T+, open bars) mice.
- Cellular glutathione (GSH) and GSH/GSSG ratio in total brain.
- Blue-native immunoblot analysis of mitochondrial membrane proteins visualized with antibodies against mitochondrial complexes I (NADH9), II (SDH), III (core II), IV (COX IV), and V (β-F1-ATPase). The migration of monomers (Mon), dimers (Dim), supercomplex (SC), F1-ATPase (F1), H+-ATP synthase (F0F1), and molecular mass markers is indicated.
- Enzymatic activity of mitochondrial complexes I, II+III, and IV in isolated brain mitochondria of control (wt, closed bars) and H+/T+ (open bars) mice.
Data information: Bars are the mean ± s.e.m. of three (A, B, D, G), four (C), or six (E, F) determinations; *P < 0.05 when compared to controls by Student's t-test.
Source data are available online for this figure.
hIF1 inhibits cytochrome c oxidase activity
No relevant differences were noted in the content of native complexes I, II, III, and V in mitochondria between H+/T+ mice and controls (Fig 2F). Interestingly, mitochondria of H+/T+ mice showed no formation of supercomplex containing complex IV (Fig 2F). In fact, most of complex IV migrated as monomer (Fig 2F). Consistent with the role of supercomplexes in the rate of respiration (Acin-Perez et al, 2008; Lapuente-Brun et al, 2013), the enzymatic activity of complex IV was significantly diminished in mitochondria of H+/T+ mice (Fig 2G). No differences were noted in the activities of complex I and complexes II+III between both phenotypes (Fig 2G).
hIF1 promotes metabolic reprogramming and ROS signaling in cortical neurons
Only primary cultures of cortical neurons (Supplementary Fig S4) derived from H+/T+ embryos expressed hIF1 (Fig 3A–C). Expression of hIF1 resulted in a significant decrease in the cellular content of ATP (Fig 3D) and in the activity of the H+-ATP synthase (Fig 3E). This effect was not observed in 4-d cultures (Fig 3E), when neurons are not yet expressing hIF1 (Fig 3B). The expression of hIF1 resulted in a significant increase in aerobic glycolysis as assessed by the rate of lactate production (Fig 3F). OL induced aerobic glycolysis only in neurons derived from control animals (Fig 3F), supporting that hIF1 is stimulating aerobic glycolysis to its maximum rate (Fig 3F). Analysis of the expression of PK-M2, LDH-A, and GAPDH confirmed the induction of glycolysis in H+/T+ neurons when compared to wild-type cultures (Fig 3G). Basal TMRM+ fluorescence did not show significant differences between H+/T+ and controls (Fig 3H, Supplementary Figs S5 and S6), suggesting that there is no major difference in ΔΨm. Consistent with the inhibition of both the synthase and hydrolase activity of the H+-ATP synthase by hIF1, we observed that ΔΨm changes in response to OL were lower (Supplementary Fig S5), whereas those to antimycin A were higher (Supplementary Fig S6) in H+/T+ cultures than in control. The production of superoxide radical was enhanced in H+/T+ neurons when compared to wild type (Fig 3I). An increase in the carbonylation of specific neuronal proteins was observed (Fig 3J), consistent with a higher basal production of ROS in H+/T+ neurons and with data in brain homogenates (Fig 2C).
Figure 3. hIF1-induced metabolic reprogramming and ROS signaling in cortical neurons.
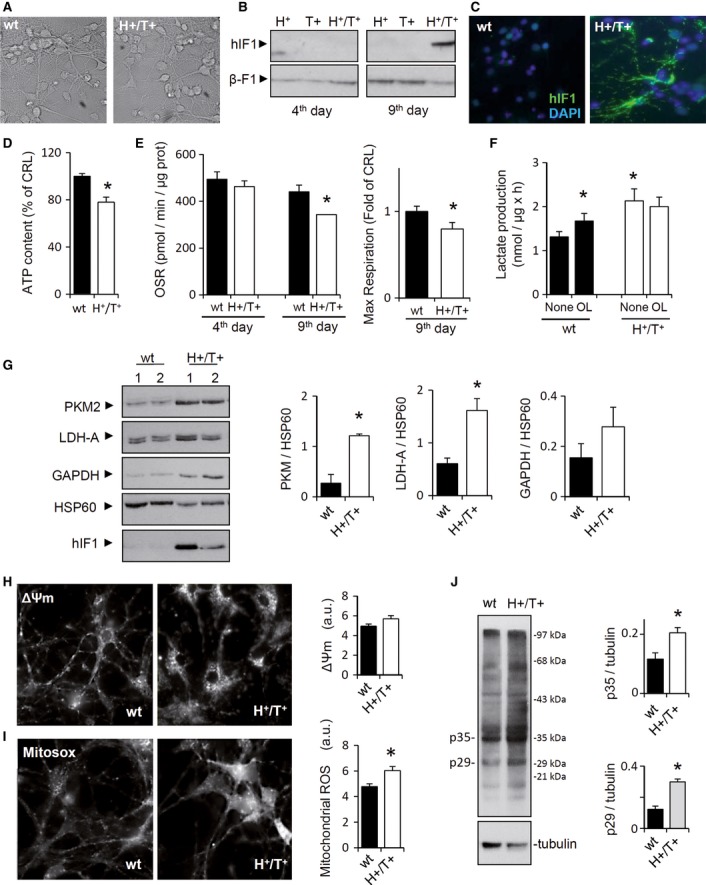
A–C In vivo phase-contrast images of 9-d cultures of cortical neurons obtained from control and H+/T+ embryos (A); magnification 40×. Representative Western blot (B) and immunocytochemistry (C) show the expression of hIF1 only in 9-d neurons of H+/T+ mice. β-F1-ATPase (β-F1) is used as a loading control. DAPI (4′,6-diamidino-2-phenylindole) staining is also shown. Magnification 40x.
D The cellular ATP content was determined in control (wt, closed bar) and H+/T+ (open bar) neuronal cultures.
E Shows the oligomycin-sensitive respiration (OSR) and maximal respiration in 4- and 9-day neuronal cultures from control (wt, closed bar) and H+/T+ (open bar) embryos.
F Rates of aerobic glycolysis (Lactate production) in the absence or presence of 5 μM oligomycin (OL).
G Representative Western blots of the expression of pyruvate kinase M2 (PKM2), lactate dehydrogenase A (LDH-A), glyceraldehyde-3-phosphate dehydrogenase (GAPDH), and heat-shock protein 60 (HSP60) in control (wt, closed bars) and hIF1-expressing (H+/T+, open bars) neurons.
H, I In vivo staining of TMRM+ (H, ΔΨm) or MitoSOX (I, ROS) charged mitochondria from 10-d primary cultures of cortical neurons. Magnification 40×.
J Representative experiment of carbonylation of proteins in primary neuronal cultures derived from control (wt) and H+/T+ mice. Tubulin is shown as a loading control. The migration of molecular mass markers is indicated to the right. Histograms show the quantification of p35 and p29 proteins.
Data information: The data shown are mean ± s.e.m. of three (D–F, H, and I) or four (G, J) cultures per condition. *P < 0.05 when compared to control by Student's t-test. See also Supplementary Figs S4, S5, and S6.
Source data are available online for this figure.
hIF1 mice are protected from quinolinic acid-induced brain damage
To assess the role of H+-ATP synthase in cell death in vivo, 1-year-old control and hIF1-expressing mice received an injection of quinolinic acid into the left striatal region of the brain (Martinez-Serrano & Bjorklund, 1996; Schwarcz et al, 2012). Weight loss after injury (Fig 4A), spleen volume contraction (Fig 4B), and enlargement of the ipsilateral ventricle (Fig 4C), which are respective indexes of general impairment of animal health, monocyte recruitment, and tissue loss, suggest that hIF1-expressing mice are partially protected from excitotoxicity. Hematoxylin–eosin-stained brain sections also revealed a significant approximately 50% reduction in the lesion area in H+/T+ mice (Fig 4D). The reduced expression of the neuronal markers DARPP-32 (Fig 4E) and NeuN (Supplementary Fig S7) in the brain of controls further supports a higher neuronal protection in H+/T+ mice. Quantification of microglia (Fig 4E, Iba-1, red staining and Supplementary Fig S8) and phagocytes (Fig 4E, Ed-1, green staining and Supplementary Fig S8) revealed a significant increase in gliosis in control when compared to H+/T+ mice, suggesting that hIF1 protects neurons from damage and hence from the subsequent local inflammation.
Figure 4. hIF1 protects from quinolinic acid-induced brain damage.

A, B Animal weight loss at the indicated time after surgery (A), and spleen weight at time of sacrifice (21st day) (B) in control (wt, closed squares and bar) and H+/T+ (open squares and bar) mice.
C Representative ventricular symmetry in sections of the brain from control (wt, closed bar) and H+/T+ (open bar) mice. Magnification 2.5×. The percentage increase in the ventricle area is shown.
D Brain sections stained with hematoxylin–eosin. Four different animals per condition tested are presented. The area of the lesion is indicated. Magnification 20×. Histograms show a reduction in the lesion area in H+/T+ mice (open bar) when compared to control (wt, closed bar) mice. Bars are the mean ± s.e.m. of five animals. D, dorsal; M, medial.
E Representative staining of nuclei (DAPI, blue), protein phosphatase 1 (DARPP-32, white), microglia (Iba-1, red), and macrophage/monocyte (Ed-1, green) by antibodies in the left hemisphere. Magnification 5×. Histograms show the quantification of fluorescence in controls (wt, closed bar) and H+/T+ (open bar) mice.
Data information: Bars are the mean ± s.e.m. of five (C–E) or ten (A, B) animals. Where indicated, numbers correspond to the identification code of the mouse. *P < 0.05 when compared to control by Student's t-test. See also Supplementary Figs S7, S8, and S9 and Supplementary Videos.
Neurological evaluation indicates a better performance in hIF1 mice
No differences in locomotor performance were observed between control and H+/T+ mice before quinolinic acid administration (Supplementary Fig S9A–F). However, three locomotor tests showed that H+/T+ mice are partially protected from quinolinic acid-induced damage (Supplementary Fig S9 and Supplementary videos for control and hIF1-expressing mice). Paw usage contralateral to the brain lesion (right) was significantly diminished in control animals when compared to H+/T+ mice (Supplementary Fig S9A). No differences were noted in the use of the ipsilateral forelimb (left) (Supplementary Fig S9B). Gate analysis revealed that control mice showed an increased stride length of the contralateral forelimb (Supplementary Fig S9C) and in the coefficient of variation for base width of the hind limbs (Supplementary Fig S9D) when compared to H+/T+ mice in the “footprint” test (Carter et al, 1999). After lesion, all animals showed an increase in the number of paw slips in the grid test (Brooks & Dunnett, 2009) but as early as 4 days post-surgery H+/T+ mice were able to walk through the grid with a significantly lower number of paw slips (Supplementary Fig S9E). The motility index of H+/T+ mice was unaltered by lesion (Supplementary Fig S9F). However, control mice were less prone to explore than H+/T+ mice, suggesting a severe motor impairment (Supplementary Fig S9F) (Supplemental videos for control and hIF1-expressing mice). Overall, H+/T+ mice showed lower deviation from presurgical values than control animals.
hIF1 protects from quinolinic acid-induced cell death
Fluoro-Jade B-positive neurons both in the core and in penumbra region of the lesion were significantly augmented in control when compared to H+/T+ mice (Fig 5A). Analysis of apoptotic cell death by the determination of caspase 3 activation confirmed that hIF1 expressing neurons were protected from apoptosis in the penumbra (Fig 5B). Most of the toxic cascades stimulated by quinolinic acid implicate the formation of ROS (Schwarcz et al, 2012). Consistently, the GSH content in the damaged hemisphere was highly reduced when compared to the non-stressed tissue (compare Fig 5C versus Fig 2E). Remarkably, both the GSH content and the GSH/GSSG ratio were significantly higher in the affected hemisphere of hIF1-expressing mice than in controls (Fig 5C).
Figure 5. The inhibition of the H+-ATP synthase protects neurons from apoptosis.
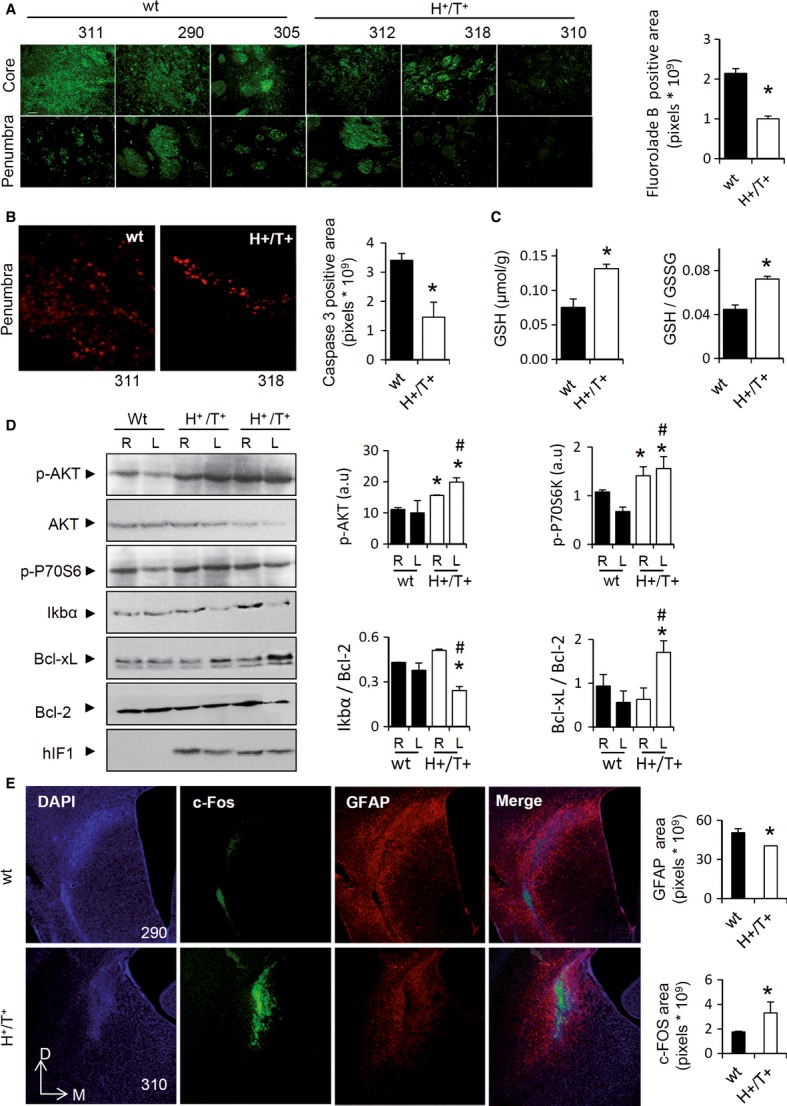
- Fluoro-Jade B staining in degenerating neurons in the core and penumbra of the striatal lesion. Three different images of animals identified by numbers are presented. Magnification 20×. Histograms show a reduction in the Fluoro-Jade B-positive area in H+/T+ (open bar) when compared to control (wt, closed bar) mice.
- Activated caspase 3 staining in the penumbra of the striatal lesion in control (wt, closed bars) and hIF1-expressing (H+/T+, open bars) mice. Magnification 20×. Histograms show a reduction in the apoptotic area in H+/T+ mice.
- Brain glutathione (GSH) content and GSH/GSSG ratio in the injured area of control (wt, closed bar) and H+/T+ (open bar) mice.
- Representative Western blots of the expression of protein kinase B (p-AKT, AKT), phospho p70 S6 kinase (p-P70S6), IkappaB alpha (IκBα), B-cell lymphoma-extra large (Bcl-xL), and B-cell lymphoma 2 (Bcl-2) in the right (R) and left (L) hemispheres of wt and H+/T+ mice. One control and two different H+/T+ animals are shown.
- DAPI (blue), c-Fos (green), and glial fibrillary acidic protein (GFAP, red) staining of brain slices of the left hemisphere after three weeks post-surgery. Magnification 5×. Histograms show the quantification of fluorescence in control (wt, closed bar) and H+/T+ (open bar) mice. D, dorsal; M, medial.
Data information: In (A–E), determinations were carried out at 21 day post-surgery. Bars are the mean ± s.e.m. of three (E), four (D), or five (A–C) animals. *#P < 0.05 when compared to the right or left hemisphere of controls, respectively.
Source data are available online for this figure.
hIF1 signals the activation of neuroprotection pathways
Phosphorylation of Akt is part of the survival signaling pathway induced in cells confronted with mitochondrial respiration defects and/or mild oxidative stress (Leslie, 2006; Pelicano et al, 2006). Consistently, the phosphorylation of Akt was significantly augmented in both brain hemispheres of mice expressing hIF1 (Fig 5D). We also observed an enhanced phosphorylation of the pro-survival p70S6K in both brain hemispheres (Fig 5D) and enhanced expression of c-fos in the damaged area of H+/T+ mice (Fig 5E). Moreover, the content of IκBα, which is the negative regulator of NFκB transcription factor, was significantly diminished in the damaged hemisphere of H+/T+ mice (Fig 5D). Changes in IkBα expression were paralleled by opposite changes in the expression of Bcl-xL, a downstream target of NFκB that is involved in preventing cell death (Fig 5D). In contrast, the expression of the anti-apoptotic Bcl-2 was not affected by hIF1 expression or by quinolinic acid administration (Fig 5D). Remarkably, the ATP and ADP content in the damaged area of the left hemisphere was much lower in H+/T+ mice (Fig 6A). In contrast, the AMP content was significantly increased (Fig 6A). The larger drop in ATP content of H+/T+ mice can be explained by the enforced hIF1-mediated inhibition of the synthase activity of the H+-ATP synthase, but could also result from higher activation of ATP-consuming reactions following the activation of repair mechanisms. This is consistent with a higher basal PARP activity in the brain of H+/T+ mice (Fig 6B), a difference that was magnified after hemispheric damage (Fig 6B).
Figure 6. Bcl-xL is involved in hIF1-mediated protection of neurons.

- Content of adenine nucleotides in the injured area of the left hemisphere of control (wt, closed bars) and hIF1-expressing (H+/T+, open bars) mice. *P < 0.05 when compared to control (wt) by Student's t-test.
- Representative Western blots of the polymer poly-ADP-ribose (PAR), the product of poly-ADP-ribose polymerase-1 (PARP-1) activity, in right (R) and left (L) hemispheres of control (wt, closed bars) and H+/T+ (open bars) mice. One control and two H+/T+ mice are shown. β-F1-ATPase expression is shown as loading control. Histograms show the quantification of PAR/β-F1 ratio. * and #: P < 0.05 when compared to the right or left hemisphere of controls, respectively.
- Effect of ROS scavenging (20 nM mito Q, MQ) on glutamate-primed cell death in neurons derived from control (wt, closed bars) and H+/T+ (open bar) mice.
- Blue-native immunoblot analysis of Bcl-xL immunoreactivity associated with complexes of mitochondrial OXPHOS. The migration of complex I (CI, NADH9), F0F1-ATPase (CV, β-F1-ATPase), and Bcl-xL in control (wt) and H+/T+ mice is indicated. The migration of molecular mass markers is indicated to the right.
- Effect of glutamate and 1 h of hypoxia on cell death in primary cultures of cortical neurons derived from control (wt, closed bars) and H+/T+ (open bar) mice. The silencing of Bcl-xL (siBcl-xL) using β-actin as loading control is illustrated.
Data information: Bars are the mean ± s.e.m. of three (B, C, E) or five (A) experiments. * and #: P < 0.05 when compared to control (wt) or to silencing control (H+/T+, siCRL).
Source data are available online for this figure.
ROS are involved in cell death
Consistent with the role of ROS in mediating neuronal excitotoxicity (Schwarcz et al, 2012), we observed that quenching ROS after glutamate-induced cell death significantly arrested cell death in primary neuronal cultures of control mice (Fig 6C). The cell death response to glutamate was much less in neurons of hIF1-expressing mice (Fig 6C). In fact, cell death was essentially the same as that of control neurons treated with the antioxidant mito Q (Fig 6C), presumably because the hIF1-mediated activation of the pro-survival signaling pathways (Figs 5D and 6B) confers a more resistant phenotype against ROS-mediated cell death.
Bcl-xL participates in hIF1-mediated protection of neuronal death
Blue-native gels confirmed the interaction of Bcl-xL with the H+-ATP synthase (Fig 6D), in agreement with recent findings (Alavian et al, 2011; Chen et al, 2011). However, and to our surprise, we found that Bcl-xL preferentially interacts with a native protein complex that migrates with complex I of the respiratory chain (Fig 6D). Remarkably, silencing of Bcl-xL in neurons restored the glutamate or hypoxia-driven cell death in preconditioned neurons of H+/T+ mice (Fig 6E), further supporting the role of the anti-apoptotic Bcl-xL in neuroprotection and eventually its cross-talk with the activity of the H+-ATP synthase.
Discussion
Herein, we demonstrate that the expression of hIF1 partially inhibits the H+-ATP synthase activity promoting rewiring of neuronal metabolism to an enhanced aerobic glycolysis. Inhibition of the H+-ATP synthase activates pathways to prevent apoptotic cell death. In other words, expression of hIF1 induces a state of preconditioning that prevents neuronal death after excitotoxic damage as assessed both in vivo and in primary cultures. These findings provide the first in vivo account highlighting the relevance of rewiring energy metabolism in brain preconditioning, and stress the potential value of the H+-ATP synthase as a target for therapeutic intervention. Moreover, the transgenic H+ mouse developed offers a valuable tool to investigate the relevance of OXPHOS impairments in mammalian tissues in vivo. Until recently, IF1 was considered an inhibitor of the hydrolase activity of the ATP synthase that helps to preserve cellular ATP during hypoxia or ischemia (Gledhill et al, 2007; Faccenda et al, 2013). However, previous in vitro studies (Husain & Harris, 1983; Lippe et al, 1988) and more recent findings in vivo (Shen et al, 2009; Sanchez-Cenizo et al, 2010; Formentini et al, 2012; Sanchez-Arago et al, 2013b) have stressed the role of IF1 as an inhibitor of the synthase activity of the H+-ATP synthase. The results in this study demonstrate the in vivo function of hIF1 as an inhibitor of the ATP synthase and of cell death.
Since we also observed a down-regulation of respiration and of the activity and assembly of complex IV, it can be argued that hIF1 exerts neuroprotection by its effect on the activity of the respiratory chain rather than on the ATP synthase. However, this explanation seems unlikely because the impairment of the respiratory chain is detrimental for cell survival. In fact, very recent findings (Cogliati et al, 2013) have highlighted that the disassembly of respiratory chain supercomplexes leads to an increase and not to a decrease in cell death, in agreement with our observation. Hence, we suggest that the effects of hIF1 on respiration result from feedback regulation of complex IV activity/assembly by the inhibition of the ATP synthase, although the mechanism involved deserves further investigation. However, we cannot rule out that hIF1 might be controlling the execution of cell death by regulating cristae remodeling (Cogliati et al, 2013; Faccenda et al, 2013) (Fig 7G). It is well established that dimers of the H+-ATP synthase promote the high local curvature of the inner membrane at cristae ridges (Paumard et al, 2002; Davies et al, 2011, 2012). Recently, the genetic disruption of cristae shape morphology has been shown to favor apoptosis (Cogliati et al, 2013), providing a link between mitochondrial morphology and cell death. In this regard, it has been suggested that IF1 regulates the oligomeric state of the H+-ATP synthase, increasing the density of cristae and the formation of dimeric ATP synthase complexes (Minauro-Sanmiguel et al, 2005; Garcia et al, 2006; Campanella et al, 2008; Bisetto et al, 2013). Although this suggestion has been questioned (Tomasetig et al, 2002; Wittig & Schagger, 2009; Fujikawa et al, 2012), it is possible that the overexpression of hIF1 might contribute to stabilize cristae structure, hence upgrading, at the structural level, the threshold for cell death (Fig 7G).
Figure 7. IF1 expression in human brain.
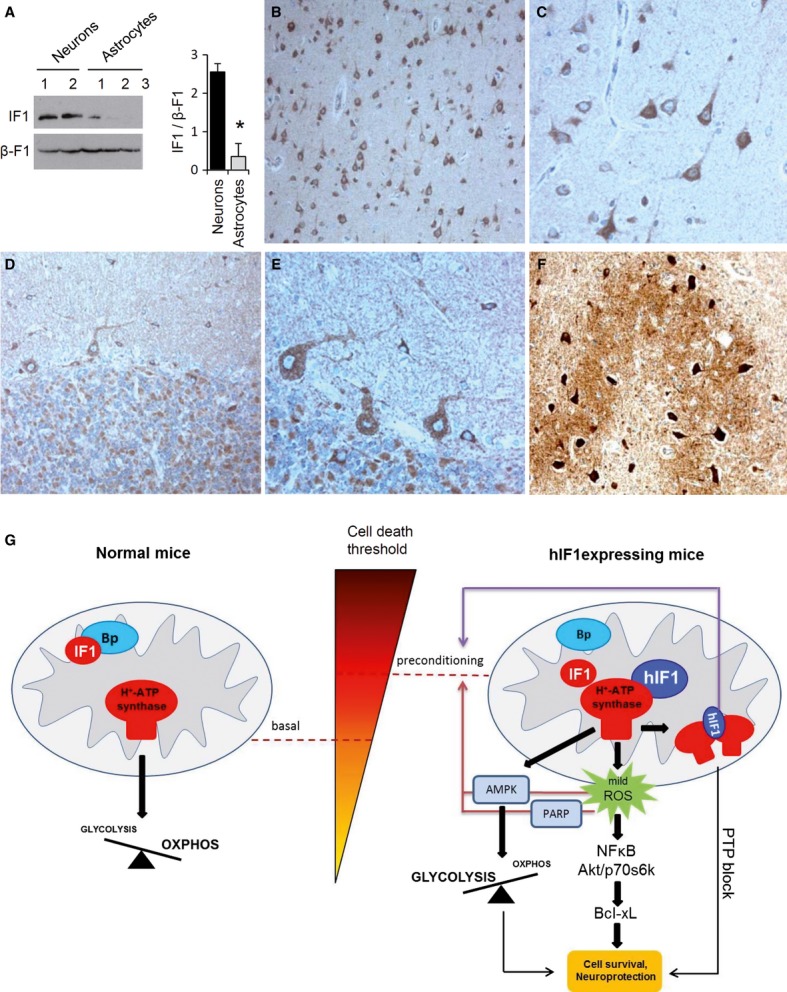
A Western blots of the expression of IF1 in fractionated proteins from mouse neurons and astrocytes using the commercial anti-mouse IF1. β-F1-ATPase (β-F1) expression is shown as a loading control. Histograms show the quantification of the IF1/β-F1 ratio. The data shown are the mean ± s.e.m. of 3–4 preparations. *P < 0.05 when compared to neuronal expression by Student's t-test.
B, C Immunocytochemistry of hIF1 in human cerebral cortex. Note IF1 immunolabeling in cortical neurons of the parieto-occipital cortex and the negative labeling of astrocytes. Magnification 20× (B) and 63× (C).
D–F Immunocytochemistry for IF1 in human cerebellar sections. Positive immunolabeling for hIF1 in Purkinje cells, granular neurons, and Golgi type II neurons (D, E), and strong hIF1 immunolabeling in neurons of the cerebellar dentate nucleus (F). Magnifications: 20× (D), 63× (E), and 20× (F).
G The schematic illustrates the role of overexpression of hIF1 in preconditioning of the brain. In normal mice, the IF1 present is non-functional as relevant repressor of the synthetic activity of the H+-ATP synthase either by its binding to a putative receptor (Bp) and/or because of covalent modifications of the protein. The overexpression of hIF1 with higher affinity for β-F1-ATPase partially interferes with OXPHOS and promotes an enhanced glycolysis and a mild ROS signal that activates in the nucleus pathways of survival and repair enhancing the threshold level required to execute cell death. In addition, hIF1 overexpression might affect the dimerization of the H+-ATP synthase that is involved in PTP formation. The metabolic (red arrows) and structural (violet arrow) pathways of brain preconditioning are highlighted. Upon administration of a death stimuli hIF1 inhibits more effectively the synthase activity of the H+-ATP synthase than endogenous IF1. By a mechanism that remains to be discovered, IF1 prevents PTP opening and extensive neuronal cell death. See also Supplementary Fig S10.
Source data are available online for this figure.
Energy metabolism in neurons is highly dependent on OXPHOS. Unexpectedly, H+/T+ mice revealed no symptoms of neurological dysfunction. It is likely that the energy deficit triggered by a limited OXPHOS promotes the activation of the metabolic stress sensor AMPK (Mihaylova & Shaw, 2011) and the subsequent activation of aerobic glycolysis to partially compensate ATP provision in these neurons. It is really intriguing to find that tissues that have a very high energy demand, such as heart, liver, and kidney, are those that express higher levels of IF1 (Sanchez-Cenizo et al, 2010; Sanchez-Arago et al, 2013b). Mouse (Fig 7A) and human neurons of the brain and cerebellum (Fig 7B–F and Supplementary Fig S10) are not an exception showing a very high expression of IF1 when compared to astrocytes. Therefore, we suggest that the actual physiological function of IF1 in normal energy-demanding tissues is to ameliorate apoptosis geared by the activity of the H+-ATP synthase under cellular stressful conditions. This hypothesis is supported by previous findings in different cancer cells (Sanchez-Cenizo et al, 2010; Formentini et al, 2012; Faccenda et al, 2013; Sanchez-Arago et al, 2013b). Obviously, this idea further supports that in addition to the well-characterized pH-regulated binding of IF1 to the H+-ATP synthase under depolarization conditions (Cabezon et al, 2000), the activity of IF1 is regulated in these tissues by additional mechanisms that could involve the interaction of IF1 with other proteins (Lopez-Mediavilla et al, 1993) (Fig 7G) and/or tissue-specific post-translational modifications (Zhao et al, 2011).
Inhibition of the synthase activity of the H+-ATP synthase by IF1 is known to promote a mild ROS signal (Formentini et al, 2012; Sanchez-Arago et al, 2013b), which is consistent with the observed inhibition of the H+-ATP synthase, the enhanced production of ROS in neuronal cultures, and the increased carbonylation of brain and neuronal proteins in hIF1-expressing mice (Fig 7G). ROS are known activators of several of the pro-survival signaling pathways that we have shown to be activated in the brain of H+/T+ mice such as Akt/p70S6K (Datta et al, 1997; Harada et al, 2001) and NFκB (Ravati et al, 2001; Karin, 2006). The persistent mild oxidative stress in the brain of these animals could represent an additional mechanism involved in preconditioning (Iadecola & Anrather, 2011) by raising, at the functional level, the threshold at which a toxic insult will normally unlash the molecular events that trigger cell death (Fig 7G). Indeed, we have observed that quenching ROS largely inhibits glutamate-induced neuronal cell death only in non-preconditioned cultures. The finding that IF1 protects cancer cells from chemotherapy-induced apoptosis via ROS-mediated signaling (Formentini et al, 2012; Sanchez-Arago et al, 2013b) further supports this idea.
Importantly, our data show that hIF1-expressing neurons in the injured area are partially protected from cell death when compared to controls despite showing remarkably lower ATP and ADP concentrations. Hence, we suggest that either the set-point of ATP availability for triggering cell death has not been reached (Galluzzi et al, 2012) or that the flux at which ATP is being produced by the stimulation of aerobic glycolysis is enough to preserve cellular functions. An enhanced activity of ATP-consuming reactions such as the induction of protein synthesis revealed by the activation of p70S6K and of repair pathways by the activation of PARP in hIF1-expressing neurons might also contribute to the depletion of the phosphorylated nucleotides in these animals. Taken as a whole, our findings indicate that a sustained partial inhibition of OXPHOS mediates the activation of protein synthesis, the induction of repair mechanisms, and the prevention of apoptosis. Three behavioral locomotor tests confirm that hIF1-expressing mice show milder neurological impairment after injury.
Under conditions of cellular stress induced by different chemotherapeutic agents, the mitochondrial H+-ATP synthase generates a high-intensity ROS signal that triggers apoptotic cell death (Johnson et al, 2005; Santamaria et al, 2006; Wondrak, 2009). Recent findings indicate that the H+-ATP synthase forms part of the PTP (Bonora et al, 2013; Giorgio et al, 2013), stressing previous functional reports on the relevance of this complex of OXPHOS in cell death (Matsuyama et al, 1998; Shchepina et al, 2002; Santamaria et al, 2006) and the tangled circuitry of energy metabolism and apoptosis (Andersen & Kornbluth, 2013). Bcl-xL is the prevailing anti-apoptotic protein in the brain (Alavian et al, 2011; Michels et al, 2013). We suggest that the overexpression of Bcl-xL after induced excitotoxicity in the brain in vivo mediates the prevention of cell death, consistent with previous findings in cancer cells (Formentini et al, 2012; Sanchez-Arago et al, 2013b) and with the fact that the silencing of Bcl-xL reverted the protection afforded by IF1 overexpression. Moreover, Bcl-xL is also localized at the inner mitochondrial membrane where it interacts with the H+-ATP synthase to enhance its activity by reducing futile ion cycling (Alavian et al, 2011; Chen et al, 2011). Herein, we have confirmed this interaction. We suggest that Bcl-xL might act as an additional regulator of the PTP, acting as the molecular bridge that links events at the inner and outer mitochondrial membranes. In fact, the silencing of Bcl-xL abrogates the pro-survival effect of the inhibition of the H+-ATP synthase mediated by hIF1. Moreover, the finding that Bcl-xL also interacts with other complexes of the respiratory chain, presumably complex I, broadens the biological relevance of this anti-apoptotic protein in the regulation of mitochondrial physiology and cellular metabolism.
CryoEM studies of the macromolecular organization of the inner membrane reveal no interaction between complex I and the H+-ATP synthase (Davies et al, 2011). However, cyclophilin D that favors PTP opening binds to and regulates the activity of the H+-ATP synthase (Giorgio et al, 2009) and affects modulation of PTP by rotenone (Li et al, 2012). These findings suggest that the metabolic and/or the structural preconditioning mediated by hIF1 increases the threshold of PTP opening by preventing the channel formation capacity of the H+-ATP synthase (Giorgio et al, 2013) (Fig 7G). Overall, our data provide the first in vivo demonstration that the activity of the H+-ATP synthase is necessary for the efficient execution of cell death. Hence, the H+-ATP synthase not only functions as the power plant of the cell but also as a pivotal regulator of cell death.
Materials and Methods
Transgenic animals
The pCMV-SPORT6-H49K plasmid (Sanchez-Cenizo et al, 2010) containing the H49K mutant version of human IF1 was PCR-amplified and the PCR product assembled into the pTRE2hyg vector (Clontech Laboratories Inc.) into the BamHI and Notl restriction sites. The TRE2hyg-H49K plasmid was digested with SexAI/BsrBI (New England Biolabs), and the 2.5-Kb DNA fragment of interest was purified with Elu-Quik kit (Shleicher & Schuell). Transgenic mice (TRE-H49K-25, H+) were obtained by pronuclear microinjection of the construct by the Servicio de Trangenesis of the CNB/CBMSO (UAM, Madrid, Spain), using standard protocols. Integration of the construct was confirmed by PCR (forward, 5′-CACAGAGTAGAGAACAACTG-3′; reverse, 5′-GTTAGTAGCACACAGACAAA-3′). The Bl6-Tg(Camk2a-tTa)1Mmay/J mice (T+) expressing the transactivator tTA in neurons (Mayford et al, 1996) were used. The Tet-Off double transgenic animals (H+/T+) were obtained by breeding H+ and T+ mice. Animals were maintained on the C57/Bl6 genetic background. To turn off the expression of hIF1, double transgenic mice were administered doxycyclin (2 mg/ml) in the drinking water for 15 days. Animal experiments were carried out after approval of the Institutional Review Board (Ethical Committee of the UAM, CEI-24-571) in compliance with animal policies and ethical guidelines of the European Community.
Brain mitochondria
Adult mice brain mitochondria were prepared after the permeabilization of synaptosomes with 100 μM digitonine. The purity of mitochondrial preparations was assessed by Western blotting. Oxygen consumption rates in isolated mitochondria (200 μg protein) were determined in a Clark-type electrode. Glutamate plus malate (10 mM) were used as respiratory substrates in the presence or absence of 0.5 mM ADP, 6 μM OL, 5 μM FCCP, and 1 μM antimycin A. The composition of the respiration buffer is 75 mM mannitol, 25 mM sucrose, 20 mM Tris–HCl, 5 mM phosphate, 0.3 mM EGTA, 0.5 mM EDTA, 100 mM KCl, 0.1% BSA, pH 7.4.
For the determination of the mitochondrial membrane potential, approximately 100 μg of mitochondria were charged with 100 nM TMRM+ (Life Technologies). Changes in fluorescence were recorded using an Aminco-Bowman Series 2 Luminescence Spectrometer after the addition of the following compounds (final concentration): 10 mM succinate, 1 mM ADP, 6 μM OL, 5 μM FCCP, 2 μM rotenone, and 1 μM antimycin A.
Primary cultures of cortical neurons
Cerebral cortices were dissected from fetal mice at 16–17 days of gestation in neurobasal medium (NB) using the Papain Dissociation System kit (Worthington). Disrupted cortices were resuspended in NB supplemented with 10% HS and 2 mM glutamine. After 4–5 days in culture, non-neuronal cell division was halted by the addition of 3 mM cytosine arabinoside for 24 h. Neurons were identified evaluating their morphology and positive immunoreactivity to Neu-N antibody (Chemicon International Inc.; 1:1,000) and studied at 9–11 days of culture. Lack of staining with an anti-glial fibrillary acidic protein GFAP (Dako Cytomation; 1:1,000) revealed the absence of astrocytes in cell cultures.
The rates of lactate production and of oxygen consumption (XF24 Extracellular Flux Analyzer, Seahorse Bioscience) were determined (Sanchez-Cenizo et al, 2010). The final concentration and order of injected substances was 6 μM OL, 0.75 mM dinitrophenol (DNP), 1 μM rotenone, and 1 μM antimycin A.
For the determination of the ΔΨm and ROS levels, 100 nM TMRM+ or 2.5 μM MitoSOX™ (Life Technologies) was, respectively, used in “redistribution mode” (Duchen et al, 2003). The fluorescence was analyzed by confocal microscopy using a Biorad Radiance 2000 Zeiss Axiovert S100TV using red (590/617 nm) excitation/emission wavelengths and quantified using ImageJ software. Fluorescence intensity was quantified by removing background signal and measuring the mean fluorescence intensity in the pixels containing mitochondria in approximately the same number of cells and at least in 15 different fields per condition tested. Six micromolar OL, 2 μM rotenone, 1 μM antimycin A, and 5 μM FCCP were used.
Neuron transfection was done using Effectene Transfection Reagent (Qiagen) with control or Bcl-xL plasmid (Switchgear Genomics Inc.). For the determination of cell death, neurons were treated with 25 μM glutamate (Sigma-Aldrich) for 5 min or deprived of oxygen for 1 h (1% O2) in a Hypoxic Workstation H35 (Don Whitley Scientific). Neurons were incubated for 24 h in the absence or presence of 20 nM Mito Q and then processed by confocal microscopy in vivo at 37°C and 5% CO2 using an Axioskop2-plus vertical microscope (Zeiss) coupled to a ccd color camera. Propidium iodide (2 μM) and calcein (1 μM) were utilized to determine cell death and viability, respectively. The number of cells was quantified in 20 fields per treatment using ImageJ software.
Adenine nucleotides
Adenine nucleotides were extracted from frozen brain powder with a 6% perchloric acid solution. Determination of ATP, ADP, and AMP in frozen brain powder was carried out by standard enzymatic procedures. The ATP concentration in primary cultures was determined using the ATP Bioluminescence Assay Kit CLS II (Roche).
Protein electrophoresis, Western blotting, and protein carbonylation
Protein samples from brain and cellular extracts were fractionated on SDS–PAGE. Details of the antibodies used in Western blots are provided in Supplementary Information. For the determination of protein carbonylation, the Oxyblot Oxidized Protein Detection kit (Chemicon International Inc.) was used.
Blue-native (BN) PAGE
Protein extracts (250 μg) from control or H+/T+ mice brain mitochondria were solubilized in BN-loading buffer. 1 g of n-dodecyl β-D-maltoside/g protein was added to the samples and protein complexes were fractionated in BN gels after the addition of 2.5 μl of the Coomassie dye suspension. Electrophoresis was performed in “deep blue” cathode buffer B at constant voltage of 70 V until one-third of the whole electrophoresis run. Buffer B was then exchanged with the buffer “light blue.” Electrophoresis was performed for other 12 h at 70 V and then 3 h at 200 V. BN-loading buffer: 50 mM NaCl, 1 mM EDTA, 5 mM 6-aminocaproic acid, 2% PMSF, 50 mM imidazole/HCl pH 7.0. BN gels: acrylamide/bisacrylamide ratio ranging from 3% to 13% w/v, 0.5 M 6-aminocaproic acid, and 25 mM imidazole. Coomassie dye suspension (5% SBG dye in 500 mM aminocaproic acid). Anode buffer: 25 mM imidazole, pH 7.0. “Deep blue” cathode buffer B: 50 mM tricine, 7.5 mM imidazole, 0.02% Serva Blue G (SBG), pH 7.0. “Light blue” cathode buffer B/10: the cathode buffer B with a ten times lower dye concentration (0.002% SBG).
Determination of enzyme activities
Brain mitochondria resuspended in respiration buffer containing 1% Triton X-100 were used for the spectrophotometric determination of complexes I, II+III, IV, and V activities as described (Barrientos et al, 2009).
Glutathione determination
The brain GSH and GSSG concentrations were determined using the Glutathione Assay Kit (BioVision Inc.).
Animal surgery and histology
One-year-old control (n = 10) and H+/T+ (n = 10) male mice were used for surgery. To induce excitotoxic damage, all animals received a single 0.5 μl dose of 20 nmol of quinolinic acid by stereotaxical injection into the left striatum. Coordinates (mm) AP (anteroposterior from bregma) = +0.25, ML = 2.75, D-V (vertical from dura) = −2.5 at a speed of 1 μl/min. The right hemisphere did not receive any surgery and served as histological control. Twenty days after the lesion, mice were sacrificed, transcardially perfused with 3% paraformaldehyde, and cryoprotected with 30% sucrose. Sections (30 μm thick) were taken in the coronal plane, stained with hematoxylin–eosin, and processed for immunohistochemistry.
Evaluation of animal behavior
Animal behavior was evaluated by footprint, grid, and cylinder tests in a blinded way before surgery and every 3 days post-surgery until day of sacrifice (21th day). Gait abnormalities were detected by analysis of motor coordination and synchrony using the “footprint” test (Carter et al, 1999). Briefly, fore and hind paws were dipped into water-soluble ink of different colors and animals were left free to walk over absorbent paper in a straight line. Analysis included measurement of stride length, width of the base of support for the hind limbs, and paw angle (fore and hind). Gait variability was studied using the coefficient of variation (CV) calculated from the equation 100 × standard deviation/mean value. For the grid test: Mice were left free to walk across a horizontal grid (size: 20 × 30 cm, 10 mm wire mesh). The number of ipsilateral and contralateral paw slips through the grid was counted and the motility index was calculated from the equation: percentage of the time spent moving/(number of foot faults + number of stops) (Brooks & Dunnett, 2009). For the cylinder test: Mice were placed in a perspex cylinder (9-cm diameter, 15-cm tall) for 5 min and recorded with a video camera. Paw usage was studied by measuring the number of forelimb wall contacts made with each paw when rearing (Brooks & Dunnett, 2009). Data are presented as number of contacts per minute for left, right, and both forepaws simultaneously.
Immunofluorescence/confocal microscopy and immunohistochemistry
Free-floating brain slices were incubated with blocking buffer (3% BSA and 0.1% Triton X-100 in PBS) for 1 h at RT and then incubated overnight at 4°C with the primary antibodies specified.
The primary antibodies used were: anti-NeuN (1:100) and Fluoro-Jade B (0.001%) from Millipore Bioscience Research Reagents; anti-GFAP (1:1,000) from Dako Cytomation; anti-Iba-1 (1:500) from Wako; anti-Ed-1 (1:100) and anti-c-fos (1:100) from Santa Cruz Biotechnology, Inc.; anti-DARP-32 (1:500) from Chemicon International Inc.; and anti-caspase-3 (1:100) from Cell Signaling Technology Inc. Secondary Cy-3/Cy-5/Cy-2-conjugated antibodies were used (Millipore Bioscience Research Reagents). Cellular fluorescence was analyzed by confocal microscopy using a Biorad Radiance 2000 Zeiss Axiovert S100TV using green (498/516 nm), red (590/617 nm), or blue (642/661 nm) excitation/emission wave lengths. The area and intensity of fluorescence were quantified by ImageJ software.
Mice brain slices were incubated in 3% H2O2 in methanol for 10 min at room temperature to block the endogenous peroxidase activity. Antigens were retrieved by incubation in Dako Retrieval Solution (Dako Cytomation) for 2 min at 98°C. The anti-IF1 (1:200) and anti-β-F1-ATPase (1:20,000) were used for immunohistochemistry using the peroxidase-based EnVisionTM FLEX Mini kit High pH (Dako Cytomation). Specimens were then incubated with diaminobenzidine chromogenic substrate (Dako Cytomation) for 5 min at room temperature. To assess the expression of IF1 in human brain, 3-μm paraffin sections obtained from post-mortem CNS specimens from a patient with no neurological disease were processed for immunocytochemistry. Sections were automatically deparaffinized and immunostained with an Autostainer Link instrument from Dako (Carpinteria). Antigenic retrieval was performed at low pH, incubated with anti-IF1 at 1/100 dilution for 30 min, and visualized with EnVision Flex system from Dako (Carpinteria). Sections were observed with a Leica DMRE light microscope.
Statistical analysis
Statistical analyses were performed using a two-tailed Student's t-test. ANOVA with post hoc Dunnett's test was used for multiple comparisons to the control, using the SPSS 17.0 software package. The results shown are means ± s.e.m. A P < 0.05 was considered statistically significant.
Acknowledgments
We thank Michael P. Murphy (Medical Research Council, UK) for kindly supplying mitoQ. The authors acknowledge the technical support provided by M. Chamorro, C. Nuñez de Arenas, E. Casas, C. Cuevas, and Z. Ortega. LF is supported by “Fundación de la Asociación Española Contra el Cáncer” (AECC). This work was supported by grants from the MEC (BFU2010-18903), CIBERER and by Comunidad de Madrid (S2011/BMD-2402) to JMC; MINECO (PLE2009-0101 and SAF2010-17167), TerCel (RD12/0019/0013), and Neurostem-CM (S2010-BMD-2336) to AMS and ISCIII Grant PI 10/02628 to CN, Spain. The CBMSO receives an institutional grant from Fundación Ramón Areces.
Author contributions
LF and JMC designed research; LF, MPP, LSC, FS, JJL, and CN performed research; LF, MPP, CN, AMS, and JMC analyzed data; LF and JMC wrote the paper.
Conflict of interest
The authors declare no conflict of interest.
Supplementary information for this article is available online: http://emboj.embopress.org
References
- Acin-Perez R, Fernandez-Silva P, Peleato ML, Perez-Martos A, Enriquez JA. Respiratory active mitochondrial supercomplexes. Mol Cell. 2008;32:529–539. doi: 10.1016/j.molcel.2008.10.021. [DOI] [PubMed] [Google Scholar]
- Alavian KN, Li H, Collis L, Bonanni L, Zeng L, Sacchetti S, Lazrove E, Nabili P, Flaherty B, Graham M, Chen Y, Messerli SM, Mariggio MA, Rahner C, McNay E, Shore GC, Smith PJ, Hardwick JM, Jonas EA. Bcl-x(L) regulates metabolic efficiency of neurons through interaction with the mitochondrial F(1)F(O) ATP synthase. Nat Cell Biol. 2011;13:1224–1233. doi: 10.1038/ncb2330. [DOI] [PMC free article] [PubMed] [Google Scholar]
- Andersen JL, Kornbluth S. The tangled circuitry of metabolism and apoptosis. Mol Cell. 2013;49:399–410. doi: 10.1016/j.molcel.2012.12.026. [DOI] [PMC free article] [PubMed] [Google Scholar]
- Barrientos A, Fontanesi F, Diaz F. Evaluation of the mitochondrial respiratory chain and oxidative phosphorylation system using polarography and spectrophotometric enzyme assays. Curr Protoc Hum Genet. 2009;19 doi: 10.1002/0471142905.hg1903s63. Unit19 13. [DOI] [PMC free article] [PubMed] [Google Scholar]
- Bisetto E, Comelli M, Salzano AM, Picotti P, Scaloni A, Lippe G, Mavelli I. Proteomic analysis of F1F0-ATP synthase super-assembly in mitochondria of cardiomyoblasts undergoing differentiation to the cardiac lineage. Biochim Biophys Acta. 2013;1827:807–816. doi: 10.1016/j.bbabio.2013.04.002. [DOI] [PubMed] [Google Scholar]
- Bonora M, Bononi A, De Marchi E, Giorgi C, Lebiedzinska M, Marchi S, Patergnani S, Rimessi A, Suski JM, Wojtala A, Wieckowski MR, Kroemer G, Galluzzi L, Pinton P. Role of the c subunit of the FO ATP synthase in mitochondrial permeability transition. Cell Cycle. 2013;12:674–683. doi: 10.4161/cc.23599. [DOI] [PMC free article] [PubMed] [Google Scholar]
- Brooks SP, Dunnett SB. Tests to assess motor phenotype in mice: a user's guide. Nat Rev Neurosci. 2009;10:519–529. doi: 10.1038/nrn2652. [DOI] [PubMed] [Google Scholar]
- Cabezon E, Butler PJ, Runswick MJ, Walker JE. Modulation of the oligomerization state of the bovine F1-ATPase inhibitor protein, IF1, by pH. J Biol Chem. 2000;275:25460–25464. doi: 10.1074/jbc.M003859200. [DOI] [PubMed] [Google Scholar]
- Campanella M, Casswell E, Chong S, Farah Z, Wieckowski MR, Abramov AY, Tinker A, Duchen MR. Regulation of mitochondrial structure and function by the F1Fo-ATPase inhibitor protein, IF1. Cell Metab. 2008;8:13–25. doi: 10.1016/j.cmet.2008.06.001. [DOI] [PubMed] [Google Scholar]
- Carter RJ, Lione LA, Humby T, Mangiarini L, Mahal A, Bates GP, Dunnett SB, Morton AJ. Characterization of progressive motor deficits in mice transgenic for the human Huntington's disease mutation. J Neurosci. 1999;19:3248–3257. doi: 10.1523/JNEUROSCI.19-08-03248.1999. [DOI] [PMC free article] [PubMed] [Google Scholar]
- Chen YB, Aon MA, Hsu YT, Soane L, Teng X, McCaffery JM, Cheng WC, Qi B, Li H, Alavian KN, Dayhoff-Brannigan M, Zou S, Pineda FJ, O'Rourke B, Ko YH, Pedersen PL, Kaczmarek LK, Jonas EA, Hardwick JM. Bcl-xL regulates mitochondrial energetics by stabilizing the inner membrane potential. J Cell Biol. 2011;195:263–276. doi: 10.1083/jcb.201108059. [DOI] [PMC free article] [PubMed] [Google Scholar]
- Chivasa S, Tome DF, Hamilton JM, Slabas AR. Proteomic analysis of extracellular ATP-regulated proteins identifies ATP synthase beta-subunit as a novel plant cell death regulator. Mol Cell Proteomics. 2011;10 doi: 10.1074/mcp.M110.003905. M110 003905. [DOI] [PMC free article] [PubMed] [Google Scholar]
- Cogliati S, Frezza C, Soriano ME, Varanita T, Quintana-Cabrera R, Corrado M, Cipolat S, Costa V, Casarin A, Gomes LC, Perales-Clemente E, Salviati L, Fernandez-Silva P, Enriquez JA, Scorrano L. Mitochondrial cristae shape determines respiratory chain supercomplexes assembly and respiratory efficiency. Cell. 2013;155:160–171. doi: 10.1016/j.cell.2013.08.032. [DOI] [PMC free article] [PubMed] [Google Scholar]
- Datta SR, Dudek H, Tao X, Masters S, Fu H, Gotoh Y, Greenberg ME. Akt phosphorylation of BAD couples survival signals to the cell-intrinsic death machinery. Cell. 1997;91:231–241. doi: 10.1016/s0092-8674(00)80405-5. [DOI] [PubMed] [Google Scholar]
- Davies KM, Anselmi C, Wittig I, Faraldo-Gomez JD, Kuhlbrandt W. Structure of the yeast F1Fo-ATP synthase dimer and its role in shaping the mitochondrial cristae. Proc Natl Acad Sci USA. 2012;109:13602–13607. doi: 10.1073/pnas.1204593109. [DOI] [PMC free article] [PubMed] [Google Scholar]
- Davies KM, Strauss M, Daum B, Kief JH, Osiewacz HD, Rycovska A, Zickermann V, Kuhlbrandt W. Macromolecular organization of ATP synthase and complex I in whole mitochondria. Proc Natl Acad Sci USA. 2011;108:14121–14126. doi: 10.1073/pnas.1103621108. [DOI] [PMC free article] [PubMed] [Google Scholar]
- Dey R, Moraes CT. Lack of oxidative phosphorylation and low mitochondrial membrane potential decrease susceptibility to apoptosis and do not modulate the protective effect of Bcl-x(L) in osteosarcoma cells. J Biol Chem. 2000;275:7087–7094. doi: 10.1074/jbc.275.10.7087. [DOI] [PubMed] [Google Scholar]
- Di Lisa F, Carpi A, Giorgio V, Bernardi P. The mitochondrial permeability transition pore and cyclophilin D in cardioprotection. Biochim Biophys Acta. 2011;1813:1316–1322. doi: 10.1016/j.bbamcr.2011.01.031. [DOI] [PubMed] [Google Scholar]
- Duchen MR, Surin A, Jacobson J. Imaging mitochondrial function in intact cells. Methods Enzymol. 2003;361:353–389. doi: 10.1016/s0076-6879(03)61019-0. [DOI] [PubMed] [Google Scholar]
- Faccenda D, Tan CH, Seraphim A, Duchen MR, Campanella M. IF1 limits the apoptotic-signalling cascade by preventing mitochondrial remodelling. Cell Death Differ. 2013;20:686–697. doi: 10.1038/cdd.2012.163. [DOI] [PMC free article] [PubMed] [Google Scholar]
- Formentini L, Sánchez-Aragó M, Sánchez-Cenizo L, Cuezva JM. The mitochondrial ATPase Inhibitory Factor 1 (IF1) triggers a ROS-mediated retrograde pro-survival and proliferative response. Mol Cell. 2012;45:731–742. doi: 10.1016/j.molcel.2012.01.008. [DOI] [PubMed] [Google Scholar]
- Fujikawa M, Imamura H, Nakamura J, Yoshida M. Assessing the actual contribution of IF1, an inhibitor of mitochondrial FoF1, to ATP homeostasis, cell growth, mitochondrial morphology and cell viability. J Biol Chem. 2012;287:18781–18787. doi: 10.1074/jbc.M112.345793. [DOI] [PMC free article] [PubMed] [Google Scholar]
- Galluzzi L, Blomgren K, Kroemer G. Mitochondrial membrane permeabilization in neuronal injury. Nat Rev Neurosci. 2009;10:481–494. doi: 10.1038/nrn2665. [DOI] [PubMed] [Google Scholar]
- Galluzzi L, Kepp O, Kroemer G. Mitochondria: master regulators of danger signalling. Nat Rev Mol Cell Biol. 2012;13:780–788. doi: 10.1038/nrm3479. [DOI] [PubMed] [Google Scholar]
- Garcia JJ, Morales-Rios E, Cortes-Hernandez P, Rodriguez-Zavala JS. The inhibitor protein (IF1) promotes dimerization of the mitochondrial F1F0-ATP synthase. Biochemistry. 2006;45:12695–12703. doi: 10.1021/bi060339j. [DOI] [PubMed] [Google Scholar]
- Giorgio V, Bisetto E, Soriano ME, Dabbeni-Sala F, Basso E, Petronilli V, Forte MA, Bernardi P, Lippe G. Cyclophilin D modulates mitochondrial F0F1-ATP synthase by interacting with the lateral stalk of the complex. J Biol Chem. 2009;284:33982–33988. doi: 10.1074/jbc.M109.020115. [DOI] [PMC free article] [PubMed] [Google Scholar]
- Giorgio V, von Stockum S, Antoniel M, Fabbro A, Fogolari F, Forte M, Glick GD, Petronilli V, Zoratti M, Szabo I, Lippe G, Bernardi P. Dimers of mitochondrial ATP synthase form the permeability transition pore. Proc Natl Acad Sci USA. 2013;110:5887–5892. doi: 10.1073/pnas.1217823110. [DOI] [PMC free article] [PubMed] [Google Scholar]
- Gledhill JR, Montgomery MG, Leslie AG, Walker JE. How the regulatory protein, IF(1), inhibits F(1)-ATPase from bovine mitochondria. Proc Natl Acad Sci USA. 2007;104:15671–15676. doi: 10.1073/pnas.0707326104. [DOI] [PMC free article] [PubMed] [Google Scholar]
- Gross A, Pilcher K, Blachly-Dyson E, Basso E, Jockel J, Bassik MC, Korsmeyer SJ, Forte M. Biochemical and genetic analysis of the mitochondrial response of yeast to BAX and BCL-X(L) Mol Cell Biol. 2000;20:3125–3136. doi: 10.1128/mcb.20.9.3125-3136.2000. [DOI] [PMC free article] [PubMed] [Google Scholar]
- Harada H, Andersen JS, Mann M, Terada N, Korsmeyer SJ. p70S6 kinase signals cell survival as well as growth, inactivating the pro-apoptotic molecule BAD. Proc Natl Acad Sci USA. 2001;98:9666–9670. doi: 10.1073/pnas.171301998. [DOI] [PMC free article] [PubMed] [Google Scholar]
- Hernlund E, Hjerpe E, Avall-Lundqvist E, Shoshan M. Ovarian carcinoma cells with low levels of beta-F1-ATPase are sensitive to combined platinum and 2-deoxy-D-glucose treatment. Mol Cancer Ther. 2009;8:1916–1923. doi: 10.1158/1535-7163.MCT-09-0179. [DOI] [PubMed] [Google Scholar]
- Husain I, Harris DA. ATP synthesis and hydrolysis in submitochondrial particles subjected to an acid-base transition. Effects of the ATPase inhibitor protein. FEBS Lett. 1983;160:110–114. doi: 10.1016/0014-5793(83)80947-8. [DOI] [PubMed] [Google Scholar]
- Iadecola C, Anrather J. Stroke research at a crossroad: asking the brain for directions. Nat Neurosci. 2011;14:1363–1368. doi: 10.1038/nn.2953. [DOI] [PMC free article] [PubMed] [Google Scholar]
- Johnson KM, Chen X, Boitano A, Swenson L, Opipari AW, Jr, Glick GD. Identification and validation of the mitochondrial F1F0-ATPase as the molecular target of the immunomodulatory benzodiazepine Bz-423. Chem Biol. 2005;12:485–496. doi: 10.1016/j.chembiol.2005.02.012. [DOI] [PubMed] [Google Scholar]
- Karin M. Nuclear factor-kappaB in cancer development and progression. Nature. 2006;441:431–436. doi: 10.1038/nature04870. [DOI] [PubMed] [Google Scholar]
- Lapuente-Brun E, Moreno-Loshuertos R, Acin-Perez R, Latorre-Pellicer A, Colas C, Balsa E, Perales-Clemente E, Quiros PM, Calvo E, Rodriguez-Hernandez MA, Navas P, Cruz R, Carracedo A, Lopez-Otin C, Perez-Martos A, Fernandez-Silva P, Fernandez-Vizarra E, Enriquez JA. Supercomplex assembly determines electron flux in the mitochondrial electron transport chain. Science. 2013;340:1567–1570. doi: 10.1126/science.1230381. [DOI] [PubMed] [Google Scholar]
- Leslie NR. The redox regulation of PI 3-kinase-dependent signaling. Antioxid Redox Signal. 2006;8:1765–1774. doi: 10.1089/ars.2006.8.1765. [DOI] [PubMed] [Google Scholar]
- Li B, Chauvin C, De Paulis D, De Oliveira F, Gharib A, Vial G, Lablanche S, Leverve X, Bernardi P, Ovize M, Fontaine E. Inhibition of complex I regulates the mitochondrial permeability transition through a phosphate-sensitive inhibitory site masked by cyclophilin D. Biochim Biophys Acta. 2012;1817:1628–1634. doi: 10.1016/j.bbabio.2012.05.011. [DOI] [PubMed] [Google Scholar]
- Li RJ, Zhang GS, Chen YH, Zhu JF, Lu QJ, Gong FJ, Kuang WY. Down-regulation of mitochondrial ATPase by hypermethylation mechanism in chronic myeloid leukemia is associated with multidrug resistance. Ann Oncol. 2010;7:1506–1514. doi: 10.1093/annonc/mdp569. [DOI] [PubMed] [Google Scholar]
- Lippe G, Sorgato MC, Harris DA. Kinetics of the release of the mitochondrial inhibitor protein. Correlation with synthesis and hydrolysis of ATP. Biochim Biophys Acta. 1988;933:1–11. doi: 10.1016/0005-2728(88)90050-3. [DOI] [PubMed] [Google Scholar]
- Lopez-Mediavilla C, Vigny H, Godinot C. Docking the mitochondrial inhibitor protein IF1 to a membrane receptor different from the F1-ATPase beta subunit. Eur J Biochem. 1993;215:487–496. doi: 10.1111/j.1432-1033.1993.tb18058.x. [DOI] [PubMed] [Google Scholar]
- Martinez-Serrano A, Bjorklund A. Protection of the neostriatum against excitotoxic damage by neurotrophin-producing, genetically modified neural stem cells. J Neurosci. 1996;16:4604–4616. doi: 10.1523/JNEUROSCI.16-15-04604.1996. [DOI] [PMC free article] [PubMed] [Google Scholar]
- Matsuyama S, Xu Q, Velours J, Reed JC. The Mitochondrial F0F1-ATPase proton pump is required for function of the proapoptotic protein Bax in yeast and mammalian cells. Mol Cell. 1998;1:327–336. doi: 10.1016/s1097-2765(00)80033-7. [DOI] [PubMed] [Google Scholar]
- Mayford M, Bach ME, Huang YY, Wang L, Hawkins RD, Kandel ER. Control of memory formation through regulated expression of a CaMKII transgene. Science. 1996;274:1678–1683. doi: 10.1126/science.274.5293.1678. [DOI] [PubMed] [Google Scholar]
- Michels J, Kepp O, Senovilla L, Lissa D, Castedo M, Kroemer G, Galluzzi L. Functions of BCL-X L at the interface between cell death and metabolism. Int J Cell Biol. 2013;2013:705294. doi: 10.1155/2013/705294. [DOI] [PMC free article] [PubMed] [Google Scholar]
- Mihaylova MM, Shaw RJ. The AMPK signalling pathway coordinates cell growth, autophagy and metabolism. Nat Cell Biol. 2011;13:1016–1023. doi: 10.1038/ncb2329. [DOI] [PMC free article] [PubMed] [Google Scholar]
- Minauro-Sanmiguel F, Wilkens S, Garcia JJ. Structure of dimeric mitochondrial ATP synthase: novel F0 bridging features and the structural basis of mitochondrial cristae biogenesis. Proc Natl Acad Sci USA. 2005;102:12356–12358. doi: 10.1073/pnas.0503893102. [DOI] [PMC free article] [PubMed] [Google Scholar]
- Paumard P, Vaillier J, Coulary B, Schaeffer J, Soubannier V, Mueller DM, Brethes D, di Rago JP, Velours J. The ATP synthase is involved in generating mitochondrial cristae morphology. EMBO J. 2002;21:221–230. doi: 10.1093/emboj/21.3.221. [DOI] [PMC free article] [PubMed] [Google Scholar]
- Pelicano H, Xu RH, Du M, Feng L, Sasaki R, Carew JS, Hu Y, Ramdas L, Hu L, Keating MJ, Zhang W, Plunkett W, Huang P. Mitochondrial respiration defects in cancer cells cause activation of Akt survival pathway through a redox-mediated mechanism. J Cell Biol. 2006;175:913–923. doi: 10.1083/jcb.200512100. [DOI] [PMC free article] [PubMed] [Google Scholar]
- Ravati A, Ahlemeyer B, Becker A, Klumpp S, Krieglstein J. Preconditioning-induced neuroprotection is mediated by reactive oxygen species and activation of the transcription factor nuclear factor-kappaB. J Neurochem. 2001;78:909–919. doi: 10.1046/j.1471-4159.2001.00463.x. [DOI] [PubMed] [Google Scholar]
- Sanchez-Arago M, Formentini L, Cuezva JM. Mitochondria-Mediated Energy Adaption in Cancer: the H(+)-ATP Synthase-Geared Switch of Metabolism in Human Tumors. Antioxid Redox Signal. 2013a;19:285–298. doi: 10.1089/ars.2012.4883. [DOI] [PMC free article] [PubMed] [Google Scholar]
- Sanchez-Arago M, Formentini L, Martinez-Reyes I, Garcia-Bermudez J, Santacatterina F, Sanchez-Cenizo L, Willers IM, Aldea M, Najera L, Juarranz A, Lopez EC, Clofent J, Navarro C, Espinosa E, Cuezva JM. Expression, regulation and clinical relevance of the ATPase inhibitory factor 1 in human cancers. Oncogenesis. 2013b;2:e46. doi: 10.1038/oncsis.2013.9. [DOI] [PMC free article] [PubMed] [Google Scholar]
- Sanchez-Cenizo L, Formentini L, Aldea M, Ortega AD, Garcia-Huerta P, Sanchez-Arago M, Cuezva JM. Up-regulation of the ATPase inhibitory factor 1 (IF1) of the mitochondrial H+-ATP synthase in human tumors mediates the metabolic shift of cancer cells to a Warburg phenotype. J Biol Chem. 2010;285:25308–25313. doi: 10.1074/jbc.M110.146480. [DOI] [PMC free article] [PubMed] [Google Scholar]
- Santamaria G, Martinez-Diez M, Fabregat I, Cuezva JM. Efficient execution of cell death in non-glycolytic cells requires the generation of ROS controlled by the activity of mitochondrial H + -ATP synthase. Carcinogenesis. 2006;27:925–935. doi: 10.1093/carcin/bgi315. [DOI] [PubMed] [Google Scholar]
- Schwarcz R, Bruno JP, Muchowski PJ, Wu HQ. Kynurenines in the mammalian brain: when physiology meets pathology. Nat Rev Neurosci. 2012;13:465–477. doi: 10.1038/nrn3257. [DOI] [PMC free article] [PubMed] [Google Scholar]
- Shchepina LA, Pletjushkina OY, Avetisyan AV, Bakeeva LE, Fetisova EK, Izyumov DS, Saprunova VB, Vyssokikh MY, Chernyak BV, Skulachev VP. Oligomycin, inhibitor of the F0 part of H + -ATP-synthase, suppresses the TNF-induced apoptosis. Oncogene. 2002;21:8149–8157. doi: 10.1038/sj.onc.1206053. [DOI] [PubMed] [Google Scholar]
- Shen L, Zhi L, Hu W, Wu MX. IEX-1 targets mitochondrial F1Fo-ATPase inhibitor for degradation. Cell Death Differ. 2009;16:603–612. doi: 10.1038/cdd.2008.184. [DOI] [PMC free article] [PubMed] [Google Scholar]
- Shin YK, Yoo BC, Chang HJ, Jeon E, Hong SH, Jung MS, Lim SJ, Park JG. Down-regulation of mitochondrial F1F0-ATP synthase in human colon cancer cells with induced 5-fluorouracil resistance. Cancer Res. 2005;65:3162–3170. doi: 10.1158/0008-5472.CAN-04-3300. [DOI] [PubMed] [Google Scholar]
- Tomasetig L, Di Pancrazio F, Harris DA, Mavelli I, Lippe G. Dimerization of F0F1ATP synthase from bovine heart is independent from the binding of the inhibitor protein IF1. Biochim Biophys Acta. 2002;1556:133–141. doi: 10.1016/s0005-2728(02)00344-4. [DOI] [PubMed] [Google Scholar]
- Tomiyama A, Serizawa S, Tachibana K, Sakurada K, Samejima H, Kuchino Y, Kitanaka C. Critical role for mitochondrial oxidative phosphorylation in the activation of tumor suppressors Bax and Bak. J Natl Cancer Inst. 2006;98:1462–1473. doi: 10.1093/jnci/djj395. [DOI] [PubMed] [Google Scholar]
- Wittig I, Schagger H. Supramolecular organization of ATP synthase and respiratory chain in mitochondrial membranes. Biochim Biophys Acta. 2009;1787:672–680. doi: 10.1016/j.bbabio.2008.12.016. [DOI] [PubMed] [Google Scholar]
- Wondrak GT. Redox-directed cancer therapeutics: molecular mechanisms and opportunities. Antioxid Redox Signal. 2009;11:3013–3069. doi: 10.1089/ars.2009.2541. [DOI] [PMC free article] [PubMed] [Google Scholar]
- Zhao X, Leon IR, Bak S, Mogensen M, Wrzesinski K, Hojlund K, Jensen ON. Phosphoproteome analysis of functional mitochondria isolated from resting human muscle reveals extensive phosphorylation of inner membrane protein complexes and enzymes. Mol Cell Proteomics. 2011;10 doi: 10.1074/mcp.M110.000299. M110.000299. [DOI] [PMC free article] [PubMed] [Google Scholar]
Associated Data
This section collects any data citations, data availability statements, or supplementary materials included in this article.