

Abstract
Human African trypanosomiasis (HAT) is an important public health threat in sub-Saharan Africa. Current drugs are unsatisfactory, and new drugs are being sought. Few validated enzyme targets are available to support drug discovery efforts, so our goal was to obtain essentiality data on genes with proven utility as drug targets. Aminoacyl-tRNA synthetases (aaRSs) are known drug targets for bacterial and fungal pathogens and are required for protein synthesis. Here we survey the essentiality of eight Trypanosoma brucei aaRSs by RNA interference (RNAi) gene expression knockdown, covering an enzyme from each major aaRS class: valyl-tRNA synthetase (ValRS) (class Ia), tryptophanyl-tRNA synthetase (TrpRS-1) (class Ib), arginyl-tRNA synthetase (ArgRS) (class Ic), glutamyl-tRNA synthetase (GluRS) (class 1c), threonyl-tRNA synthetase (ThrRS) (class IIa), asparaginyl-tRNA synthetase (AsnRS) (class IIb), and phenylalanyl-tRNA synthetase (α and β) (PheRS) (class IIc). Knockdown of mRNA encoding these enzymes in T. brucei mammalian stage parasites showed that all were essential for parasite growth and survival in vitro. The reduced expression resulted in growth, morphological, cell cycle, and DNA content abnormalities. ThrRS was characterized in greater detail, showing that the purified recombinant enzyme displayed ThrRS activity and that the protein localized to both the cytosol and mitochondrion. Borrelidin, a known inhibitor of ThrRS, was an inhibitor of T. brucei ThrRS and showed antitrypanosomal activity. The data show that aaRSs are essential for T. brucei survival and are likely to be excellent targets for drug discovery efforts.
INTRODUCTION
Human African trypanosomiasis (HAT), also known as African sleeping sickness, is caused by Trypanosoma brucei, a protozoan parasite transmitted by the tsetse flies of genus Glossina (1). HAT is endemic in over 36 countries and threatens over 60 million people within sub-Saharan Africa. Few drugs are available to treat HAT, and their use is complicated by limited efficacy that depends on both the subspecies and the development stage of the parasite (2, 3). Treatment of late-stage disease is particularly problematic, and while the recent introduction of nifurtimox-eflornithine combination therapy (NECT) has improved treatment outcomes (4), more-effective drugs that combat all forms of the disease are still badly needed.
Alliances among academic and industry partners have emerged with the goal of exploiting the molecular-target approach to antiparasitic drug discovery (5, 6). An open-access resource (tdrtargets.org) was developed to improve prioritization of potential drug targets for major pathogens (7, 8). The premise of this undertaking is the idea that gene products that have been exploited for the treatment of human disease are more likely to represent druggable targets than those for which no information is available (9). Druggable targets were further defined as those that bind small drug-like molecules with high potency, resulting in disease-modifying outcomes. These reported computational approaches utilized the availability of inhibitors for homologs of a gene and the drug-like properties of these inhibitors to assign targets a druggability score.
The translation apparatus, including ribosomes, specific elongation and initiation factors, and aminoacyl-tRNA synthetases (aaRSs), represents one of the major pathways targeted by commercial antibiotics (10–14). The aaRSs are essential participants in the protein translation mechanism, catalyzing the esterification of specific amino acids and their corresponding tRNAs (15–18) (Fig. 1). Two classes of aaRSs have been described, each of which is in turn divided into three additional subclasses. These classes are distinguished both by different structural folds and by the site of esterification (class I enzymes esterify the 2′-hydroxyl of the adenosine ribose whereas class II enzymes esterify the 3′-hydroxyl of the ribose). Inhibitors of aaRSs with both antibacterial and antifungal activity have been reported, and while mupirocin (used as a topical antibiotic) is currently the only aaRS inhibitor in clinical use, many others are in various stages of discovery and development (11–13) (see Table 1). Recent examples of the identification of aaRS inhibitors targeting parasitic protozoa have also been described, including the discovery that cladosporin targets Plasmodium falciparum LysRS, providing a potential lead for malaria drug discovery (19). The targeted aaRSs are diverse, spanning both different amino acid specificities and different enzyme classes. Thus, the aaRSs appear to be broadly appealing targets for the development of new antimicrobial agents.
FIG 1.

Reactions catalyzed by aaRR. AA, amino acid substrate; aaRS:AA-AMP, enzyme-bound aminoacyl-adenylate intermediate; AA-tRNA, amino acyl tRNA.
TABLE 1.
Classification and druggability of T. brucei aaRSsa
| Product | Gene ID | Class | Localization | MARS complex | No. of BSF RNA reads | Druggability | Chemical validation | Structure(s) available | BSF RNAi growth defect | % RNA knockdown (24 h) | Loss-of-fitness BSF RNAi screen (3) |
|---|---|---|---|---|---|---|---|---|---|---|---|
| AlaRS | Tb927.6.700 | IIc | C/M | Y | 589.1 | 0.2 | Severe (21) | 78 | Yes | ||
| ArgRS | Tb927.11.1990 | Ic | C/M | Y (Homo sapiens) | 302.2 | 0.6 | Severe | 79 | Yes | ||
| AsnRS | Tb927.4.2310 | IIb | C/M | Y | 566.3 | No data | Severe | 60 | Yes | ||
| AspRS-2 | Tb927.10.1260 | IIb | M | 108.4 | No data | Microcin C (63) | No | ||||
| AspRS-1 | Tb927.6.1880 | IIb | C | 98.3 | 0.2 | Microcin C (63) | Y (Homo sapiens) | No | |||
| CysRS | Tb927.6.950 | Ia | C/M | Y | 517.0 | No data | No | ||||
| GlnRS | Tb927.9.5210 | Ic | C/M | 345.0 | 0.8 | Glu-KPA (E. coli) (64) | Y (Saccharomyces cerevisiae) | Yes | |||
| GluRS | Tb927.6.4590 | Ic | C/M | Y | 465.1 | 0.3 | Y (Saccharomyces cerevisiae) | Moderate | Yes | ||
| GlyRS | Tb927.11.9640 | IIc | C/M | Y | 302.4 | No data | Yes | ||||
| HisRS | Tb927.6.2060 | IIa | C(M?) | 100.0 | 0.6 | Y (T. brucei) | Severe (36) | 58 | Yes | ||
| IleRS | Tb927.10.9190 | Ia | C/M | Y | 1000.2 | 0.9 | Reveromicin (S. aureus) (65); muporicin (S. enterica) (66); NSC70422 (T. brucei) (21); PLD-118 (icofungipen) (C. albicans) (67); SB-203207 (Streptomyces) (68, 69) | Y (Homo sapiens) | Severe (21) | 80 | Yes |
| LeuRS | Tb927.11.3730 | Ia | C/M | 320.1 | 0.7 | Granaticin (B. subtilis) (67); | Moderate (21) | 64 | No | ||
| LysRS-1 | Tb927.8.1600 | IIb | C/M | 400.2 | No data | Cladosporin (Plasmodium falciparum) (19) | Y (Homo sapiens, Plasmodium falciparum) | Severe (21) | 73 | No | |
| LysRS-2 | Tb927.6.1510 | IIb | M | 105.9 | No data | No | |||||
| MetRS | Tb927.10.1500 | Ia | C/M | Y | 326.4 | 0.7 | Urea-based inhibitors (T. brucei) (33, 35); REP8839 (S. aureus) (70) | Y (T. brucei, Leishmania major) | Moderate (21) | 77 | No |
| PheRS-α | Tb927.11.14120 | IIc | C/M | Y (Saccharomyces cerevisiae) | 283.1 | 0.6 | Ochratoxin A and B (hepatoma tissue culture) (71); ethanolamine-based inhibitors (Staphylococcus aureus) (72) | Moderate | 57 | No | |
| PheRS-β | Tb927.11.2360 | IIc | C/M | 248.2 | No data | Severe | 73 | Yes | |||
| ProRS | Tb927.10.12890 | IIa | C/M | Y | 859.4 | 0.8 | Halofuginone (Plasmodium) (73) | Y (Homo sapiens) | Severe (21) | 53 | Yes |
| SerRS | Tb927.11.7170 | IIa | C/M | 308.5 | No data | SB-217452 (rat, S. aureus) (74) | Y (T. brucei, Homo sapiens) | Yes | |||
| ThrRS | Tb927.5.1090 | IIa | C/M | Y (Saccharomyces cerevisiae) | 372.0 | 0.6 | Borrelidin (fungi, bacteria) (53, 55, 56); T. brucei (this work) | Y (Saccharomyces cerevisiae, Homo sapiens, Escherichia coli) | Severe | 84 | No |
| TrpRS-1 | Tb927.3.5580 | Ib | C | Y | 168.4 | 0.2 | Chuangxinmycin (bacteria) (73); indolmycin (Streptomyces) (73) | Y (T. brucei), Plasmodium falciparum | serere | 59 | No |
| TrpRS-2 | Tb927.8.2240 | Ib | M | 117.4 | 0.2 | Y (Plasmodium falciparum) | Severe (conditional null) (27) | No | |||
| TyrRS | Tb927.7.3620 | Ib | C/M | 200.0 | 0.6 | 3-Aryl-4-arylaminofuran-2(5H)-ones (bacteria) (75); SB-219383 (Micromonospora sp.) (76) | Y (Leishmania major) | No | |||
| ValRS | Tb927.6.4480 | Ia | C/M | 402.0 | 0.9 | S-Adenosylhomocysteine (77) | Moderate | 63 | No | ||
| MCP1 | Tb927.7.2400 | 221.2 | No data | Unknown | |||||||
| MCP2 | Tb927.8.5330 | C | 80.6 | Moderate (21) (conditional null) | 100 | ||||||
| MCP3 | Tb927.10.1250 | 68.7 | Unknown |
Gene names (http://tritrypdb.org/tritrypdb/) and druggability scores (tdrtargets.org) were taken from the indicated web sites. Enzymes evaluated in this study are shown in bold type. Loss-of-fitness data from the RNAi screen performed by Alsford et al. (3) are summarized for comparison. BSF RNA reads are scaled read counts (median normalized; median is 100) taken from reference 78. MARS complex-associated proteins (MCP) 1 1, 2, and 3 are also shown, although they do not have aaRS activity. C, cytoplasm; M, mitochondrion; C/M, both cytoplasm and mitochondrion; Glu-KPA, glutamyl-beta-ketophosphonate-adenosine; Y, yes. Numbers in parentheses refer to publications cited. ID, identification number.
Trypanosomatids encode a full complement of both class 1 and class 2 aaRSs; bioinformatics analysis of Leishmania major (20) and T. brucei (21) identified 25 and 24 genes encoding canonical aaRS homologs, respectively, covering all key amino acids. Additionally, they encode three multiple-aaRS (MARS) complex-associated proteins (MCPs). The MCPs share sequence identity with aaRS noncatalytic domains or with aaRS editing domains but do not have aminoacylation activity (21). Both cytosolic translation and mitochondrial translation require aaRSs. Trypanosomatids, unlike other eukaryotes, do not code for tRNA molecules in their mitochondrial genome; instead, mitochondria import their tRNAs and aaRSs from the cytosol (13, 22, 23). Almost all aaRSs in the T. brucei genome are single copy and thus must serve dual roles in the cytosol and mitochondria; TrpRS, LysRS, and AspRS are three notable exceptions where separate cytosolic and mitochondrial genes have been identified (24–26). Several T. brucei aaRS genes have been reported to be essential in parasites in either the insect stage (procyclic) or the mammalian stage (21, 25–30). Several groups have also reported the identification of MetRS, IleRS, and LeuRS inhibitors with antitrypanosome activity (30–35). Crystal structures have been solved for many of the aaRSs across several species (15), including the structures of HisRS (36) and TrpRS (37) from T. brucei, which will aid in understanding how to target these enzymes for HAT drug discovery. Finally, we recently showed that a number of aaRSs from T. brucei associate into a MARS complex (21). However, despite these extensive efforts, a number of T. brucei key aaRSs remain uncharacterized.
Since aaRSs have been successful drug targets in other species, we undertook a comprehensive study to identify essential aaRSs in T. brucei with the goal of demonstrating their potential utility as a new class of targets in antitrypanosome drug discovery. The present study focused on the genetic validation of eight uncharacterized T. brucei aaRSs by RNA interference (RNAi) gene knockdown in the infectious mammalian bloodstream-form (BSF) parasites. Genes were selected both for high druggablity scores and to encompass examples from each of the major aaRS classes. We show here that all eight newly characterized genes are essential for mammalian BSF parasites. There was a partial correlation between the extent of RNAi knockdown and the effects on cell growth, morphology, cell cycle, and cellular DNA. A heterologous expression system and an enzyme assay were developed for threonyl-tRNA synthetase (ThrRS) that ready the target for future work in a drug discovery program.
MATERIALS AND METHODS
TriTrypDB accession numbers for genes analyzed in this study.
Putative aaRS genes were selected based on their annotation in TriTrypDB, and the following were studied: ThrRS (T. brucei 927.5.1090 [Tb927.5.1090]), arginyl-tRNA synthetase (ArgRS) (Tb927.11.1990), asparaginyl-tRNA synthetase (AsnRS) (Tb927.4.2310), phenylalanyl-tRNA synthetase alpha (PheRSα) subunit (Tb927.11.14120), PheRSβ subunit (Tb927.11.2360), tryptophanyl-tRNA synthetase (TrpRS-1) (Tb927.3.5580), valyl-tRNA synthetase (ValRS) (Tb927.6.4480), and glutamyl-tRNA synthetase (GluRS) (Tb927.6.4590).
Growth of T. brucei BSF in vitro cultures.
BSF 427 single-marker (SM) cells were cultured in HMI-9 media supplemented with 10% fetal bovine serum as described previously (38–40). Cells were maintained at exponential growth (between 105 and 106 cells/ml), and RNAi was induced at a cell density of 2 × 10⁵/ml by addition of tetracycline (Tet) (1 μg/ml) to the media. Cell numbers were monitored by hemocytometer, with the exception that the data collected for glutamyl-tRNA synthetase (GluRS) were obtained by particle counting, which also detects cell debris. All growth data were collected in biological triplicate, with the exception of the PheRSα and GluRS data, which were collected in duplicate. To determine the 50% effective concentration (EC50) for borrelidin, the dose-response data were fitted to the log(inhibitor) versus response − variable slope (4-parameter) equation using GraphPad Prism.
Generation of cell lines containing inducible RNAi constructs.
RNA interference (RNAi) cell lines were generated using gateway vector (TrypRNAiGate) for the following genes: AsnRS (Tb927.4.2310), PheRSα subunit (Tb927.11.14120), PheRSβ subunit (Tb927.11.2360), and ValRS (Tb927.6.4480). A 400- to 500-bp region of each gene was selected using RNAit software (41). PCR products were generated using High Fidelity Platinum Taq DNA polymerase (Invitrogen) and the following forward and reverse primer pairs: for AsnRS, 5′-(CGGGCTACATTCAAGTGGTT)-3′ and 5′-(CAAAATTGCACACCGCATAC)-3′; for PheRSα subunit, 5′-(TTTTAAGTCGCTGGAAGCAGGT)-3′ and 5′-(GGGGGCCCACGTCTAACACTAA)-3′; for PheRSβ subunit, 5′-(AATGGGTACTGCGATGAAGG)-3′ and 5′-(TGATGCACGAGTAGTCCGAG)-3′; and for ValRS 5′-(GGGTACGACAGGAAGGTTGA)-3′ and primer 5′-(AATGTCACCGGTCCTACTGC)-3′. Gel-purified PCR fragments were then incubated with pCR8/GW/TOPO vector (supplied ready to use) for 5 min at room temperature, transformed into Top10 Escherichia coli, and plated on spectinomycin (100 μg/ml)-containing LB plates as described in the Gateway pENTR vectors instruction manual (Invitrogen Life Technologies). Sequence-verified plasmids were then used in the LR recombination reaction with pTrypRNAiGate destination vector to generate stem-loop constructs, and the parasite transfections were performed as previously described (38, 39). Inducible RNAi plasmids for ArgRS (Tb927.11.1990), ThrRS (Tb927.5.1090), TrpRS-1 (Tb927.3.5580), and GluRS (Tb927.6.4590) were generated using a pQuadra system (42). Briefly, an ∼400-bp fragment of the gene was selected using RNAit software (41) and amplified by PCR, using the following forward and reverse primer pairs, all containing added BstXI sites at the 5′ end: for ArgRS, 5′-(ATACCAATGTGATGGGCTTGTGGACTTTTCTTCGC)-3′ and 5′-(ATACCATAGAGTTGGCTTTGCGTCCAGTGCAGATA)-3′; for ThrRS, 5′-(ATACCAATGTGATGGATGTTTATGACGTCCTCGGC)-3′ and 5′-(ATACCATAGAGTTGGGTGCAGCCTTCTCGTAGGAC)-3′; for TrpRS-1, 5′-(ATACCAATGTGATGGCTGCTATACAGGCTGCACCA)-3′ and 5′-(ATACCATAGAGTTGGCCAATTTCCGTTTCTCCTGA)-3′; and for GluRS, 5′-(ATACCAATGTGATGGTTTACGGGCAAAGATATCCG)-3′ and 5′-(ATACCATAGAGTTGGCAACAACACATCGGACCTTG)-3′. Ligation with BstXI-digested PCR fragments and pQuadra3 plasmids generated the RNAi vectors, containing inverted repeats of the PCR product separated by a spacer region. Transfection of NotI-linearized constructs into the SM cell line (43) and selection of transgenic cell lines (44) were carried out as described previously.
Quantitative real-time PCR analysis.
Quantitative real-time PCR was performed using SYBR green Mastermix (Bio-Rad). Total RNA was extracted from parasites using TRIzol reagent (Invitrogen) and an RNeasy minikit (Qiagen), treated with DNase I (Worthington), and reverse transcribed using a High Capacity cDNA reverse transcription kit (Applied Biosystems). An approximately 100-bp fragment of each gene was amplified using SYBR green Mastermix on a CFX96 real-time system (Bio-Rad). Reaction conditions maintained according to the manufacturer's instructions were as follows: 95°C for 1 min and 40 cycles of 95°C for 3 s and 60°C for 30 s, followed by a continuous melting curve (55°C to 95°C in 0.5°C increments). Data were normalized to that of a constitutively expressed control mRNA, telomerase reverse transcriptase (TERT), which has been validated as a control for quantitative PCR (qPCR) in T. brucei (45). Gene expression levels were quantified by the comparative threshold cycle (ΔΔCT) method (46) with TERT as the internal standard for normalization. Oligonucleotides were as follows: forward primer 5′-(GAGCGTGTGACTTCCGAAGG)-3′ and reverse primer 5′-(AGGAACTGTCACGGAGTTTGC)-3′ for TERT, forward primer 5′-(AATGCGAAGGATTTGTCCAC)-3′ and reverse primer 5′-(TGCTCGGAGAGTTTCACCTT)-3′ for AsnRS, forward primer 5′-(TTATGGAGATGGGCTTCCAG)-3′ and reverse primer 5′-(GCGGGTTTTGAAATGAAGAA)-3′ for PheRSα subunit, forward primer 5′-(GGAGGACCAATTCGAAGACA)-3′ and reverse primer 5′-(AGAAAGCTCCTCTCCCTTGG)-3′ for PheRSβ subunit, forward primer 5′-(AAGAAGTATCACGGTAAGC)-3′ and reverse primer 5′-(TCACATCAACCAGAACAG)-3′ for ValRS, forward primer 5′-(CGCTATGGGTCTTGTCAAGCT)-3′ and reverse primer 5′-(CAGTGCCGGGCTTGTCTTT)-3′ for ArgRS, forward primer 5′-(CCCGCGGCAAGTTATTGT)-3′ and reverse primer 5′-(TGTCGCGCACCGTTTGT)-3′ for ThrRS, and forward primer 5′-(ACGAGTCCGGTCAACCTTTTT)-3′ and reverse primer 5′-(TCAAATGACCCATATGCATGGA)-3′ for TrpRS-1.
Cell morphology analysis.
Log-phase cells were collected by centrifuging at 3,000 rpm for 10 min in a 15-ml tube. Cells were resuspended in freshly made 4% paraformaldehyde (PFA), fixed at room temperature for 45 min, washed with phosphate-buffered saline (PBS; pH 7.4), and resuspended in 50 to 100 μl PBS. Cells (20 μl) were placed on a poly-l-lysine-coated slide, spread, and dried for 1 h. For nuclear (N) and kinetoplast (K) DNA, the cells were applied to coverslips with Vectashield mounting medium containing DAPI (4′,6-diamidino-2-phenylindole; hard set) and analyzed by fluorescence confocal microscopy (Leica TCS SP5) at a magnification of ×63 and an excitation wavelength of 350 nm and by bright-field differential interference contrast (DIC). Both uninduced and Tet-induced cultures were examined at multiple time intervals. The percentage of morphological anomalies (number of nuclei, kinetoplasts, and phenotypic forms) was determined by counting 150 cells.
Flow cytometric analysis.
For cell cycle analysis, BSF T. brucei was inoculated at 105 parasites/ml and the cultures were harvested at 0, 2, and 3 days after plating. Cells were washed with PBS (pH 7.4) fixed in 70% ethanol and resuspended in PBS containing 10 μg ml−1 RNase A and 10 μg ml−1 propidium iodide (PI; Sigma). After incubation for 30 min at 37°C, PI-stained cells were analyzed by flow cytometry as described previously (47, 48). Histograms were analyzed for populations with 2C, 4C, and >4C as a measurement of relative DNA content.
Immunofluorescence localization assay.
The gene encoding ThrRS (Tb927.5.1090) was amplified by PCR from genomic DNA from T. brucei strain Lister 427 using specific primers forward 5′-(CCCAAGCTTATGGCCACGGCTGTTG)-3′ and reverse 5′-(CCCAGATCTGAAGGACGGATCATATTTATCGG)-3′ and cloned into HindIII and BamHI sites of pLEW100 vector with a 3V5 tag at the C terminus. Plasmids were digested with NotI and transfected into T. brucei SM 427 BSF cells, and resistant clones were selected with 5 μg/ml of phleomycin (49). Expression of the 3V5-tagged protein was induced with 0.5 μg/ml Tet. Cells growing at mid-log phase were fixed with 4% paraformaldehyde–PBS (pH 7.4), adhered in poly-l-lysine-treated 12-mm-diameter cover glass (Fisher), and permeabilized with 0.2% Triton X-100–PBS. Coverslips were blocked with 3% bovine serum albumin (BSA)–PBS and labeled with monoclonal antibodies to the 3V5 tag (anti-V5-fluorescein isothiocyanate [FITC; Sigma] conjugated) that were diluted 1:500 in PBS–3% BSA. Mitochondrial staining was performed by treating cells with 0.01 μg/ml MitoTracker (Molecular Probes/Invitrogen) for 30 min at 37°C in 5% C02 before fixation. DNA was stained as described above. Cells were analyzed with a Deltavision fluorescence microscope (Olympus IX70).
Cloning, expression, and purification of recombinant protein.
The gene for ThrRS (Tb927.5.1090) was amplified by PCR using specific primers forward 5′-(CCCGAATTCATGGCCACGGCTGTTGTT)-3′ and reverse 5′-(CCCGTCGACGAAGGACGGATCATATTT)-3′ from genomic DNA of T. brucei strain SM 427 and cloned into pET28a+ vector (Novagen) using EcoRI and XhoI restriction sites with a C-terminal 6×His tag. The constructs were transformed into E. coli Rosetta 2(DE3) strain pLysS (Novagen), and protein expression was induced with 0.1 mM IPTG (isopropyl-β-d-thiogalactopyranoside). E. coli was grown in LB media and harvested, and a lysate was prepared with Bugbuster reagent (Novagen). Proteins were purified using Ni+2 magnetic beads (Millipore), dialyzed against 50 mM Tris (pH 7.4)–140 mM NaCl, and kept at 4°C (with 0.05% sodium azide) until use.
Aminoacylation spectrophotometric assays.
Amino acylation assays were performed as previously described (50). Briefly, T. brucei tRNAThr was synthesized by in vitro transcription from a PCR product template that contained a T7 promoter followed by the tRNAThr sequence (Tb927.8.2858) and the CCA sequence. The tRNAThr template was produced by PCR using primers that overlap the tRNAThr sequence: A forward [5′-(TAATACGACTCACTATAGGGGCCTCGTAGCACAGTGGC)-3′], B reverse [5′-(TGGAGGCCCCGCCGAG)-3′], C forward [5′-(GGCCTCGTAGCACAGTGGCAGTGCACTGGTCTTGTAAACC)-3′], and D reverse [5′-(AGGCCCCGCCGAGAATTGAACTCGGGACCCCTGGTTTACAAGACCAGTGCAC)-3′]. The standard reaction ingredients, unless otherwise stated, were aminoacylation buffer (30 mM HEPES buffer [pH 7.4], 140 mM NaCl, 30 mM KCl, 40 mM MgCl2), 1 mM dithiothreitol (DTT), 200 μM ATP, 2 U/ml inorganic pyrophosphatase (Sigma-Aldrich), 10 mM L-Thr (Sigma-Aldrich), 8 μM T. brucei tRNAThr, and 0.4 μM recombinant ThrRS. The aminoacylation reactions (55 μl total volume each) were performed in clear, flat-bottom, 96-well plates (Costar 96-well standard microplates), and the reaction mixtures were incubated for 30 min at 37°C. Liberated inorganic phosphate was detected by addition of 100 μl of malachite green (Echelon Biosciences) and incubated for 30 min at room temperature. Absorbance was measured at 620 nm using a SpectraMax M2 microplate reader (Molecular Devices). Reactions without enzyme or without L-Thr were performed as background controls, and data from reactions without L-Thr were subtracted from the measurements. For time course experiments, aliquots of 10 μl were withdrawn from an 80-μl reaction mixture at different time points (0, 2.5, 5, 10, 20, 30, and 60 min) and mixed with 10 mM EDTA on ice to stop the reaction. For ThrRS inhibition with borrelidin, a reaction mixture containing ThrRS (0.4 μM) was mixed with 5 μl of borrelidin at 10 to 10,000 nM in a 50-μl volume and incubated for 30 min at 37°C. Reactions were stopped as described above. All data are shown for three replicates as the means ± the standard errors. To determine the 50% inhibitory concentration (IC50) for borrelidin, the dose-response data were fitted to the log(inhibitor) versus response − variable slope (4-parameter) equation using GraphPad Prism with the slope restrained to 1.0.
RESULTS
Gene selection.
Enzymes were selected for analysis of essentiality in T. brucei based on two criteria: first, we were interested in genes with high druggability scores; second, we sought to study a representative from each of the major aaRS classes and subclasses (Table 1). Of the selected genes, ThrRS, ArgRS, AsnRS, ValRS, and GluRS are single-copy genes that have dual cytosolic and mitochondrial localizations based on a reported proteomic analysis (21, 51). In contrast, two TrpRSs are encoded in the T. brucei genome, and the cytosolic enzyme was analyzed in this study. Two subunits of PheRS were studied; the alpha subunit consists of the catalytic core, whereas the beta subunit consists of DNA and ATP binding sites. Druggability scores were obtained from tdrtargets.org and showed good predicted druggability for ThrRS, PheRS, ArgRS, and ValRS (>0.6 based on a range from 0 to 1, with 1 representing the most druggable targets [7, 8]), suggesting that, if essential, they would be strong candidates for drug discovery programs. Druggability data are not available for AsnRS, and TrpRS-1 and GluRS score below the 0.6 threshold for good druggability.
Aminoacyl tRNA synthetases are essential for BSF T. brucei growth.
To test the selected aaRSs for essentiality in T. brucei BSF parasites, we established eight stable transgenic cell lines that allow Tet-inducible RNAi-mediated ablation of enzyme expression. Stem-loop RNAi constructs were generated using either a Gateway or a pQuadra cloning system for enzymes ThrRS, AsnRS, PheRSα, and PheRSβ belonging to class II tRNA synthetases and ArgRS, TrpRS-1, ValRS, and GluRS belonging to class I aaRSs (Table 1). Figures 2, 3, 4, 5, 6, and 7 show the characterization of each of the aaRS knockdowns, while Fig. 8 depicts the characteristics of the parental line for comparative purposes. For all 8 of the targeted genes, induction of RNAi led to significant growth defects within 2 to 3 days, showing that all 8 genes are essential for parasite viability (Fig. 2A, both panels A of Fig. 7, and Table 2). These growth defects correlated with decreased mRNA levels ranging from 55% to 85% as determined by RT-PCR analysis using TERT as a control (Fig. 2B and 7B and Table 2) (RT-PCR analysis was not done for the GluRS cell knockdown line). Knockdown of four genes (ThrRS, AsnRS, PheRSβ, and ArgRS) led to rapid cell death, and no evidence of live cells could be detected past day 6. Knockdown of the remaining genes (PheRSα, TrpRS-1, ValRS, and GluRS) stopped growth but did not completely lyse the cells even though the level of mRNA knockdown was similar to the level seen with those genes that showed a more robust cell death effect. Of note, however, changes in protein levels may not necessarily track with the mRNA levels, and since protein levels were not measured, it remains possible that protein levels decreased more significantly in the cell lines that showed the more robust effects.
FIG 2.

Effect of RNAi-induced knockdown of ThrRS in BSF T. brucei. Independent RNAi cell lines generated in BSF cells for ThrRS were analyzed for growth and for cell cycle progression following RNAi induction. (A) Growth curves for three clonal lines with or without Tet (data represent the means, and error bars represent the ranges). Cell numbers were monitored by hemocytometer, and cell number was calculated as the product of cell density and the total dilution. (B) Real-time qPCR analysis of uninduced cells and cells treated with Tet for 24 h and 48 h relative to TERT as the normalization standard. Analyses were run in triplicate, and the error bars represent the root mean square deviation (RMSD). (C) Genome analysis by microscopy: distributions of nuclei (N) and kinetoplasts (K). Cells were grown with or without Tet for 48 h, stained with DAPI, and examined by fluorescence microscopy. A total of 150 cells were counted per condition. (D and E) Flow analysis of cells minus (D) or plus (E) Tet for 48 h and stained with propidium iodide (PI). PI fluorescence (FL3-Area) is plotted versus cell count. The tallest peak in panel D represents G0/G1 (48%), the span between peaks represents the S phase (4.59%), and the second tallest peak represents G0/M (27.6%). (F) Confocal imaging of representative cells before and after Tet induction (48 h).
FIG 3.

Effect of RNAi-induced knockdown of ArgRS in BSF T. brucei. (A) Growth curves. Cell numbers were monitored by hemocytometer. (B) Real-time qPCR analysis. (C) Genome analysis by microscopy. (D and E) Fluorescence-activated cell sorter (FACS) analysis. (F) Confocal imaging. Details are as described for Fig. 2.
FIG 4.

Effect of RNAi-induced knockdown of AsnRS in BSF T. brucei. (A) Growth curves. Cell numbers were monitored by hemocytometer. (B) Real-time qPCR analysis. (C) Genome analysis by microscopy. (D and E) Flow analysis. (F) Confocal imaging. Details are as described for Fig. 2.
FIG 5.

Effect of RNAi-induced knockdown of PheRS in BSF T. brucei. (Top panels) Knockdown of PheRSα. (A) Growth curves. Cell numbers were monitored by hemocytometer. (B) Real-time qPCR analysis. (C) Genome analysis by microscopy. (D and E) Flow analysis. (F) Confocal imaging. (Bottom panels) Knockdown of PheRSβ. (A) Growth curves. Cell numbers were monitored by hemocytometer. (B) Real-time qPCR analysis. (C) Genome analysis by microscopy. (D and E) Flow analysis. (F) Confocal imaging. Details are as described for Fig. 2.
FIG 6.

Effect of RNAi-induced knockdown of TrpRS-1 in BSF T. brucei. (A) Growth curves. Cell numbers were monitored by hemocytometer. (B) Real-time qPCR analysis. (C and D) FACS analysis. Details are as described for Fig. 2.
FIG 7.

(Top panels) Effect of RNAi-induced knockdown of ValRS in BSF T. brucei. (A) Growth curves. Cell numbers were monitored by hemocytometer. (B) Real-time qPCR analysis. (C) Genome analysis by microscopy. (Bottom panel) Effect of RNAi-induced knockdown on GluRS in BSF T. brucei. (A) Growth curves. Cells were counted by particle counting, which also detects cell debris. Details are as described for Fig. 2.
FIG 8.
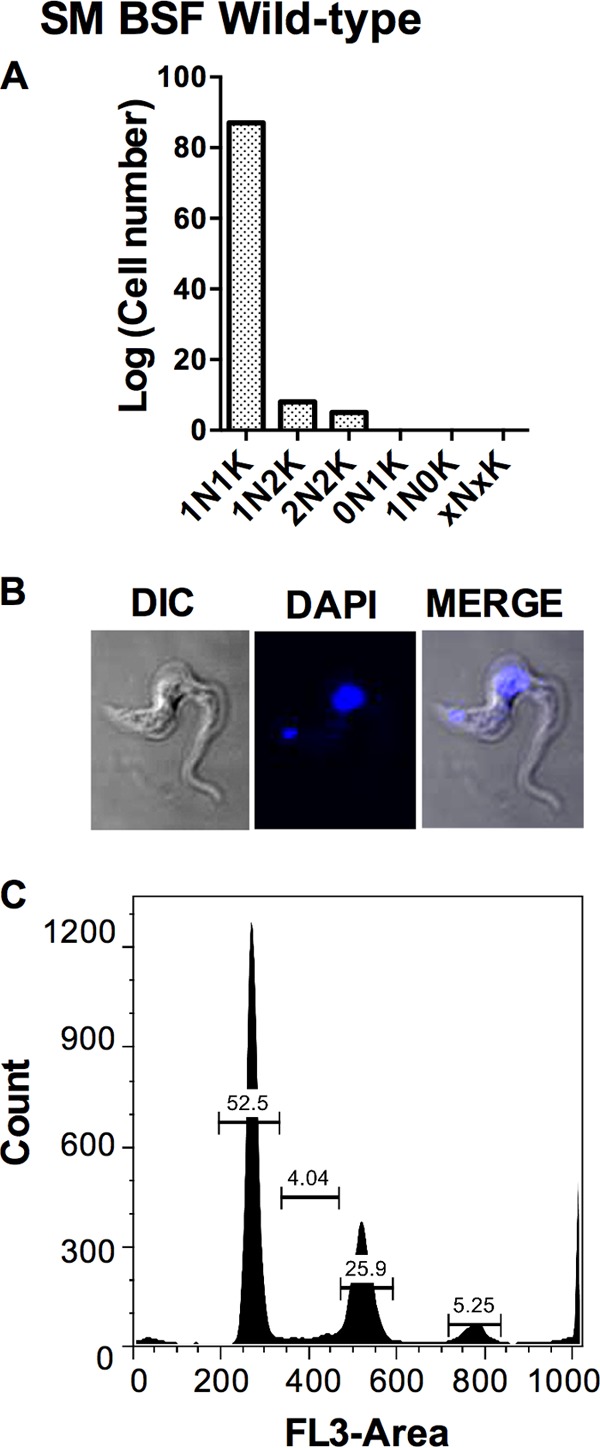
Cell morphology and FACS analysis of wild-type SM T. brucei cells. (A) Genome analysis by microscopy. (B) Confocal imaging. (C and D) Flow analysis. Details are as described for Fig. 2.
TABLE 2.
Description of T. brucei BSF RNAi knockdown phenotypes analyzed in this studya
| Figure | aaRS | % KD (24 h) | Time to growth defect (h) | Cell morphology (at 48 h) | DNA content by FACS and microscopy |
|---|---|---|---|---|---|
| 2 | ThrRS | 84 | 48 | Round up and lyse | Increase in 0N, 0K, and 2K cells |
| 3 | ArgRS | 79 | 16 | Round up and lyse | As wild type |
| 4 | AsnRS | 60 | 16 | Round up and lyse | Increase in 0N, 0K, and 2K cells |
| 5 | PheRS-α | 57 | 48 | Normal | As wild type |
| 5 | PheRS-β | 73 | 24 | Enlarge and lyse | Increase in 0N, 0K, and 2K cells |
| 6 | TrpRS-1 | 59 | 24 | Normal and lyse | As wild type |
| 7 | ValRS | 63 | 48 | Normal | As wild type |
| 7 | GluRS | ND | 48 | ND | ND |
FACS, fluorescence-activated cell sorter analysis; KD, knockdown; ND, not done.
Morphology and flow cytometric analysis of T. brucei BSF cells after aaRS knockdown.
To explore the consequences of gene knockdown beyond the observed growth arrest, the RNAi cell lines and both Tet induced and uninduced control cells and control wild-type SM cells were stained with PI and DNA content was analyzed by flow cytometry. Cell morphology and numbers of nuclei (N) and kinetoplasts (K) were additionally analyzed by confocal microscopy following staining with DAPI. Cells were scored as “normal” when they contained 1K1N or 2K1N/2K2N and “abnormal” when they contained a different genome composition. The majority (90% to 94%) of the control populations had a normal phenotype, and most contained 1K1N, while a lesser fraction of dividing cells (2K1N or 2K2N) was observed (Fig. 8A and B). Based on flow cytometry, 53% of the cells were in G0/G1 phase, 4% in S phase, and 26% in G2/M phase.
Dramatic morphological effects and cell cycle changes were observed for the ThrRS, ArgRS, and AsnRS RNAi cell lines and, to a lesser extent, for PheRSβ, where morphological abnormalities were observed as early as 16 h after Tet induction (Fig. 2 to 5 and Table 2). Flow cytometry suggested that knockdown of ThrRS led to an accumulation of cells with low DNA content (Fig. 2D and E). This corresponded to the appearance of both 0N1K cells (4%) and 1N0K cells (3%) (quantitated by confocal microscopy) (Fig. 2C). There was also an increase in the number of 2N2K cells suggestive of a block in cytokinesis (Fig. 2C). Phenotypically, a large percentage of Tet-induced ThrRS RNAi cells were rounded, had detached flagella, and lacked motility (Fig. 2F). Knockdown of ArgRS led to rapid cell death and to an increase in the number of rounded cells with detached flagella (Fig. 3F), but no significant change in DNA content was seen (Fig. 3D and E). Knockdown of AsnRS led to increases in abnormal complements of nuclei and kinetoplasts. Both confocal microscopy and flow cytometry identified increased populations of 0N1K (up to 20%), 1N0K, and 1N2K cells (Fig. 4C to E) suggestive of a block in entering S phase. A significant percentage of Tet-induced AsnRS RNAi cells were either spherical or round with either detached flagella or no flagella (Fig. 4F [arrow and arrowhead]). After knockdown of PheRSβ, the DNA content was normally distributed (Fig. 5C to E, bottom panel) but cells were somewhat enlarged (Fig. 5F, bottom panel).
Milder but notable effects on the cell cycle and cell morphology were observed for PheRSα knockdown (Fig. 5). Knockdown of PheRSα led to a strong increase in populations of cells, with 4C and 8C DNA content suggesting a block in cytokinesis (Fig. 5D and E, top panel), though cell morphology looked fairly normal (Fig. 5F, top panel). Knockdown of TrpRS-1 and ValRS did not alter cell morphology (data not shown), and while knockdown of these genes reduced the rate of cell growth, the remaining cells had a normal distribution of DNA content (Fig. 6 and 7). Thus, RNAi knockdown of any one of the eight aaRSs resulted in morphological and/or cell division abnormalities and growth inhibition and/or death. There was a partial correlation between the degree of RNAi knockdown and the morphological and growth defects, with those lines where knockdown was more pronounced (73% to 84%) showing greater growth defects, with the exception that AsnRS cell lines showed a decrease in mRNA of only about 60%, which was sufficient to lead to cell lysis (Table 2).
ThrRS enzymatic activity.
Based on the strong cell death phenotype observed for ThrRS knockdown, we decided to characterize this protein in greater detail. Recombinant ThrRS was expressed and purified from E. coli, and we used a coupled-enzyme assay to evaluate the enzymatic activity by following the generation of pyrophosphate via conversion to inorganic phosphate, which was then detected by malachite green (50). ThrRS acylated tRNAThr in a time- and enzyme concentration-dependent manner, demonstrating that the T. brucei ThrRS gene encodes a functional enzyme (Fig. 9A and B). The assay remained linear over 30 min, which was taken as representing the steady-state phase of the reaction, and this time point was used for subsequent studies. Enzyme concentrations above 0.25 μM led to a loss in the linear dependence on enzyme activity; thus, 0.25 μM enzyme was used in subsequent studies. The specific activity of the enzyme under these conditions was 1.4 min−1, which is comparable to published values for the yeast enzyme (kcat = 2.8 min−1 [52]).
FIG 9.
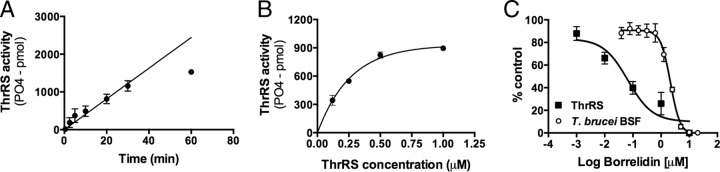
Characterization of ThrRS expression and activity. (A) ThrRS activity assays for recombinant protein purified from E. coli. Data represent dependence of PO4-2 formation versus time. (B) Dependence of PO4-2 formation on ThrRS concentration. Two moles of PO4-2 are formed for every mole of tRNAThr that is acylated. (C) Dose response of T. brucei BSF growth and recombinant ThrRS activity versus concentration of borrelidin, a known ThrRS inhibitor. For inhibition of parasite growth, the EC50 = 2.2 μM (1.8 to 2.5); for inhibition of ThrRS activity, the IC50 = 0.066 μM (0.020 to 0.22), where values in parentheses represent the 95% confidence interval.
To provide chemical validation of ThrRS as a drug target in T. brucei, we tested the reported ThrRS inhibitor borrelidin against both the T. brucei ThrRS enzyme and, for activity, the BSF T. brucei cells in vitro. Borrelidin is a natural-product polyketide that is reported to have broad-spectrum antimicrobial and anticancer activity (53–57). Borrelidin was a potent inhibitor of T. brucei ThrRS (IC50 = 0.066 μM), and this result is consistent with the finding that the amino acids in the putative borrelidin binding pocket are conserved in both T. brucei and the bacterial enzymes that are sensitive to the compound (53) (see Fig. S1 in the supplemental material). T. brucei BSF cell growth was also inhibited (EC50 = 2.2 μM) (Fig. 9C), with parasites being about 30-fold less sensitive to the compound than the purified recombinant enzyme. This difference may relate to poor uptake of borrelidin by the parasites, but we cannot rule out potential off-target effects of borrelidin on the parasites.
Cell localization of ThrRS.
In order to determine the localization of the ThrRS enzyme, we prepared transgenic cell lines allowing inducible expression of ThrRS with three V5 tags at the C terminus. Cells were stained with DAPI (nuclei) and MitoTracker (mitochondria) to mark those compartments along with anti-V5 antibody. A Tet-inducible diffuse staining of the tagged T. brucei ThrRS was observed, consistent with a cytosolic localization (Fig. 10). However, the merged image also showed evidence for mitochondrial staining as marked by the appearance of yellow along the cell edges in the position of the mitochondria. This result is consistent with the T. brucei ThrRS gene encoding a dual-purpose aaRS that functions in both the cytoplasm and mitochondria and is in good agreement with our prior mass spectrometry data (21).
FIG 10.

Subcellular localization analysis of T. brucei BSF expressing C-terminal V5-tagged ThrRS. Cells were fixed in 4% paraformaldehyde and stained with FITC-conjugated anti-V5 monoclonal antibodies. Mitochondria were stained with MitoTracker (MT), and DNA was stained with DAPI. Differential interference contrast (DIC) is shown. Images were merged as indicated.
DISCUSSION
The aaRSs are validated antimicrobial drug targets with high druggability scores (11–13). In order to systematically evaluate the potential of this family of enzymes as targets for drug discovery in T. brucei, we assessed the essentiality in the mammalian infective stage of examples from each major aaRS class and subclass (Table 1) by RNAi-based gene expression knockdown. RNAi resulted in growth inhibition for each of them, which became evident between days 1 and 4, depending on the cell line (Table 2). The cell lines also exhibited differences in morphology and DNA content (revealed by flow cytometry profiles) after RNAi induction. Thus, aaRSs from each class are essential for normal growth of mammalian stage T. brucei, and our data specifically provide genetic validation for seven key aaRSs as potential drug targets in this parasite. Analysis of recombinant T. brucei ThrRS demonstrated that the enzyme had catalytic efficiency similar to that of enzymes from other species and that it was also inhibited by borrelidin, a natural-product inhibitor of bacterial ThrRS. Borrelidin also inhibited parasite growth, providing preliminary chemical validation for this target.
To date, including the data reported here, 16 of the 24 aaRSs have been shown to be essential in BSF T. brucei (Table 1). Additionally, the aaRSs were examined as part of a genome-wide RNAi fitness screen in BSF cells (58). Of the genes we studied here, AsnRS, PheRS β, ArgRS, and GluRS were important for fitness in that screen, but knockdown of PheRSα, ValRS, ThrRS, or TrpRS-1 did not lead to reduced fitness. The level of RNA knockdown was not quantified in the screen, illustrating the importance of detailed analysis to obtain conclusive results. In the genome-wide RNAi screen, it may be that for highly essential genes, such as the aaRSs, leaky expression of RNAi constructs even in the absence of Tet led to selection of parasites containing mutations in the inducible T7 promoter. If this occurred, RNAi would no longer be expressed, leading to normal growth of cells and a false read of nonessentiality. That study also assessed the essentiality of the three aaRSs that localize to the mitochondrion, and none appeared essential in BSF parasites. However, RNAi showed that AspRS and TrpRS-1 were both essential in the insect (procyclic) stage (23, 24, 25) and analysis of a conditional null of mitochondrial TrpRS-2 in BSF parasites showed it to be essential (27). Thus, mitochondrial aaRSs and hence mitochondrial protein synthesis are also essential in the mammalian stage parasites, which is important for drug discovery, since the mitochondrial aaRSs are more divergent from eukaryotic enzymes (21).
While all of the aaRSs appear essential, they may not have equal potential as drug targets as implied by the differences in responses to RNAi expression knockdown. These included the time course of growth effects, the effect on cellular morphology, and the effect on the DNA flow cytometric profile. The data show that, of the eight genes studied here, knockdown of ThrRS, ArgRS, AsnRS, and PheRSβ led to the most rapid cell death phenotypes and to morphological and cell cycle changes. The different responses to RNAi knockdown may be due to differences in the levels of the remaining mRNAs and the proteins but might also reflect differing cellular requirements for each enzyme, including relative catalytic efficiency levels and the relationship of substrate concentrations to the enzyme Km. In addition, the cellular dependence on each enzyme may be affected by whether it functions in cytosolic and/or mitochondrial compartments, whether it is integrated within the MARS complex, and whether or not the enzyme has any alternative functions in cellular processes in addition to protein synthesis. While the degree of mRNA reduction and the extent of growth and morphological abnormalities do not entirely correlate, for the gene knockdowns that showed the most severe phenotypes (ThrRS, ArgRS, PheRSβ, and AsnRS), the mRNA levels at 24 h were reduced by 60% to 84%, while for those with more moderate effects (PheRSα, TrpRS-1, and ValRS), mRNA levels were reduced by 57% to 63% (Table 2). However, the data show in all cases that only a partial knockdown of the target is required to cause growth reductions, suggesting that even partial reduction in enzyme activity with inhibitors could affect parasite growth. This strengthens the potential of these aaRSs to be successfully targeted for drug discovery.
In assessing the potential effects of the MARS complex on essentiality, knockdown of one enzyme in the MARS complex could potentially lead to destabilization of the complex structure and to changes in the abundance of additional complex aaRSs. However, our analysis did not find any indication that knockdown of enzymes that are in the complex led to more-severe growth phenotypes than knockdown of those that are not. Knockdown of ArgRS, PheRSβ, and ThrRS, which are not part of the complex, caused severe growth effects, as also observed for TrpRS-1 and other aaRSs in the complex (21). Finally, it has been reported that aaRSs can have alternative roles in cell function, including the production of dinucleotide polyphosphates, which can act as second messengers (59), amino acid sensing (60), and transcriptional regulation (61). Thus, the involvement of an enzyme in a cellular process other than translation could lead to an enhanced response to gene knockdown with respect to growth and cell cycle changes in comparison to genes that are involved only in translation. Overall, it seems likely that several factors, including the degree of mRNA loss, the cellular requirement of a certain amount of aaRS, its cellular location, and perhaps other potential functions of the aaRS, contribute to the phenotype and could be considered when choosing a particular aaRS as a drug target based on essentiality data.
Finally, essentiality is only one consideration in evaluating whether or not an enzyme will be a good drug target. Both the druggability of the target and the likelihood of achieving selectivity versus the human host also need to be considered. Of the genes targeted in this current study, four (ThrRS, ArgRS, PheRS, and ValRS) have high (>0.6) druggability scores (Table 1), and among these, severe growth and morphological changes were observed upon knockdown of ThrRS and ArgRS, suggesting that the latter two enzymes have a strong potential to be successfully targeted. Furthermore, chemical validation also strengthens the case for a particular target, and our data showing that borrelidin inhibited T. brucei ThrRS and parasite growth provide preliminary chemical validation of the target, though at this stage, direct proof that the borrelidin growth effects are a consequence of ThrRS inhibition is lacking. Since ThrRS was found to localize in the cytoplasm and mitochondrion, it is possible that inhibition of cell growth may be a consequence of protein synthesis inhibition in both cellular compartments.
With regard to selectivity, comparison of the T. brucei ThrRS amino acid sequence with the human enzyme sequence shows that the two enzymes are highly conserved (see Fig. S1 in the supplemental material). This is also the case for the E. coli enzyme, and yet a recent study showed that differences in amino acid sequence in second-shell residues could be exploited to identify bisubstrate analogs of Thr and adenine that were highly (>300-fold) selective for the bacterial enzyme (62). X-ray structure analysis showed that the replacement of Leu361 for Cys361 in the bacterial enzyme created an enlarged binding pocket that allowed inhibitors to adopt a conformation when bound to the E. coli enzyme that was different from that seen when they were bound to the human enzyme. Examination of the putative Thr/ATP binding sites in T. brucei ThrRS shows that while the T. brucei enzyme, like the human enzyme, has a Leu residue at position 361 (TbThrRS Leu 409), other amino acid differences in second-shell residues are present that might be exploited for the identification of selective inhibitors (see Fig. S1). The borrelidin binding site, which is adjacent to the substrate binding site, was explored in bacterial aaRSs by site-directed mutagenesis, identifying six key residues that are conserved in enzymes that are inhibited by the compound (53). These residues are conserved between the T. brucei and human enzymes, suggesting that it may be hard to selectively target this site. However, structural data are not available to fully map the borrelidin binding site, making it difficult to determine if species-selective binding might also be possible at this site.
In summary, we demonstrate here that seven aaRSs, one of which has two subunits, are essential in the infectious mammalian form of T. brucei and we previously showed that AlaRs, ProRS, LeuRS, LysRS, and IleRS are also essential in the mammalian infective stage of the parasite (21, 30). In addition to our genetic validation of these 13 aaRS genes, others have shown an additional 5 to be essential in this relevant mammalian stage of the life cycle. That mRNA knockdown of only 60% to 70% was sufficient for cell growth arrest and, in several cases, cell death suggests that an aaRS inhibitor would be effective even if some enzyme activity remained in treated parasites. In addition, four of the enzymes analyzed in this study (ValRS, PheRS, ArgRS, and ThrRS) and six others with genetic validation data have high (i.e., >0.6) druggability scores (Table 1) and are both essential and likely to bind small drug-like molecules with good potency, making them excellent candidates for future drug discovery efforts. Finally, we also provide preliminary chemical validation of ThrRS by showing that borrelidin is an inhibitor both of T. brucei ThrRS and of T. brucei cell growth. Other aaRSs in T. brucei have also been chemically validated (Table 1); thus, the development of recombinant expression systems and enzyme assays for ThrRS and the other aaRSs readies them for future drug discovery efforts, including high-throughput screening for novel inhibitors.
Supplementary Material
ACKNOWLEDGMENTS
This work was supported by National Institutes of Health grants (R01 AI078962) (to K.S. and M.A.P.) and Welch Foundation grant I-1257 (to M.A.P.). M.A.P. holds the Beatrice and Miguel Elias Distinguished Chair in Biomedical Science and the Carolyn R. Bacon Professorship in Medical Science and Education. I.C. was awarded a National Institutes of Health postdoctoral fellowship (5T32AI007509-12).
Footnotes
Published ahead of print 21 February 2014
Supplemental material for this article may be found at http://dx.doi.org/10.1128/EC.00017-14.
REFERENCES
- 1.Kennedy PG. 2013. Clinical features, diagnosis, and treatment of human African trypanosomiasis (sleeping sickness). Lancet Neurol. 12:186–194. 10.1016/S1474-4422(12)70296-X [DOI] [PubMed] [Google Scholar]
- 2.Stuart K, Brun R, Croft S, Fairlamb A, Gurtler RE, McKerrow J, Reed S, Tarleton R. 2008. Kinetoplastids: related protozoan pathogens, different diseases. J. Clin. Invest. 118:1301–1310. 10.1172/JCI33945 [DOI] [PMC free article] [PubMed] [Google Scholar]
- 3.Jacobs RT, Nare B, Phillips MA. 2011. State of the art in African trypanosome drug discovery. Curr. Top. Med. Chem. 11:1255–1274. 10.2174/156802611795429167 [DOI] [PMC free article] [PubMed] [Google Scholar]
- 4.Yun O, Priotto G, Tong J, Flevaud L, Chappuis F. 2010. NECT is next: implementing the new drug combination therapy for Trypanosoma brucei gambiense sleeping sickness. PLoS Negl. Trop. Dis. 4:e720. 10.1371/journal.pntd.0000720 [DOI] [PMC free article] [PubMed] [Google Scholar]
- 5.Frearson JA, Wyatt PG, Gilbert IH, Fairlamb AH. 2007. Target assessment for antiparasitic drug discovery. Trends Parasitol. 23:589–595. 10.1016/j.pt.2007.08.019 [DOI] [PMC free article] [PubMed] [Google Scholar]
- 6.Brun R, Don R, Jacobs RT, Wang MZ, Barrett MP. 2011. Development of novel drugs for human African trypanosomiasis. Future Microbiol. 6:677–691. 10.2217/fmb.11.44 [DOI] [PubMed] [Google Scholar]
- 7.Agüero F, Al-Lazikani B, Aslett M, Berriman M, Buckner FS, Campbell RK, Carmona S, Carruthers IM, Chan AW, Chen F, Crowther GJ, Doyle MA, Hertz-Fowler C, Hopkins AL, McAllister G, Nwaka S, Overington JP, Pain A, Paolini GV, Pieper U, Ralph SA, Riechers A, Roos DS, Sali A, Shanmugam D, Suzuki T, Van Voorhis WC, Verlinde CL. 2008. Genomic-scale prioritization of drug targets: the TDR Targets database. Nat. Rev. Drug Discov. 7:900–907. 10.1038/nrd2684 [DOI] [PMC free article] [PubMed] [Google Scholar]
- 8.Magariños MP, Carmona SJ, Crowther GJ, Ralph SA, Roos DS, Shanmugam D, Van Voorhis WC, Agüero F. 2012. TDR Targets: a chemogenomics resource for neglected diseases. Nucleic Acids Res. 40:D1118–D1127. 10.1093/nar/gkr1053 [DOI] [PMC free article] [PubMed] [Google Scholar]
- 9.Hopkins AL, Groom CR. 2002. The druggable genome. Nat. Rev. Drug Discov. 1:727–730. 10.1038/nrd892 [DOI] [PubMed] [Google Scholar]
- 10.Baquero F, Blazquez J. 1997. Evolution of antibiotic resistance. Trends Ecol. Evol. 12:482–487. 10.1016/S0169-5347(97)01223-8 [DOI] [PubMed] [Google Scholar]
- 11.Gadakh B, Van Aerschot A. 2012. Aminoacyl-tRNA synthetase inhibitors as antimicrobial agents: a patent review from 2006 till present. Expert Opin. Ther. Pat. 22:1453–1465. 10.1517/13543776.2012.732571 [DOI] [PubMed] [Google Scholar]
- 12.Vondenhoff GH, Van Aerschot A. 2011. Aminoacyl-tRNA synthetase inhibitors as potential antibiotics. Eur. J. Med. Chem. 46:5227–5236. 10.1016/j.ejmech.2011.08.049 [DOI] [PubMed] [Google Scholar]
- 13.Niemann M, Schneider A, Cristodero M. 2011. Mitochondrial translation in trypanosomatids: a novel target for chemotherapy? Trends Parasitol. 27:429–433. 10.1016/j.pt.2011.03.011 [DOI] [PubMed] [Google Scholar]
- 14.Wilson DN. 2009. The A-Z of bacterial translation inhibitors. Crit. Rev. Biochem. Mol. Biol. 44:393–433. 10.3109/10409230903307311 [DOI] [PubMed] [Google Scholar]
- 15.Perona JJ, Hadd A. 2012. Structural diversity and protein engineering of the aminoacyl-tRNA synthetases. Biochemistry 51:8705–8729. 10.1021/bi301180x [DOI] [PubMed] [Google Scholar]
- 16.Delarue M. 1995. Partition of aminoacyl-tRNA synthetases in two different structural classes dating back to early metabolism: implications for the origin of the genetic code and the nature of protein sequences. J. Mol. Evol. 41:703–711 [DOI] [PubMed] [Google Scholar]
- 17.Nagel GM, Doolittle RF. 1991. Evolution and relatedness in two aminoacyl-tRNA synthetase families. Proc. Natl. Acad. Sci. U. S. A. 88:8121–8125. 10.1073/pnas.88.18.8121 [DOI] [PMC free article] [PubMed] [Google Scholar]
- 18.O'Donoghue P, Luthey-Schulten Z. 2003. On the evolution of structure in aminoacyl-tRNA synthetases. Microbiol. Mol. Biol. Rev. 67:550–573. 10.1128/MMBR.67.4.550-573.2003 [DOI] [PMC free article] [PubMed] [Google Scholar]
- 19.Hoepfner D, McNamara CW, Lim CS, Studer C, Riedl R, Aust T, McCormack SL, Plouffe DM, Meister S, Schuierer S, Plikat U, Hartmann N, Staedtler F, Cotesta S, Schmitt EK, Petersen F, Supek F, Glynne RJ, Tallarico JA, Porter JA, Fishman MC, Bodenreider C, Diagana TT, Movva NR, Winzeler EA. 2012. Selective and specific inhibition of the Plasmodium falciparum lysyl-tRNA synthetase by the fungal secondary metabolite cladosporin. Cell Host Microbe 11:654–663. 10.1016/j.chom.2012.04.015 [DOI] [PMC free article] [PubMed] [Google Scholar]
- 20.Gowri VS, Ghosh I, Sharma A, Madhubala R. 2012. Unusual domain architecture of aminoacyl tRNA synthetases and their paralogs from Leishmania major. BMC Genomics 13:621. 10.1186/1471-2164-13-621 [DOI] [PMC free article] [PubMed] [Google Scholar]
- 21.Cestari I, Kalidas S, Monnerat S, Anupama A, Phillips MA, Stuart K. 2013. A multiple aminoacyl-tRNA synthetase complex that enhances tRNA-aminoacylation in African trypanosomes. Mol. Cell. Biol. 33:4872–4888. 10.1128/MCB.00711-13 [DOI] [PMC free article] [PubMed] [Google Scholar]
- 22.Alfonzo JD, Soll D. 2009. Mitochondrial tRNA import—the challenge to understand has just begun. Biol. Chem. 390:717–722. 10.1515/BC.2009.101 [DOI] [PMC free article] [PubMed] [Google Scholar]
- 23.Tschopp F, Charriere F, Schneider A. 2011. In vivo study in Trypanosoma brucei links mitochondrial transfer RNA import to mitochondrial protein import. EMBO Rep. 12:825–832. 10.1038/embor.2011.111 [DOI] [PMC free article] [PubMed] [Google Scholar]
- 24.Español Y, Thut D, Schneider A, Ribas de Pouplana L. 2009. A mechanism for functional segregation of mitochondrial and cytosolic genetic codes. Proc. Natl. Acad. Sci. U. S. A. 106:19420–19425. 10.1073/pnas.0909937106 [DOI] [PMC free article] [PubMed] [Google Scholar]
- 25.Charrière F, O'Donoghue P, Helgadóttir S, Maréchal-Drouard L, Cristodero M, Horn EK, Söll D, Schneider A. 2009. Dual targeting of a tRNAAsp requires two different aspartyl-tRNA synthetases in Trypanosoma brucei. J. Biol. Chem. 284:16210–16217. 10.1074/jbc.M109.005348 [DOI] [PMC free article] [PubMed] [Google Scholar]
- 26.Charrière F, Helgadóttir S, Horn EK, Söll D, Schneider A. 2006. Dual targeting of a single tRNA(Trp) requires two different tryptophanyl-tRNA synthetases in Trypanosoma brucei. Proc. Natl. Acad. Sci. U. S. A. 103:6847–6852. 10.1073/pnas.0602362103 [DOI] [PMC free article] [PubMed] [Google Scholar]
- 27.Cristodero M, Seebeck T, Schneider A. 2010. Mitochondrial translation is essential in bloodstream forms of Trypanosoma brucei. Mol. Microbiol. 78:757–769. 10.1111/j.1365-2958.2010.07368.x [DOI] [PubMed] [Google Scholar]
- 28.Rinehart J, Horn EK, Wei D, Soll D, Schneider A. 2004. Non-canonical eukaryotic glutaminyl- and glutamyl-tRNA synthetases form mitochondrial aminoacyl-tRNA in Trypanosoma brucei. J. Biol. Chem. 279:1161–1166. 10.1074/jbc.M310100200 [DOI] [PubMed] [Google Scholar]
- 29.Rettig J, Wang Y, Schneider A, Ochsenreiter T. 2012. Dual targeting of isoleucyl-tRNA synthetase in Trypanosoma brucei is mediated through alternative trans-splicing. Nucleic Acids Res. 40:1299–1306. 10.1093/nar/gkr794 [DOI] [PMC free article] [PubMed] [Google Scholar]
- 30.Cestari I, Stuart K. 2013. Inhibition of isoleucyl-tRNA synthetase as a potential treatment for human African trypanosomiasis. J. Biol. Chem. 288:14256–14263. 10.1074/jbc.M112.447441 [DOI] [PMC free article] [PubMed] [Google Scholar]
- 31.Zhao Y, Wang Q, Meng Q, Ding D, Yang H, Gao G, Li D, Zhu W, Zhou H. 2012. Identification of Trypanosoma brucei leucyl-tRNA synthetase inhibitors by pharmacophore- and docking-based virtual screening and synthesis. Bioorg. Med. Chem. 20:1240–1250. 10.1016/j.bmc.2011.12.035 [DOI] [PubMed] [Google Scholar]
- 32.Ding D, Meng Q, Gao G, Zhao Y, Wang Q, Nare B, Jacobs R, Rock F, Alley MR, Plattner JJ, Chen G, Li D, Zhou H. 2011. Design, synthesis, and structure-activity relationship of Trypanosoma brucei leucyl-tRNA synthetase inhibitors as antitrypanosomal agents. J. Med. Chem. 54:1276–1287. 10.1021/jm101225g [DOI] [PubMed] [Google Scholar]
- 33.Shibata S, Gillespie JR, Kelley AM, Napuli AJ, Zhang Z, Kovzun KV, Pefley RM, Lam J, Zucker FH, Van Voorhis WC, Merritt EA, Hol WG, Verlinde CL, Fan E, Buckner FS. 2011. Selective inhibitors of methionyl-tRNA synthetase have potent activity against Trypanosoma brucei infection in mice. Antimicrob. Agents Chemother. 55:1982–1989. 10.1128/AAC.01796-10 [DOI] [PMC free article] [PubMed] [Google Scholar]
- 34.Koh CY, Kim JE, Shibata S, Ranade RM, Yu M, Liu J, Gillespie JR, Buckner FS, Verlinde CL, Fan E, Hol WG. 2012. Distinct states of methionyl-tRNA synthetase indicate inhibitor binding by conformational selection. Structure 20:1681–1691. 10.1016/j.str.2012.07.011 [DOI] [PMC free article] [PubMed] [Google Scholar]
- 35.Shibata S, Gillespie JR, Ranade RM, Koh CY, Kim JE, Laydbak JU, Zucker FH, Hol WG, Verlinde CL, Buckner FS, Fan E. 2012. Urea-based inhibitors of Trypanosoma brucei methionyl-tRNA synthetase: selectivity and in vivo characterization. J. Med. Chem. 55:6342–6351. 10.1021/jm300303e [DOI] [PMC free article] [PubMed] [Google Scholar]
- 36.Merritt EA, Arakaki TL, Gillespie JR, Larson ET, Kelley A, Mueller N, Napuli AJ, Kim J, Zhang L, Verlinde CL, Fan E, Zucker F, Buckner FS, van Voorhis WC, Hol WG. 2010. Crystal structures of trypanosomal histidyl-tRNA synthetase illuminate differences between eukaryotic and prokaryotic homologs. J. Mol. Biol. 397:481–494. 10.1016/j.jmb.2010.01.051 [DOI] [PMC free article] [PubMed] [Google Scholar]
- 37.Merritt EA, Arakaki TL, Gillespie R, Napuli AJ, Kim JE, Buckner FS, Van Voorhis WC, Verlinde CL, Fan E, Zucker F, Hol WG. 2011. Crystal structures of three protozoan homologs of tryptophanyl-tRNA synthetase. Mol. Biochem. Parasitol. 177:20–28. 10.1016/j.molbiopara.2011.01.003 [DOI] [PMC free article] [PubMed] [Google Scholar]
- 38.Willert EK, Phillips MA. 2008. Regulated expression of an essential allosteric activator of polyamine biosynthesis in African trypanosomes. PLoS Pathog. 4:e1000183. 10.1371/journal.ppat.1000183 [DOI] [PMC free article] [PubMed] [Google Scholar]
- 39.Kalidas S, Li Q, Phillips MA. 2011. A Gateway((R)) compatible vector for gene silencing in bloodstream form Trypanosoma brucei. Mol. Biochem. Parasitol. 178:51–55. 10.1016/j.molbiopara.2011.03.002 [DOI] [PMC free article] [PubMed] [Google Scholar]
- 40.Brun R, Schonenberger M. 1979. Cultivation and in vitro cloning or procyclic culture forms of Trypanosoma brucei in a semi-defined medium. Acta Trop. 36:289–292 [PubMed] [Google Scholar]
- 41.Redmond S, Vadivelu J, Field MC. 2003. RNAit: an automated web-based tool for the selection of RNAi targets in Trypanosoma brucei. Mol. Biochem. Parasitol. 128:115–118. 10.1016/S0166-6851(03)00045-8 [DOI] [PubMed] [Google Scholar]
- 42.Inoue M, Nakamura Y, Yasuda K, Yasaka N, Hara T, Schnaufer A, Stuart K, Fukuma T. 2005. The 14-3-3 proteins of Trypanosoma brucei function in motility, cytokinesis, and cell cycle. J. Biol. Chem. 280:14085–14096. 10.1074/jbc.M412336200 [DOI] [PubMed] [Google Scholar]
- 43.Wirtz E, Leal S, Ochatt C, Cross G. 1999. A tightly regulated inducible expression system for conditional gene knock-outs and dominant-negative genetics in T. brucei. Mol. Biochem. Parasitol. 99:89–101. 10.1016/S0166-6851(99)00002-X [DOI] [PubMed] [Google Scholar]
- 44.Schnaufer A, Panigrahi AK, Panicucci B, Igo RP, Jr, Wirtz E, Salavati R, Stuart K. 2001. An RNA ligase essential for RNA editing and survival of the bloodstream form of Trypanosoma brucei. Science 291:2159–2162. 10.1126/science.1058655 [DOI] [PubMed] [Google Scholar]
- 45.Brenndörfer M, Boshart M. 2010. Selection of reference genes for mRNA quantification in Trypanosoma brucei. Mol. Biochem. Parasitol. 172:52–55. 10.1016/j.molbiopara.2010.03.007 [DOI] [PubMed] [Google Scholar]
- 46.Winer J, Jung CK, Shackel I, Williams PM. 1999. Development and validation of real-time quantitative reverse transcriptase-polymerase chain reaction for monitoring gene expression in cardiac myocytes in vitro. Anal. Biochem. 270:41–49. 10.1006/abio.1999.4085 [DOI] [PubMed] [Google Scholar]
- 47.Tu X, Wang CC. 2004. The involvement of two cdc2-related kinases (CRKs) in Trypanosoma brucei cell cycle regulation and the distinctive stage-specific phenotypes caused by CRK3 depletion. J. Biol. Chem. 279:20519–20528. 10.1074/jbc.M312862200 [DOI] [PubMed] [Google Scholar]
- 48.Tu X, Wang CC. 2005. Coupling of posterior cytoskeletal morphogenesis to the G1/S transition in the Trypanosoma brucei cell cycle. Mol. Biol. Cell 16:97–105. 10.1091/mbc.E04-05-0368 [DOI] [PMC free article] [PubMed] [Google Scholar]
- 49.Carnes J, Schnaufer A, McDermott SM, Domingo G, Proff R, Steinberg AG, Kurtz I, Stuart K. 2012. Mutational analysis of Trypanosoma brucei editosome proteins KREPB4 and KREPB5 reveals domains critical for function. RNA 18:1897–1909. 10.1261/rna.035048.112 [DOI] [PMC free article] [PubMed] [Google Scholar]
- 50.Cestari I, Stuart K. 2013. A spectrophotometric assay for quantitative measurement of aminoacyl-tRNA synthetase activity. J. Biomol. Screen. 18:490–497. 10.1177/1087057112465980 [DOI] [PMC free article] [PubMed] [Google Scholar]
- 51.Panigrahi AK, Ogata Y, Zikova A, Anupama A, Dalley RA, Acestor N, Myler PJ, Stuart KD. 2009. A comprehensive analysis of Trypanosoma brucei mitochondrial proteome. Proteomics 9:434–450. 10.1002/pmic.200800477 [DOI] [PMC free article] [PubMed] [Google Scholar]
- 52.Ling J, Peterson KM, Simonovic I, Cho C, Soll D, Simonovic M. 2012. Yeast mitochondrial threonyl-tRNA synthetase recognizes tRNA isoacceptors by distinct mechanisms and promotes CUN codon reassignment. Proc. Natl. Acad. Sci. U. S. A. 109:3281–3286. 10.1073/pnas.1200109109 [DOI] [PMC free article] [PubMed] [Google Scholar]
- 53.Ruan B, Bovee ML, Sacher M, Stathopoulos C, Poralla K, Francklyn CS, Soll D. 2005. A unique hydrophobic cluster near the active site contributes to differences in borrelidin inhibition among threonyl-tRNA synthetases. J. Biol. Chem. 280:571–577. 10.1074/jbc.M411039200 [DOI] [PubMed] [Google Scholar]
- 54.Jackson KE, Pham JS, Kwek M, De Silva NS, Allen SM, Goodman CD, McFadden GI, de Pouplana LR, Ralph SA. 2012. Dual targeting of aminoacyl-tRNA synthetases to the apicoplast and cytosol in Plasmodium falciparum. Int. J. Parasitol. 42:177–186. 10.1016/j.ijpara.2011.11.008 [DOI] [PubMed] [Google Scholar]
- 55.Gao YM, Wang XJ, Zhang J, Li M, Liu CX, An J, Jiang L, Xiang WS. 2012. Borrelidin, a potent antifungal agent: insight into the antifungal mechanism against Phytophthora sojae. J. Agric. Food Chem. 60:9874–9881. 10.1021/jf302857x [DOI] [PubMed] [Google Scholar]
- 56.Habibi D, Ogloff N, Jalili RB, Yost A, Weng AP, Ghahary A, Ong CJ. 2012. Borrelidin, a small molecule nitrile-containing macrolide inhibitor of threonyl-tRNA synthetase, is a potent inducer of apoptosis in acute lymphoblastic leukemia. Invest. New Drugs 30:1361–1370. 10.1007/s10637-011-9700-y [DOI] [PubMed] [Google Scholar]
- 57.Mariner KR, Ooi N, Roebuck D, O'Neill AJ, Chopra I. 2011. Further characterization of Bacillus subtilis antibiotic biosensors and their use for antibacterial mode-of-action studies. Antimicrob. Agents Chemother. 55:1784–1786. 10.1128/AAC.01710-10 [DOI] [PMC free article] [PubMed] [Google Scholar]
- 58.Alsford S, Turner DJ, Obado SO, Sanchez-Flores A, Glover L, Berriman M, Hertz-Fowler C, Horn D. 2011. High-throughput phenotyping using parallel sequencing of RNA interference targets in the African trypanosome. Genome Res. 21:915–924. 10.1101/gr.115089.110 [DOI] [PMC free article] [PubMed] [Google Scholar]
- 59.Tshori S, Razin E, Nechushtan H. 28 March 2013. Amino-acyl tRNA synthetases generate dinucleotide polyphosphates as second messengers: functional implications. Top. Curr. Chem. 10.1007/128_2013_426 [DOI] [PubMed] [Google Scholar]
- 60.Han JM, Jeong SJ, Park MC, Kim G, Kwon NH, Kim HK, Ha SH, Ryu SH, Kim S. 2012. Leucyl-tRNA synthetase is an intracellular leucine sensor for the mTORC1-signaling pathway. Cell 149:410–424. 10.1016/j.cell.2012.02.044 [DOI] [PubMed] [Google Scholar]
- 61.Ofir-Birin Y, Fang P, Bennett SP, Zhang HM, Wang J, Rachmin I, Shapiro R, Song J, Dagan A, Pozo J, Kim S, Marshall AG, Schimmel P, Yang XL, Nechushtan H, Razin E, Guo M. 2013. Structural switch of lysyl-tRNA synthetase between translation and transcription. Mol. Cell 49:30–42. 10.1016/j.molcel.2012.10.010 [DOI] [PMC free article] [PubMed] [Google Scholar]
- 62.Teng M, Hilgers MT, Cunningham ML, Borchardt A, Locke JB, Abraham S, Haley G, Kwan BP, Hall C, Hough GW, Shaw KJ, Finn J. 2013. Identification of bacteria-selective threonyl-tRNA synthetase substrate inhibitors by structure-based design. J. Med. Chem. 56:1748–1760. 10.1021/jm301756m [DOI] [PubMed] [Google Scholar]
- 63.Metlitskaya A, Kazakov T, Kommer A, Pavlova O, Praetorius-Ibba M, Ibba M, Krasheninnikov I, Kolb V, Khmel I, Severinov K. 2006. Aspartyl-tRNA synthetase is the target of peptide nucleotide antibiotic Microcin C. J. Biol. Chem. 281:18033–18042. 10.1074/jbc.M513174200 [DOI] [PubMed] [Google Scholar]
- 64.Balg C, Blais SP, Bernier S, Huot JL, Couture M, Lapointe J, Chenevert R. 2007. Synthesis of beta-ketophosphonate analogs of glutamyl and glutaminyl adenylate, and selective inhibition of the corresponding bacterial aminoacyl-tRNA synthetases. Bioorg. Med. Chem. 15:295–304. 10.1016/j.bmc.2006.09.056 [DOI] [PubMed] [Google Scholar]
- 65.Miyamoto Y, Machida K, Mizunuma M, Emoto Y, Sato N, Miyahara K, Hirata D, Usui T, Takahashi H, Osada H, Miyakawa T. 2002. Identification of Saccharomyces cerevisiae isoleucyl-tRNA synthetase as a target of the G1-specific inhibitor Reveromycin A. J. Biol. Chem. 277:28810–28814. 10.1074/jbc.M203827200 [DOI] [PubMed] [Google Scholar]
- 66.Paulander W, Andersson DI, Maisnier-Patin S. 2010. Amplification of the gene for isoleucyl-tRNA synthetase facilitates adaptation to the fitness cost of mupirocin resistance in Salmonella enterica. Genetics 185:305–312. 10.1534/genetics.109.113514 [DOI] [PMC free article] [PubMed] [Google Scholar]
- 67.Petraitis V, Petraitiene R, Kelaher AM, Sarafandi AA, Sein T, Mickiene D, Bacher J, Groll AH, Walsh TJ. 2004. Efficacy of PLD-118, a novel inhibitor of candida isoleucyl-tRNA synthetase, against experimental oropharyngeal and esophageal candidiasis caused by fluconazole-resistant C. albicans. Antimicrob. Agents Chemother. 48:3959–3967. 10.1128/AAC.48.10.3959-3967.2004 [DOI] [PMC free article] [PubMed] [Google Scholar]
- 68.Houge-Frydrych CS, Gilpin ML, Skett PW, Tyler JW. 2000. SB-203207 and SB-203208, two novel isoleucyl tRNA synthetase inhibitors from a Streptomyces sp. II. Structure determination. J. Antibiot. (Tokyo) 53:364–372. 10.7164/antibiotics.53.364 [DOI] [PubMed] [Google Scholar]
- 69.Houge-Frydrych CS, Readshaw SA, Bell DJ. 2000. SB-219383, a novel tyrosyl tRNA synthetase inhibitor from a Micromonospora sp. II. Structure determination. J. Antibiot. (Tokyo) 53:351–356. 10.7164/antibiotics.53.351 [DOI] [PubMed] [Google Scholar]
- 70.Green LS, Bullard JM, Ribble W, Dean F, Ayers DF, Ochsner UA, Janjic N, Jarvis TC. 2009. Inhibition of methionyl-tRNA synthetase by REP8839 and effects of resistance mutations on enzyme activity. Antimicrob. Agents Chemother. 53:86–94. 10.1128/AAC.00275-08 [DOI] [PMC free article] [PubMed] [Google Scholar]
- 71.Roth A, Creppy EE, Kane A, Bacha H, Steyn PS, Roschenthaler R, Dirheimer G. 1989. Influence of ochratoxin B on the ochratoxin A inhibition of phenylalanyl-tRNA formation in vitro and protein synthesis in hepatoma tissue culture cells. Toxicol. Lett. 45:307–313. 10.1016/0378-4274(89)90022-2 [DOI] [PubMed] [Google Scholar]
- 72.Jarvest RL, Erskine SG, Forrest AK, Fosberry AP, Hibbs MJ, Jones JJ, O'Hanlon PJ, Sheppard RJ, Worby A. 2005. Discovery and optimisation of potent, selective, ethanolamine inhibitors of bacterial phenylalanyl tRNA synthetase. Bioorg. Med. Chem. Lett. 15:2305–2309. 10.1016/j.bmcl.2005.03.003 [DOI] [PubMed] [Google Scholar]
- 73.Zhou H, Sun L, Yang XL, Schimmel P. 2013. ATP-directed capture of bioactive herbal-based medicine on human tRNA synthetase. Nature 494:121–124. 10.1038/nature11774 [DOI] [PMC free article] [PubMed] [Google Scholar]
- 74.Stefanska AL, Fulston M, Houge-Frydrych CS, Jones JJ, Warr SR. 2000. A potent seryl tRNA synthetase inhibitor SB-217452 isolated from a Streptomyces species. J. Antibiot. (Tokyo) 53:1346–1353. 10.7164/antibiotics.53.1346 [DOI] [PubMed] [Google Scholar]
- 75.Xiao ZP, Ma TW, Liao ML, Feng YT, Peng XC, Li JL, Li ZP, Wu Y, Luo Q, Deng Y, Liang X, Zhu HL. 2011. Tyrosyl-tRNA synthetase inhibitors as antibacterial agents: synthesis, molecular docking and structure-activity relationship analysis of 3-aryl-4-arylaminofuran-2(5H)-ones. Eur. J. Med. Chem. 46:4904–4914. 10.1016/j.ejmech.2011.07.047 [DOI] [PubMed] [Google Scholar]
- 76.Greenwood RC, Gentry DR. 2002. Confirmation of the antibacterial mode of action of SB-219383, a novel tyrosyl tRNA synthetase inhibitor from a Micromonospora sp. J. Antibiot. (Tokyo) 55:423–426. 10.7164/antibiotics.55.423 [DOI] [PubMed] [Google Scholar]
- 77.Jakubowski H. 1982. The mechanism of inhibition of valyl-tRNA synthetase by S-adenosylhomocysteine. Biochim. Biophys. Acta 709:325–331. 10.1016/0167-4838(82)90475-7 [DOI] [PubMed] [Google Scholar]
- 78.Siegel TN, Hekstra DR, Wang X, Dewell S, Cross GA. 2010. Genome-wide analysis of mRNA abundance in two life-cycle stages of Trypanosoma brucei and identification of splicing and polyadenylation sites. Nucleic Acids Res. 38:4946–4957. 10.1093/nar/gkq237 [DOI] [PMC free article] [PubMed] [Google Scholar]
Associated Data
This section collects any data citations, data availability statements, or supplementary materials included in this article.