Abstract
Primary open angle glaucoma (POAG) is characterized by optic disc cupping and irreversible loss of retinal ganglion cells. Few genes have been detected that influence POAG susceptibility and little is known about its genetic architecture. In this study, we employed exome sequencing on three members from a high frequency POAG family to identify the risk factors of POAG in Chinese population. Text-mining method was applied to identify genes associated with glaucoma in literature, and protein–protein interaction networks were constructed. Furthermore, reverse transcription PCR and Western blot were performed to confirm the differential gene expression. Six genes, baculoviral inhibitors of apoptosis protein repeat containing 6 (BIRC6), CD2, luteinizing hormone/choriogonadotropin receptor (LHCGR), polycystic kidney and hepatic disease gene 1 (PKHD1), phenylalanine hydroxylase (PAH) and fucosyltransferase 7 (FUT7), which might be associated with POAG, were identified. Both the mRNA expression levels and protein expression levels of HSP27 were increased in astrocytes from POAG patients compared with those from normal control, suggesting that mutation in CD2 might pose a risk for POAG in Chinese population. In conclusion, novel rare variants detected by exome sequencing may hold the key to unravelling the remaining contribution of genetics to complex diseases such as POAG.
Keywords: primary open angle glaucoma, exome sequencing, Chinese population
Introduction
Primary open angle glaucoma, characterized by optic disc cupping and irreversible loss of retinal ganglion cells, is the most common form of glaucoma, affecting 1–2% of the population over age 40 1. Evidence suggest that black race, older age, severe myopia, family history, elevated intraocular pressure (IOP) and low diastolic perfusion pressure are risk factors for POAG 2–4. In recent years, some researchers suggest that diabetes mellitus, helicobacter pylori infection, elevated systolic blood pressure and migraine may also be associated with the risk of POAG 5,6. Although POAG is thought to be a genetically heterogeneous disorder that results from the interaction of multiple genes and environmental influences, the pathogenic mechanism of POAG is unknown.
Familial aggregation and heritable tendencies of POAG have long been recognized for this complex and heterogeneous disorder 4,7,8. At least 20 genetic loci have been found to be associated with POAG. Among them, 14 chromosomal loci were designated GLC1A to GLC1N 9–13. In addition, other genetic loci for POAG were continued to be identified in different populations in these years, such as 15q22-q24 in Chinese population 14, 2q33-q34 and 10p12-p13 in African descent 15. However, mutations in these regions are responsible for a small fraction of POAG cases. For example, GLC1A (myocilin) is responsible for about 36% of juvenile-onset and 2–4% of adult-onset POAG cases 16,17. Mutations in optineurin (OPTN; arguably, the second POAG gene) were initially found in 16.7% of families with hereditary and adult-onset POAG 18. Additional loci or genes involved in the development of POAG are still needed to be identified.
Exome sequencing is a technically feasible and cost-effective methods, which has been used to identify new causal mutations and genes for unresolved rare disorders in recent years 19–21. In this study, we used exome sequencing to search for the risk factors for POAG in Chinese population. By combining with bioinformatics methods, six candidate genes for POAG were identified. Furthermore, experimental verifications were performed for one of these genes.
Materials and methods
Families
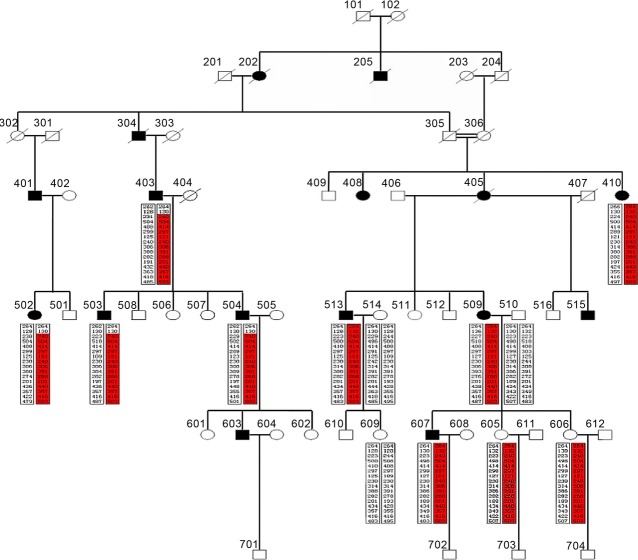
The clinical samples in this study are extracted from a Li family existing in our hospital. This family is collected from ChongQing province in China and is characterized by an unusual high frequency of POAG (Fig. 1). Detailed phenotypic information is collected at the time of enrolment and put into a database in a de-identified manner for the facilitation of genetic association studies. In this family, 16 persons suffered from POAG, including six females and 10 males. The morbidity is 27.5%. From the database information, we selected members of 303, 305 and 607 for the exome sequencing phase of the study. Member 303 (female) has no blood relationship with member 305 (male) and member 607 (male). Member 305 is the ancestor of member 607.
Figure 1.
The glaucoma genetic map for Li family. ‘/’ indicates that persons had passed away; ‘○’ represents female; ‘□’ represents male. The sequence marked in red represents the susceptibility genes inherited from his (her) ancestor. The persons marked in black represent glaucoma sufferer, and persons without black marker do not suffer from glaucoma.
All participants provided written informed consent. The project was approved by the medical ethics committee of Daping hospital of 3rd military medical university and all procedures were conducted according to the tenets of the Declaration of Helsinki.
Exome sequencing, quality control, alignment and variant calling
Genomic DNA was extracted from whole blood using a DNA extraction kit (Qiagen, Valencia, CA, USA). Samples were exome sequenced with paired-end mapping, which is a large-scale genome-sequencing method to identify structural variants (SVs) ˜3 kb or larger that combines the rescue and capture of paired ends of 3-kb fragments, massive 454 sequencing and a computational approach to map DNA reads onto a reference genome 22. Sequencing was performed according to standard protocols. The targeted exonic regions of all sequenced samples were sequenced to an average coverage of 64.3× ± 13, which translated to at least 5× coverage of ˜86% of the Human Genome Organization–defined protein-coding regions in each participant. The raw sequence data were preformed quality control checks with fastQC software (http://www.bioinformatics.babraham.ac.uk/projects/download.html) to ensure that there are no hidden problems, which might be more difficult to detect at a later stage. Paired-end reads were aligned to the human reference genome (National Center for Biotechnology Information Build 19) with Burrows-Wheeler Aligner software 23 with a threshold of q = 20. Single-nucleotide polymorphism (SNP) and insertion and deletion (INDEL) calling were performed with GATK unified genotyper program. The SNPs or INDELs with minimum read depth <10 and maximum read depth >20,000 were filtered out. Besides, the quality score >20 for SNP calling and quality score >50 for INDELs calling were selected as cut-off criteria. Annovar 24 was used for annotating variants identified from the sequence data. This software provides each variant with a genomic context (non-synonymous or splice-site coding, gene name, transcript, associated gene ontology [GO] term, etc.).
Identification of genes associated with glaucoma using texting mining
The text-mining technique has become a critical technique for identify genes related to diseases. At the same time, the PubMed database (http://www.ncbi.nlm.nih.gov/pubmed), which comprises more than 21 million citations for biomedical literature, offers an enriched source for us to explore the genes across human disease 25. To identify the genes associated with glaucoma, we first mined from the PubMed database using perl program with keywords ‘gene symbol’ and ‘glaucoma’ 26. Then, the articles associated with glaucoma were screened manually.
Protein–protein interaction (PPI) network construction
The human protein reference database (HPRD) is a database of curated proteomic information pertaining to human proteins 27. The biological general repository for interaction data sets (BioGRID) is a curated biological database of physical and genetic interactions available at http://www.thebiogrid.org 28. Total 39,240 pairs of PPIs were collected from HRPD and 379,426 pairs of PPIs were collected from BioGRID. By combining the two databases, total 326,119 unique PPI pairs were collected.
The putative genes were mapped to the PPI data collected from HPRD and BioGRID databases. The relationships among putative genes and their neighbour genes were reserved and visualized using Cytoscape 29.
Identification of differentially expressed genes (DEGs) in glaucoma
The gene expression profile of GSE2378 was downloaded from gene expression omnibus (GEO) database, which was based on the platform of Affymetrix Human genome U95 array and the platform of U95 version 2 array. This data set was deposited by Hernandez et al. 30. Total 15 genechips were available, including eight genechips from optic nerve head astrocytes of donors with glaucoma and seven genechips from optic nerve head astrocytes of donors without glaucoma.
We first converted the probe-level data in probe cell intensity files into expression measures. For each sample, the expression values of all probes for a given gene were reduced to a single value by taking the average expression value. And then, we imputed missing data 31 and performed robust multichip averaging normalization 32. The linear models for microarray data (LIMMA) package 33 in R statistical language 34 was used to identify DEGs in astrocytes from patients with glaucoma and without glaucoma. To circumvent the multi-test problem, which might induce too much false-positive results, the Benjamini–Hochberg method 35 was used to adjust the raw P values into false discovery rate (FDR). Fold change (i.e. fold increase or fold decrease) was calculated between experimental and control groups. The FDR less than 0.05 and fold change >1.5 or <−1.5 were selected as cut-off criteria.
Functional enrichment analysis based on GO and pathway
The database for annotation, visualization and integrated discovery (DAVID) provides a comprehensive set of functional annotation tools for investigators to understand biological meaning behind large list of genes 36. In this study, we inputted each group of genes into DAVID v6.7 to search for over-representation in GO categories and Kyoto Encyclopedia of Genes and Genomes (KEGG) pathways.
Cell culture
Optic nerve head astrocytes, isolated from POAG patients (POAG cells) and healthy controls (Normal cells), were purchased from Shanghai Peace eye hospital (Shanghai, China). Primary cultures of astrocytes were prepared from human cadaver eyes with POAG or without eye disease obtained within 24 hrs post-mortem. Astrocytes were cultured as described in previous studies 37. Briefly, cells were maintained in DMEM supplemented with 10% foetal bovine serum (Solarbio, Beijing, China), 100 μg/ml penicillin (Sangon, Shanghai, China) and 100 μg/ml streptomycin (Sangon). Cells were propagated until passage three at 37°C in a humidified atmosphere containing 5% CO2. Cell medium was replaced every 2–3 days.
Plasmids and constructs
The full-length CD2 coding region was PCR-amplified from the vector using the CD2-1 (normal cells) primer (5′-CGCCATATGGCGATGCTGCTCACCTACATGGA-3′) and the CD2-2 (POAG cells) primer (5′-CCGGAATTCCGGTTAAATGGTATTTAGATTT-3′). The PCR product was cloned in-frame into the pGBKT7 (BD Clontech, Mountain View, CA, USA) using the NdeI and EcoRI (Promega, Shanghai, China) sites. PCR cycling conditions were as follows: 3 min. at 96°C, 30 cycles of 1 min. at 96°C, 1 min. at 56°C and 1.5 min. at 72°C. All constructs were produced using standard molecular methods and confirmed by DNA sequencing.
Semiquantitative RT-PCR
Total RNA derived from normal cells and POAG cells transfected with CD2 was extracted using TRIzol (Invitrogen, Carlsbad, CA, USA) according to the manufacturer's instructions. For each individual, 5 μg of total RNA was reversely transcribed into cDNA using the oligo(dT)18 primer and M-MLV reverse transcriptase (Promega, Fitchburg, WI, USA) according to the manufacturer's instructions. Real-time quantitative PCR was used to determine the HSP27 transcripts. β-actin was used at the same time as an internal control. Primer sequences for HSP27 and β-actin were shown in Table 1 PCR reactions were performed in a 25 μl reaction mixture containing 2.5 μl 10× Taq DNA polymerase buffer, 1.0 μl Taq DNA polymerase, 2.0 μl 25 mM MgCl2, 0.5 μl dNTP, 2.0 μl forward and reverse primers, 2.0 μl cDNA samples and 15 μl sterile water. Reactions were performed through the following conditions: one cycle of 94°C for 5 min. followed by 30 cycles of (94°C 30 sec., 60°C 40 sec., 72°C 30 sec.). Each sample was run in duplicate, and the expression level of each gene was analysed on computer (SDS2.3 software; ABI, Shanghai, China).
Table 1.
Primer sequences (Fw: forward; Rv: reverse) of target and reference genes used for real-time PCR analyses
| Primer | Direction | Sequences (5′–3′) |
|---|---|---|
| HSP 27 | Fw Rv |
5′-AGC AAC CGA AGT TTT CAC TCC-3′ 5′-TAA TAC GAC TCA CTA TAG GGG-3′ |
| β-actin | Fw Rv |
5′-TTC CAG CCT TCC TTC CTGGG-3′ 5′-TTG CGC TCA GGA GGA GCAAT-3′ |
SDS-PAGE analysis
SDS-PAGE was performed according to the method of Yan et al. 38 with some modifications in the electrophoresis apparatus and conditions. Five millilitre 12% resolving gel (30% acrylamide, 1.5 M Tris-Hcl, pH 8.8, 10% SDS, 10% ammonium persulfate and TEMED) and 2 ml 5% stacking gel (30% acrylamide solution, 1.0 M Tris-Hcl, pH 6.8, 10% SDS, 10% ammonium persulfate and TEMED) were prepared according to standard protocol. A total of 200 μl non-induced culture or 50 μl induced culture was centrifuged at 13,000 × g under 4°C for 3 min. Then, the precipitation was re-suspended in 20 μl distilled water and mixed with an equal volume of 2× SDS-PAGE buffer (10% SDS, 0.02% bromophenol blue, 1.5 M Tris-Hcl, pH 8.8, 40% glycerin), followed by placing in a boiling water bath for 3–5 min. After centrifugation (12,000 r.p.m., 10 min.), samples were electrophoresed with 12% gel and mini-cell apparatus at 15 mA for 3 hrs and stained with Coomassi brilliant blue G-250 for 24 hrs. A GS-800 calibrated densitometer was used to scan the gel.
Protein extraction and western blot analysis
Total cellular protein was collected from cultured cells in a lysis buffer containing the following: 10 mM Tris-HCl, 0.5% NP40, 150 mM NaCl, 0.5% sodium deoxycholate, 0.1% SDS, 0.2 mM PMSF in ethanol, 1 μg/ml aprotinin, 4 μg/ml pepstatin, 10 μg/ml leupeptin and 1 mM sodium orthovanadate (10 μl/ml). Protein concentration was measured using a commercial system (Dc Protein Assay System; Bio-Rad Laboratories, Richmond, CA, USA). Cellular lysate was separated on denaturing polyacrylamide gels and then transferred by electrophoresis to nitrocellulose membranes. The blots were incubated in 5% non-fat dry milk in PBS containing 0.1% Tween-20 (PBS-T) for 1 hr at room temperature, incubated overnight at 4°C with primary antibodies (anti-HSP 27, 1:1000 dilution). Then, the blots were rinsed three times with PBS-T, and detected with horseradish peroxidase-conjugated secondary goat IgG antimouse antibody (Bio-Rad). β-actin served as an internal control.
Results
Exome sequencing and quality control
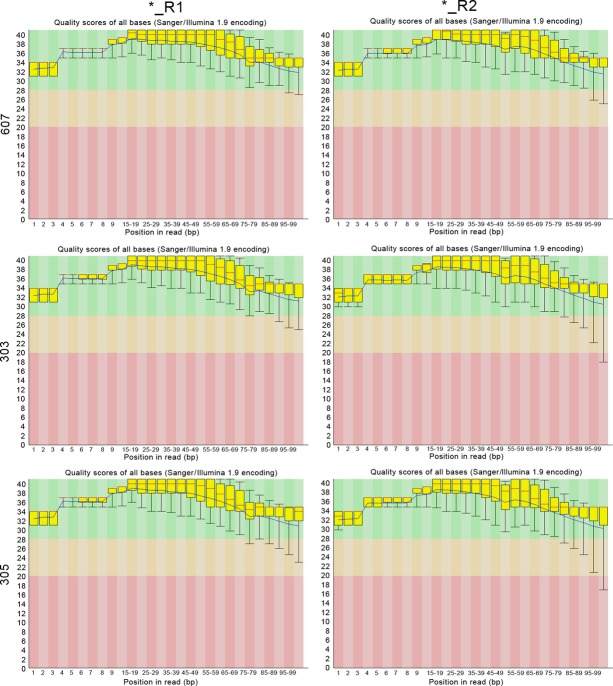
The three samples were exome sequenced with paired-end mapping and then the sequencing results were performed quality control with fast QC software. Figure 2 shows the quality scores across all bases before and after quality control. We could find that the sequence quality was increased after quality control, with the lowest value larger than 20 at 3′ end. The high quality of sequence would guarantee the reliability of further analysis.
Figure 2.
The result of quality control. The central red line is the median value; the yellow box represents the inter-quartile range (25–75%); the upper and lower whiskers represent the 10% and 90% points; the blue line represents the mean quality; the y-axis on the graph shows the quality scores. The higher the score, the better the base call. The background of the graph divides the y-axis into very good quality calls (green), calls of reasonable quality (orange) and calls of poor quality (red).
Variant calling and annotating
After exome sequencing, alignment and a series of quality control steps, we isolated tens of thousands of SNPs and thousands of INDELs from the three samples (Table 2, upper part). Then, Annovar was used for annotating these variants identified from the sequence data (Table 2, lower part). We could find that the variants distributed widely on gene, such as exonic, UTR 3, UTR5.
Table 2.
The number of SNPs or INDELs in three samples (upper part) and the annotating information for the variants (lower part)
| 607 | 303 | 305 | |
|---|---|---|---|
| SNP | 24894 | 18643 | 13649 |
| INDEL | 3968 | 2137 | 1207 |
| Mutation position | |||
| Downstream | 1284 | 827 | 536 |
| Exonic | 5128 | 4385 | 3548 |
| Exonic; splicing | 51 | 33 | 35 |
| Intergenic | 5385 | 4261 | 3188 |
| Intronic | 6246 | 3671 | 2622 |
| ncRNA_ exonic | 2273 | 2398 | 1903 |
| ncRNA_ splicing | 24 | 19 | 13 |
| ncRNA_UTR3 | 2 | 1 | 1 |
| ncRNA_UTR5 | 5 | 4 | 4 |
| Splicing | 41 | 24 | 12 |
| Upstream | 470 | 440 | 354 |
| Upstream; downstream | 51 | 32 | 25 |
| UTR3 | 7415 | 4168 | 2329 |
| UTR5 | 389 | 370 | 345 |
| UTR5; UTR3 | 14 | 11 | 9 |
Screening of glaucoma-related SNPs and INDELs combined with text mining
A total of 1368 genes, which were related with glaucoma, were mining from NCBI PUBMED. Then, we obtained the intersection of the 1368 genes from text mining and the SNPs and INDELs screened above. As a result, we obtained 20, 13, 8 overlapping mutations on the exonic position in sample 607, 303 and 305 respectively. We further focused on the exonic mutations in sample 607, because sample 607 is a POAG sufferer. As shown in Table 3, seven genes developed non-synonymous mutations on the exonic position in sample 607, including ENSG00000073910 (FRY), ENSG00000115760 BIRC6, ENSG00000116824 (CD2), ENSG00000138039 LHCGR, ENSG00000170927 PKHD1, ENSG00000171759 PAH and ENSG00000180549 FUT7. In addition to FRY, the remaining six genes specifically existed in sample 607.
Table 3.
The non-synonymous mutation on the exonic position in the three samples
| Mutation | 607 | 303 | 305 |
|---|---|---|---|
| All | 20 | 13 | 9 |
| Non-synonymous mutation | ENSG00000073910 (FRY) | ENSG00000073910 | ENSG00000073910 |
| ENSG00000115760 (BIRC6) | ENSG00000079385 | ENSG00000116984 | |
| ENSG00000116824 (CD2) | ENSG00000087470 | ENSG00000146143 | |
| ENSG00000138039 (LHCGR) | ENSG00000135046 | ||
| ENSG00000170927 (PKHD1) | ENSG00000144810 | ||
| ENSG00000171759 (PAH) | ENSG00000146143 | ||
| ENSG00000180549 (FUT7) | ENSG00000171195 | ||
| ENSG00000185022 | |||
| ENSG00000204472 |
PPI network construction
To investigate the mutated genes in a systemic way, we mapped the six mutated genes to HPRD and BioGRID databases and constructed PPI networks using Cytoscape (Fig. 3). From Figure 3, proteins of six mutated genes have interactions with other proteins, in which CD2 has the most interactions.
Figure 3.
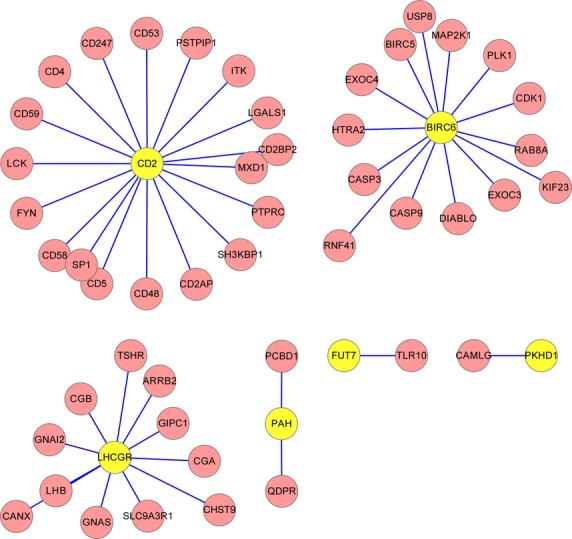
The protein–protein interaction (PPI) network in which the proteins of the mutated gene and its neighbour proteins are involved. The yellow nodes are the proteins of mutated genes and the pink nodes are their interactive proteins.
Identification of DEGs based on DNA microarray
Public microarray data set of GSE2378 was downloaded from GEO database, and the DEGs between glaucoma patients and normal controls were identified by LIMMA package. At FDR <0.05 and fold change >1.5 or <−1.5, a total of 197 DEGs were identified.
Functional enrichment analysis and comparison
The database for annotation, visualization and integrated discovery was used to annotate the biological functions of the genes from PPI networks and the DEGs from the microarray data respectively. At a P value of 0.1, the genes from PPI networks were enriched in 280 GO categories and 12 KEGG pathways, and the DEGs from the microarray data were enriched in 201 GO categories and 14 KEGG pathways.
To verify our results, we performed comparisons of the enriched GO categories and pathways. Both a total of 38 GO categories and 1 KEGG pathway were enriched in the two sets of data (Table 4).
Table 4.
The overlapping GO categories and pathway enriched from our data and microarray data from GEO (only list the top 10 GO categories)
| Term | Description | P | Genes |
|---|---|---|---|
| GO:0010033 | Response to organic substance | 1.09E-06 | CGA, SELP, HNF1B, LHCGR, TAT, KCNJ11, GHRHR, GCH1, CD48, GOT2, TNFRSF1A, CASP3, GOT1, GATA3, GNAS, CD24, SELE |
| GO:0043085 | Positive regulation of catalytic activity | 3.59E-06 | PTPRC, PKHD1, LHCGR, GHRHR, GCH1, CASP9, GHRH, LCK, GIPR, DIABLO, GNAS, CD24, TSHR, SELE |
| GO:0044093 | Positive regulation of molecular function | 1.30E-05 | PTPRC, PKHD1, LHCGR, GHRHR, GCH1, CASP9, GHRH, LCK, GIPR, DIABLO, GNAS, CD24, TSHR, SELE |
| GO:0007159 | Leucocyte adhesion | 1.45E-05 | SELP, PTPRC, CD24, SELE, SELPLG |
| GO:0016337 | Cell–cell adhesion | 1.67E-05 | SELP, PTPRC, PKHD1, CD58, CD2, PKD1, CD24, CD2AP, SELE, SELPLG |
| GO:0042981 | Regulation of apoptosis | 3.27E-04 | PTPRC, IL2RA, BIRC6, IGF1, GCH1, CASP3, HTRA2, CASP9, LCK, CD2, DIABLO, CD24, CD5, CACNA1A |
| GO:0043067 | Regulation of programmed cell death | 3.59E-04 | PTPRC, IL2RA, BIRC6, IGF1, GCH1, CASP3, HTRA2, CASP9, LCK, CD2, DIABLO, CD24, CD5, CACNA1A |
| GO:0010941 | Regulation of cell death | 3.72E-04 | PTPRC, IL2RA, BIRC6, IGF1, GCH1, CASP3, HTRA2, CASP9, LCK, CD2, DIABLO, CD24, CD5, CACNA1A |
| GO:0046649 | Lymphocyte activation | 7.05E-04 | CD48, ZBTB32, PTPRC, LCK, CD2, CD24, TSHR |
| GO:0009967 | Positive regulation of signal transduction | 0.00104 | TNFRSF1A, PTPRC, GHRH, LCK, LHCGR, IGF1, CD24, GHRHR |
| hsa04514 | Cell adhesion molecules (CAMs) | 0.005266 | SELP, PTPRC, CD58, CD2, SELE, SELPLG |
Sequence alignment of CD2 gene
From the above analysis, we hypothesized that CD2 might be a susceptible gene for POAG. Therefore, we performed sequence alignment of CD2 gene using DNAman (Fig. 4). A missense mutation at position 596 was observed, resulting in a glutamine being substituted for a tryptophan, and a same sense mutation at position 666 was observed.
Figure 4.
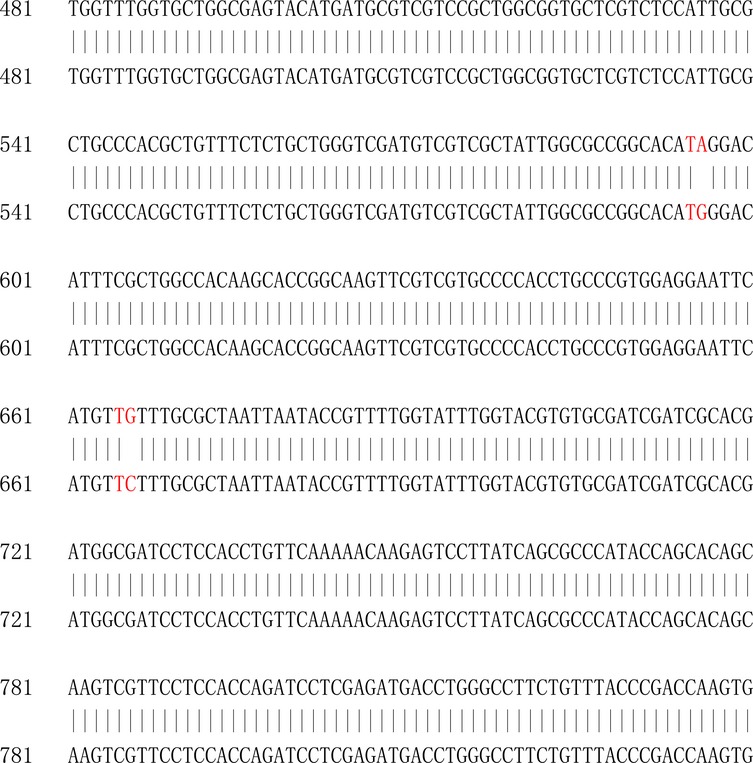
Sequence alignment of CD2 gene. The A at position 596 was replaced by G and the G at position 666 was replaced by C.
SDS-PAGE analysis
The recombinant plasmids pCD2-1 (normal cells) and pCD2-2(POAG cells) were transformed into Escherichia coli. After induced expression by IPTG, SDS-PAGE was performed with the samples transfected CD2 gene. The non-transfected samples served as control. From Figure 5, lane 2 and lane 3 have specific protein bands at 45 kD, whereas lane 1 has no protein band at 45 kD. The molecular weight of this protein is agreed with predicted result (42 kD). This result suggests that the CD2 was induced to express in E. coli.
Figure 5.
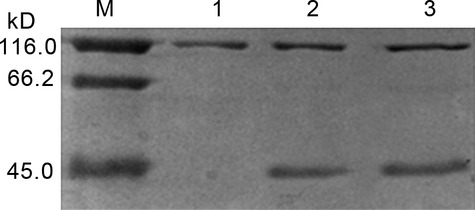
SDS-PAGE of proteins from non-transfected samples and transfected samples. The lane 1 represents the non-transfected samples (control), the lane 2 represents the normal cells transfected CD2 gene (pCD2-1) and the lane 3 represents the primary open angle glaucoma (POAG) cells transfected CD2 gene (pCD2-2).
Semiquantitative RT- PCR
HSP27 was used as a marker to detect the role of CD2 in POAG cells and normal cells. From Figure 6A, we could find that the expression levels of HSP 27 in POAG cells were higher than those in normal cells at 24, 48 and 72 hrs respectively. Optical density analysis of electrophoretic bands showed that the expression level of HSP 27 in POAG cells increased by 68%, 46.1% and 70.6% compared with those in normal cells (Fig. 6B).
Figure 6.
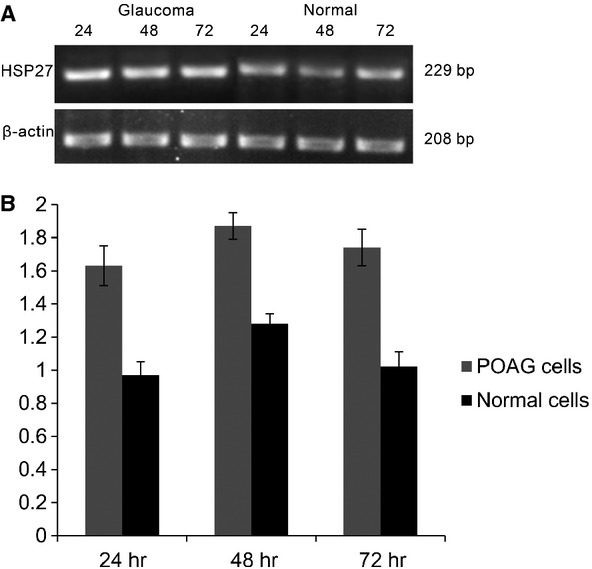
The mRNA expression of HSP27 in primary open angle glaucoma (POAG) cells and normal cells. (A) RT-PCR was used to measure expression levels of HSP27 at 24, 48 and 72 hrs after pCD2 transfection using total RNA from POAG cells and normal cells. (B) The relative expression level of HSP27. Expression values were normalized to β-actin.
Western blot
To further verify our result at protein level, we performed western blot analysis using protein from POAG cells and normal cells respectively. From Figure 7A, the protein expression levels of HSP27 in POAG cells were higher than those in normal cells at 24, 48 and 72 hrs after pCD2 transfection. Optical density analysis showed that the expression levels of HSP27 in POAG cells were increased by 187%, 169% and 173% compared with those in normal cells (Fig. 7B).
Figure 7.
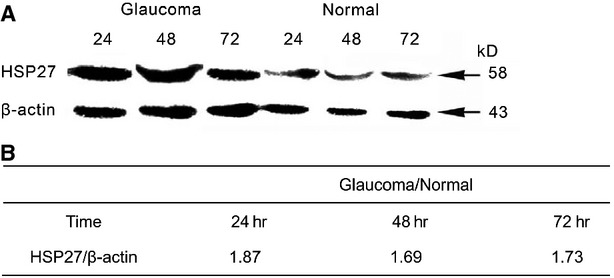
The protein expression of HSP27 in primary open angle glaucoma (POAG) cells and normal cells. (A) Western blot was used to measure expression levels of HSP27 at 24, 48 and 72 hrs after pCD2 transfection using proteins from primary open angle glaucoma (POAG) cells and normal cells. (B) The relative expression level.
Discussion
In this study, we conducted exome sequencing on three members from a high-frequency POAG family in Chinese Han population. Tens of thousands of SNPs and INDELs were isolated. By combining with the text-mining results, six genes developing non-synonymous mutations on the exonic position in sample 607 were identified, including BIRC6,CD2,LHCGR,PKHD1,PAH and FUT7. Some of these genes have been suggested to be related with POAG by previous studies 39, and some of them have not been reported. Furthermore, we selected CD2 to perform further analysis. Sequence alignment analysis showed a missense mutation at position 596 and a same sense mutation at position 666. RT-PCR and Western blot results suggest that expression levels of HSP 27 in POAG cells were higher than those in normal cells at 24, 48 and 72 hrs after pCD2 transfection at both mRNA level and protein level.
In this study, mutation in BIRC6 is non-synonymous and specifically existed in sample 607, suggesting that it plays an important role in POAG. Baculoviral IAP repeat containing 6 is an ubiquitin-carrier protein, which inhibits apoptosis by facilitating the degradation of apoptotic proteins by ubiquitination 40. Our result is in accordance with a previous study, which identified two genes of the unfolded protein response that harbour POAG risk alleles, BIRC6 and PDIA5 in Salt Lake City and San Diego populations 39. From the PPI network constructed by BIRC6 (Fig. 3), we could find that BIRC6 was interacted with two downstream cell death proteases, CASP (Caspase)3 and CASP9. Similarly, another member in IAP family, BIRC4, is reported to be a direct inhibitor of caspase-3 and -8 in a rat model of glaucoma 41. We speculate that apoptotic cell death mediated by BIRC6 might impair the ability of the anterior chamber to regulate IOP and lead to POAG resulting from ocular hypertension.
Luteinizing hormone/choriogonadotropin receptor belongs to the G-protein–coupled receptor 1 family. So far, no studies have reported LHCGR mutation in POAG. However, this gene is localized to the short arm of chromosome 2 (2p.21), which is designated GLC3A. Interestingly, several loci in this region have been identified to be related with POAG in several ethnic groups. For example, Melki et al. suggested that CYP1B1 (cytochrome P450, family 1, subfamily B, polypeptide 1) mutations in GLC3A might pose a significant risk for early-onset POAG in French patients and might also modify glaucoma phenotype in patients who do not carry a MYOC mutation 42. Therefore, we speculated that LHCGR might also pose a risk for POAG in Chinese population; however, further studies are still needed to confirm our speculation.
Mutations in other genes, such as CD2,PKHD1,PAH and FUT7, have not been reported to be related with risk for POAG so far. Therefore, we selected CD2 to perform experimentally verification, because of its higher degree in PPI network (Fig. 3) and frequently enrichment in the overlapping GO categories (Table 4).
In this study, we detected the expression levels of HSP27 in RT-PCR and Western blot. HSP27 is involved in stress resistance and actin organization and translocates from the cytoplasm to the nucleus upon stress induction. It has been shown to play a role in sensory neuron survival following peripheral nerve axotomy 43. Krueger-Naug et al. demonstrated that HSP27 is detected in retinal ganglion cells, while not present at detectable levels in the control rats by immunohistochemical methods 44. Li et al. showed that HSP 27 is up-regulated in retinas from ocular hypertensive rats and suggested that up-regulation of HSP27 is a gene-specific event associated with elevated IOP 45. On the basis of these studies, we chose HSP27 as a marker to monitor the role of CD2 in POAG cells. As expected, both the mRNA expression levels and protein expression levels of HSP27 were increased in POAG cells compared with those in normal cells, suggesting that mutation in CD2 might pose a risk for POAG in Chinese population.
In conclusion, this study employed exome sequencing to identify the risk factors of POAG in Chinese population. Six genes, BIRC6,CD2,LHCGR,PKHD1,PAH and FUT7, were selected by combining with text-mining and microarray analysis. Furthermore, role of mutation in CD2 for POAG was confirmed by RT-PCR and Western blot. This study provides a candidate gene list that is likely to include real POAG risk factors. However, limitation of our study includes the small sample size. Further studies based on larger sample size are needed to confirm our results.
Acknowledgments
This study was supported by the National Natural Science Foundation of China (NSFC, 30901657). We wish to express our warm thanks to Fenghe (Shanghai) Information Technology Co., Ltd. Their ideas and help gave a valuable added dimension to our research.
Conflicts of interest
The authors confirm that there are no conflicts of interest.
References
- 1.Zhuo YH, Wei YT, Bai YJ, et al. Pro370Leu MYOC gene mutation in a large Chinese family with juvenile-onset open angle glaucoma: correlation between genotype and phenotype. Mol Vis. 2008;14:1533–9. [PMC free article] [PubMed] [Google Scholar]
- 2.Chihara E, Liu X, Dong J, et al. Severe myopia as a risk factor for progressive visual field loss in primary open-angle glaucoma. Ophthalmologica. 1997;211:66–71. doi: 10.1159/000310760. [DOI] [PubMed] [Google Scholar]
- 3.Teus MA, Castejon MA, Calvo MA, et al. Intraocular pressure as a risk factor for visual field loss in pseudoexfoliative and in primary open-angle glaucoma. Ophthalmology. 1998;105:2225–9. doi: 10.1016/S0161-6420(98)91220-9. [DOI] [PubMed] [Google Scholar]
- 4.Kong X, Chen Y, Chen X, et al. Influence of family history as a risk factor on primary angle closure and primary open angle glaucoma in a Chinese population. Ophthalmic Epidemiol. 2011;18:226–32. doi: 10.3109/09286586.2011.595040. [DOI] [PubMed] [Google Scholar]
- 5.Bonovas S, Peponis V, Filioussi K. Diabetes mellitus as a risk factor for primary open-angle glaucoma: a meta-analysis. Diabet Med. 2004;21:609–14. doi: 10.1111/j.1464-5491.2004.01173.x. [DOI] [PubMed] [Google Scholar]
- 6.Kountouras J, Zavos C, Grigoriadis N, et al. Helicobacter pylori infection as a risk factor for primary open-angle glaucoma. Clin Experiment Ophthalmol. 2008;36:196. doi: 10.1111/j.1442-9071.2008.01705.x. [DOI] [PubMed] [Google Scholar]
- 7.Tielsch JM, Katz J, Sommer A, et al. Family history and risk of primary open angle glaucoma. The Baltimore Eye Survey. Arch Ophthalmol. 1994;112:69–73. doi: 10.1001/archopht.1994.01090130079022. [DOI] [PubMed] [Google Scholar]
- 8.Budde WM, Jonas JB. Family history of glaucoma in the primary and secondary open-angle glaucomas. Graefes Arch Clin Exp Ophthalmol. 1999;237:554–7. doi: 10.1007/s004170050278. [DOI] [PubMed] [Google Scholar]
- 9.Sheffield VC, Stone EM, Alward WL, et al. Genetic linkage of familial open angle glaucoma to chromosome 1q21-q31. Nat Genet. 1993;4:47–50. doi: 10.1038/ng0593-47. [DOI] [PubMed] [Google Scholar]
- 10.Wirtz MK, Samples JR, Kramer PL, et al. Mapping a gene for adult-onset primary open-angle glaucoma to chromosome 3q. Am J Hum Genet. 1997;60:296–304. [PMC free article] [PubMed] [Google Scholar]
- 11.Trifan OC, Traboulsi EI, Stoilova D, et al. A third locus (GLC1D) for adult-onset primary open-angle glaucoma maps to the 8q23 region. Am J Ophthalmol. 1998;126:17–28. doi: 10.1016/s0002-9394(98)00073-7. [DOI] [PubMed] [Google Scholar]
- 12.Sarfarazi M, Child A, Stoilova D, et al. Localization of the fourth locus (GLC1E) for adult-onset primary open-angle glaucoma to the 10p15-p14 region. Am J Hum Genet. 1998;62:641–52. doi: 10.1086/301767. [DOI] [PMC free article] [PubMed] [Google Scholar]
- 13.Wiggs JL. Genetic etiologies of glaucoma. Arch Ophthalmol. 2007;125:30–7. doi: 10.1001/archopht.125.1.30. [DOI] [PubMed] [Google Scholar]
- 14.Wang DY, Fan BJ, Chua JK, et al. A genome-wide scan maps a novel juvenile-onset primary open-angle glaucoma locus to 15q. Invest Ophthalmol Vis Sci. 2006;47:5315–21. doi: 10.1167/iovs.06-0179. [DOI] [PubMed] [Google Scholar]
- 15.Nemesure B, Jiao X, He Q, et al. A genome-wide scan for primary open-angle glaucoma (POAG): the Barbados Family Study of Open-Angle Glaucoma. Hum Genet. 2003;112:600–9. doi: 10.1007/s00439-003-0910-z. [DOI] [PubMed] [Google Scholar]
- 16.Shimizu S, Lichter PR, Johnson AT, et al. Age-dependent prevalence of mutations at the GLC1A locus in primary open-angle glaucoma. Am J Ophthalmol. 2000;130:165–77. doi: 10.1016/s0002-9394(00)00536-5. [DOI] [PubMed] [Google Scholar]
- 17.Fingert JH, Heon E, Liebmann JM, et al. Analysis of myocilin mutations in 1703 glaucoma patients from five different populations. Hum Mol Genet. 1999;8:899–905. doi: 10.1093/hmg/8.5.899. [DOI] [PubMed] [Google Scholar]
- 18.Rezaie T, Child A, Hitchings R, et al. Adult-onset primary open-angle glaucoma caused by mutations in optineurin. Science. 2002;295:1077–9. doi: 10.1126/science.1066901. [DOI] [PubMed] [Google Scholar]
- 19.Ng SB, Buckingham KJ, Lee C, et al. Exome sequencing identifies the cause of a mendelian disorder. Nat Genet. 2010;42:30–5. doi: 10.1038/ng.499. [DOI] [PMC free article] [PubMed] [Google Scholar]
- 20.Sundaram SK, Huq AM, Sun Z, et al. Exome sequencing of a pedigree with Tourette syndrome or chronic tic disorder. Ann Neurol. 2011;69:901–4. doi: 10.1002/ana.22398. [DOI] [PubMed] [Google Scholar]
- 21.Teer JK, Mullikin JC. Exome sequencing: the sweet spot before whole genomes. Hum Mol Genet. 2010;19:R145–51. doi: 10.1093/hmg/ddq333. [DOI] [PMC free article] [PubMed] [Google Scholar]
- 22.Korbel JO, Urban AE, Affourtit JP, et al. Paired-end mapping reveals extensive structural variation in the human genome. Science. 2007;318:420–6. doi: 10.1126/science.1149504. [DOI] [PMC free article] [PubMed] [Google Scholar]
- 23.Li H, Durbin R. Fast and accurate short read alignment with Burrows-Wheeler transform. Bioinformatics. 2009;25:1754–60. doi: 10.1093/bioinformatics/btp324. [DOI] [PMC free article] [PubMed] [Google Scholar]
- 24.Wang K, Li M, Hakonarson H. ANNOVAR: functional annotation of genetic variants from high-throughput sequencing data. Nucleic Acids Res. 2010;38:e164. doi: 10.1093/nar/gkq603. [DOI] [PMC free article] [PubMed] [Google Scholar]
- 25.Li H, Liu C. Biomarker identification using text mining. Comput Math Methods Med. 2012;2012:135780. doi: 10.1155/2012/135780. [DOI] [PMC free article] [PubMed] [Google Scholar]
- 26.Bilisoly R. Practical text mining with perl. Somerset, NJ: Wiley publishing; 2008. [Google Scholar]
- 27.Keshava Prasad TS, Goel R, Kandasamy K, et al. Human protein reference database–2009 update. Nucleic Acids Res. 2009;37:D767–72. doi: 10.1093/nar/gkn892. [DOI] [PMC free article] [PubMed] [Google Scholar]
- 28.Stark C, Breitkreutz BJ, Reguly T, et al. BioGRID: a general repository for interaction datasets. Nucleic Acids Res. 2006;34:D535–9. doi: 10.1093/nar/gkj109. [DOI] [PMC free article] [PubMed] [Google Scholar]
- 29.Smoot ME, Ono K, Ruscheinski J, et al. Cytoscape 2.8: new features for data integration and network visualization. Bioinformatics. 2011;27:431–2. doi: 10.1093/bioinformatics/btq675. [DOI] [PMC free article] [PubMed] [Google Scholar]
- 30.Hernandez MR, Agapova OA, Yang P, et al. Differential gene expression in astrocytes from human normal and glaucomatous optic nerve head analyzed by cDNA microarray. Glia. 2002;38:45–64. doi: 10.1002/glia.10051. [DOI] [PubMed] [Google Scholar]
- 31.Troyanskaya O, Cantor M, Sherlock G, et al. Missing value estimation methods for DNA microarrays. Bioinformatics. 2001;17:520–5. doi: 10.1093/bioinformatics/17.6.520. [DOI] [PubMed] [Google Scholar]
- 32.Irizarry RA, Hobbs B, Collin F, et al. Exploration, normalization, and summaries of high density oligonucleotide array probe level data. Biostatistics. 2003;4:249–64. doi: 10.1093/biostatistics/4.2.249. [DOI] [PubMed] [Google Scholar]
- 33.Diboun I, Wernisch L, Orengo CA, et al. Microarray analysis after RNA amplification can detect pronounced differences in gene expression using limma. BMC Genomics. 2006;7:252. doi: 10.1186/1471-2164-7-252. [DOI] [PMC free article] [PubMed] [Google Scholar]
- 34.Team RDC. R: a language and environment for statistical computing. Albacete, Spain: R Foundation for Statistical Computing; 2011. [Google Scholar]
- 35.Benjamini Y, Hochberg Y. Controlling the false discovery rate: a practical and powerful approach to multiple testing. J Royal Stat Soc Ser B (Methodological) 1995;57:289–300. [Google Scholar]
- 36.da Huang W, Sherman BT, Lempicki RA. Systematic and integrative analysis of large gene lists using DAVID bioinformatics resources. Nat Protoc. 2009;4:44–57. doi: 10.1038/nprot.2008.211. [DOI] [PubMed] [Google Scholar]
- 37.Yang P, Hernandez MR. Purification of astrocytes from adult human optic nerve heads by immunopanning. Brain Res Brain Res Protoc. 2003;12:67–76. doi: 10.1016/s1385-299x(03)00073-4. [DOI] [PubMed] [Google Scholar]
- 38.Yan Y, Hsam SLK, Yu JZ, et al. Allelic variation of the HMW glutenin subunits in Aegilops tauschii accessions detected by sodium dodecyl sulphate (SDS-PAGE), acid polyacrylamide gel (A-PAGE) and capillary electrophoresis. Euphytica. 2003;130:377–85. [Google Scholar]
- 39.Carbone MA, Chen Y, Hughes GA, et al. Genes of the unfolded protein response pathway harbor risk alleles for primary open angle glaucoma. PLoS ONE. 2011;6:e20649. doi: 10.1371/journal.pone.0020649. [DOI] [PMC free article] [PubMed] [Google Scholar]
- 40.Liu CH, Goldberg AL, Qiu XB. New insights into the role of the ubiquitin-proteasome pathway in the regulation of apoptosis. Chang Gung Med J. 2007;30:469–79. [PubMed] [Google Scholar]
- 41.McKinnon SJ, Lehman DM, Tahzib NG, et al. Baculoviral IAP repeat-containing-4 protects optic nerve axons in a rat glaucoma model. Mol Ther. 2002;5:780–7. doi: 10.1006/mthe.2002.0608. [DOI] [PubMed] [Google Scholar]
- 42.Melki R, Colomb E, Lefort N, et al. CYP1B1 mutations in French patients with early-onset primary open-angle glaucoma. J Med Genet. 2004;41:647–51. doi: 10.1136/jmg.2004.020024. [DOI] [PMC free article] [PubMed] [Google Scholar]
- 43.Lewis SE, Mannion RJ, White FA, et al. A role for HSP27 in sensory neuron survival. J Neurosci. 1999;19:8945–53. doi: 10.1523/JNEUROSCI.19-20-08945.1999. [DOI] [PMC free article] [PubMed] [Google Scholar]
- 44.Krueger-Naug A, Emsley J, Myers T, et al. Injury to retinal ganglion cells induces expression of the small heat shock protein Hsp27 in the rat visual system. Neuroscience. 2002;110:653–66. doi: 10.1016/s0306-4522(01)00453-5. [DOI] [PubMed] [Google Scholar]
- 45.Li Y, Yuan YS, Zeng Y, et al. Expression of heat shock protein 27 induced in the experimental rat glaucoma model. Ophthalmol CHN. 2007;16:119–22. [Google Scholar]


