

Abstract
Amnestic mild cognitive impairment (aMCI) is considered to be one of the early stages in the progression from no cognitive impairment (NCI) to Alzheimer’s disease (AD). Individuals with aMCI have increased levels of AD-type neuropathology in multiple regions of the neocortex and hippocampus and demonstrate a loss of synaptic connectivity. Recent neuroimaging studies have reported increased levels of 11C-PiB (Pittsburgh, compound B) in regions of the neocortex including the precuneus region of the medial parietal lobe. This cortical region has been implicated in episodic memory, which is disrupted early in the progression of AD. In this study, unbiased stereology coupled with electron microscopy was used to quantify total synaptic numbers in lamina 3 of the precuneus from short postmortem autopsy tissue harvested from subjects who died at different cognitive stages during the progression of AD. Individuals with aMCI did not reveal a statistically significant decline in total synapses compared to the NCI cohort while the AD group did show a modest but significant decline. Synaptic numbers failed to correlate with several different cognitive tasks including the Mini Mental State Examination scores and episodic memory scores. Although levels of [3H]PiB binding were elevated in both the aMCI and AD groups, it did not strongly correlate with synaptic counts. These results support the idea that despite increased amyloid load, the precuneus region does not show early changes in synaptic decline during the progression of AD.
Keywords: Alzheimer’s disease, early onset, synaptic plasticity, episodic memory, synapses
INTRODUCTION
Alzheimer’s disease (AD) is a progressive neurodegenerative disorder that results in a loss of significant intellectual function in affected individuals. Currently it is estimated that over 35 million people are afflicted with this disease worldwide and is considered to be the most common form of dementia in the elderly. The neuropathologic profile of individuals with AD includes increased levels of both diffuse plaques (DP) and neuritic amyloid plaques (NP) throughout neocortical association areas as well as an abundance of neurofibrillary tangles (NFT) primarily in the mesial temporal cortex [1, 2]. Coupled with these pathological hallmarks are increased brain atrophy, amyloid angiopathy, neuron loss, and synaptic dysfunction [3, 4].
Synaptic loss occurs early in AD suggesting that it may be one of the key events in the progression of the disease leading to cognitive impairment. Recent studies have shown a loss of synapses and synaptic proteins in the hippocampus and neocortex in individuals with amnestic mild cognitive impairment (aMCI) [5–8]. The concept of aMCI which was first proposed by Flicker and colleagues [9] and later codified by Petersen [10] describes individuals who demonstrate a gradual cognitive decline with an increased likelihood of conversion to dementia. Several studies support the idea that the possible underlying substrates for aMCI are the accumulation of NFTs [11–13] and increased accumulation of NPs [14].
In an effort to detect individuals early in the progression of AD, clinicians have used both structural and functional imaging studies coupled with biochemical analysis of cerebral spinal fluid (CSF) for changes in the ratio of Aβ1-42 and phosphorylated tau (p-tau) [15, 16]. Positron emission tomography (PET) using the amyloid-binding compounds, 11C-PiB (Pittsburgh, compound B) has been used to identify specific regions of the cortex that may be among the earliest areas affected by AD [17, 18]. The precuneus cortex (PreC), located in the posterior region of the medial parietal area, harbors a significantly heavy amyloid plaque burden in the AD brain. Recent PiB binding studies in living patients has revealed that this brain region is particularly vulnerable to amyloid deposition in the earliest stages of the disease [19–21]. Multiple studies have implicated Aβ as a key modulator of synaptic function, which underlies synaptic loss in AD [22–26], however, it is unknown whether region-specific changes in synapses occur in parallel with increased amyloid load. The present study was designed to examine whether or not the PreC region of the neocortex shows synaptic loss in individuals with aMCI compared to individuals with no cognitive impairment and persons with AD.
MATERIALS AND METHODS
Postmortem human brains
Tissue was examined from 27 individuals (mean age 88.6 ± 5.9 years; range 73 to 99 years; Table 1) who were participants in either the Rush Religious Orders Study (RROS), a longitudinal clinical-pathologic studies of aging and Alzheimer’s disease composed of older Catholic nuns, priests, and brothers [27–29], or the University of Kentucky Alzheimer’s Disease Center (UKADC) [30]. The Human Investigations Committee of Rush University Medical Center and the University of Kentucky College of Medicine approved the studies. Individuals included in these studies agreed to annual clinical evaluation and brain donation at the time of death. For all subjects, cognitive test scores were available within the last year of life; the average interval from last evaluation to time of death was 7.0 ±3.6 months, with no differences among the three diagnostic groups (p < 0.1). Subjects were categorized as no cognitive impairment (NCI; n = 10), aMCI (n = 9), based on cognitive testing prior to death, or AD (n = 8) based upon cognitive testing and postmortem neuropathological examination [31–33]. The NCI subjects were without a history of dementia or other neurological disorders. Standard criteria for exclusion included the presence of 1) significant cerebral stroke regardless of ante mortem date, 2) large cortical infarcts identified in the postmortem neuropathologic evaluation, 3) significant head trauma within 12 months before autopsy, 4) individuals on a respirator longer than 12 hours before death, 5) individuals in coma longer than 12 hours immediately before death, 6) individuals currently undergoing radiation therapy for CNS tumor, and 7) individuals with Lewy bodies in the area of interest or Parkinson’s disease.
Table 1.
Characteristics of NCI, aMCI, AD subjects
| Subjects | Age (y) | Gender | Brain wt (g) | Education (y) | MMSE | CERAD | Braak | PMI (h) |
|---|---|---|---|---|---|---|---|---|
| NCI | 97 | F | 1220 | 12 | 30 | Definite | 5 | 2.3 |
| NCI | 92 | F | 1010 | 13 | 29 | None | 2 | 3.0 |
| NCI | 84 | F | 1210 | 17 | 28 | None | 0 | 2.5 |
| NCI | 85 | F | 1177 | 16 | 26 | Possible | 3 | 6.0 |
| NCI | 86 | F | 1200 | 18 | 28 | None | 0 | 2.5 |
| NCI | 88 | F | 1100 | 16 | 30 | None | 1 | 2.5 |
| NCI | 93 | M | 1220 | 20 | 28 | Probable | 0 | 3.5 |
| NCI | 84 | F | 940 | 12 | 30 | Possible | 3 | 7.0 |
| NCI | 84 | F | 1230 | 16 | 30 | None | 0 | 2.0 |
| NCI | 88 | F | 1070 | 16 | 29 | None | 3 | 3.0 |
| Mean ± SD | 88.1 ± 4.5 | 1137 ± 102 | 15.6 ± 2.6 | 28.8 ± 1.3 | 3.4 ± 1.7 | |||
| aMCI | 83 | F | 990 | 10 | 30 | None | 2 | 11.0 |
| aMCI | 87 | F | 1130 | 16 | 28 | Definite | 3 | 3.0 |
| aMCI | 83 | F | 1100 | 16 | 30 | None | 2 | 7.0 |
| aMCI | 94 | M | 1350 | 18 | 24 | Probable | 4 | 3.0 |
| aMCI | 89 | M | 1330 | 20 | 26 | Definite | 1 | 3.0 |
| aMCI | 96 | F | 970 | 18 | 27 | None | 4 | 2.5 |
| aMCI | 85 | F | 1170 | 16 | 23 | Probable | 1 | 2.0 |
| aMCI | 90 | F | 1010 | 18 | 30 | None | 5 | 6.3 |
| aMCI | 93 | F | 1050 | 14 | 28 | Possible | 2 | 3.0 |
| Mean ± SD | 89.0 ± 4.8 | 1122 ± 140 | 16.2 ± 2.9 | 27.3 ± 2.6 | 4.5 ± 2.9 | |||
| AD | 98 | F | 900 | 18 | 3 | Probable | 5 | 3.5 |
| AD | 92 | F | 1109 | 16 | 9 | Probable | 3 | 5.0 |
| AD | 98 | F | 1250 | 16 | 9 | Possible | 3 | 6.0 |
| AD | 80 | F | 1130 | 12 | 21 | Definite | 6 | 4.0 |
| AD | 91 | M | 1210 | 13 | 21 | Probable | 4 | 2.0 |
| AD | 92 | M | 1100 | 16 | 14 | Possible | 3 | 6.8 |
| AD | 86 | M | 1150 | 16 | 11 | Definite | 6 | 3.0 |
| AD | 73 | M | 1130 | 16 | 23 | Definite | 6 | 2.0 |
| Mean ± SD | 88.8 ± 8.7 | 1112 ± 103 | 15.4 ± 1.9 | 15.9 ± 6.4* | 4.0 ± 1.8 |
NCI (no cognitive impairment); aMCI (amnestic mild cognitive impairment); AD (Alzheimer’s disease); M (Male); F (Female); MMSE (Mini Mental State Examination); CERAD (Consortium to Establish a Registry for Alzheimer’s Disease); PMI (Post mortem interval); DX (Final clinical diagnosis); SD (standard deviation)
p < 0.0001
Clinical Evaluations
Details of the RROS and UKADC have been published elsewhere [27, 33, 34]. All subjects have detailed mental status testing annually, and have neurologic and physical examinations annually. Subjects were followed for 3 to 17 years (median 7.5 years). The 9 aMCI and 8 AD subjects were initially normal on enrollment into each longitudinal study and later transition to each clinical category during follow-up evaluation. All MCI subjects were amnestic without multi domain involvement. Tissue from questionable cases was not included in the study.
Pathologic Evaluation and Electron Microscopy
At autopsy, brains were processed as previously described [11, 29]. The postmortem interval (PMI) did not differ across groups (p = 0.566; table 1). The procedure used for ultrastructural assessment of synapses was identical to that described previously [5, 6]. In brief, at the time of autopsy, the entire left PreC was removed in toto, defined as the mesial aspect of the parietal lobe bordered by the parieto-occipital sulcus posteriorly, the subparietal sulcus inferiorly, the marginal ramus of the cingulate sulcus anteriorly, and the most dorsal aspect of the cortical surface at the sagittal sulcus. Within the first 0.5 cm, a random starting point was chosen according to unbiased stereologic sampling methods [35] and the remaining entire gyrus was subsequently sectioned into 0.5 cm coronal slabs. The average length of the PreC was 4.04 cm. Alternate slabs (3 to 5 per subject) was immediately immersion fixed for 24 hours in 4% paraformaldehyde with 1% glutaraldehyde. Slabs were subsequently exhaustively sectioned at 100μm with a vibratome (Vibratome Co., St. Louis, MO), and a random number table used to identify sections for ultrastructural investigation. Designated sections were postfixed in 1% osmium tetroxide (OsO4), stained en bloc with 0.5% uranyl acetate, dehydrated in a graded series of ethanol, infiltrated with epoxy embedding resin, and flat embedded in circular molds (Ted Pella, Redding, CA). The remaining slabs were used for routine pathology and chemical analysis.
The length of lamina 3 of the PreC was determined with the Bioquant image analysis system on each section, and this length partitioned into a minimum of 6 equal segments. A random number table was used to determine which portions of the lamina 3 length to analyze. Blocks containing the randomly selected portions of the PreC were trimmed to the appropriate region. Ribbons of six to eight ultrathin sections (silver-gold interface range) were taken and collected on formvar-coated, carbon-stabilized slot grids. Sections were stained with uranyl acetate (3%) and Reynolds lead citrate. A total of 15 to 24 different regions of the PreC were assessed depending on brain size. Larger brains have a larger PreC and generated more regions.
The physical disector method [36] was used to approximate the total number of synapses per unit volume (Nv). Electron micrographs were taken with a Zeiss EM-902 (Oberkochen, West Germany) at X4,400 and photographically enlarged to approximately X20,000. Every synaptic profile on each micrograph was identified by the presence of the postsynaptic density in association with the postsynaptic element and synaptic vesicles in a presynaptic terminal and marked (Figure 1). An unbiased counting frame was randomly superimposed over the micrographs. Only those synaptic profiles observed on the reference micrograph within the counting frame that did not violate the counting frame rules [35] and were not on the look-up micrograph were counted. To increase efficiency, the look-up and reference sections were reversed, and the counting frame was again applied in a random fashion. The thickness of the ultrathin sections was estimated with the Small method of minimal folds [37].
Fig. 1.
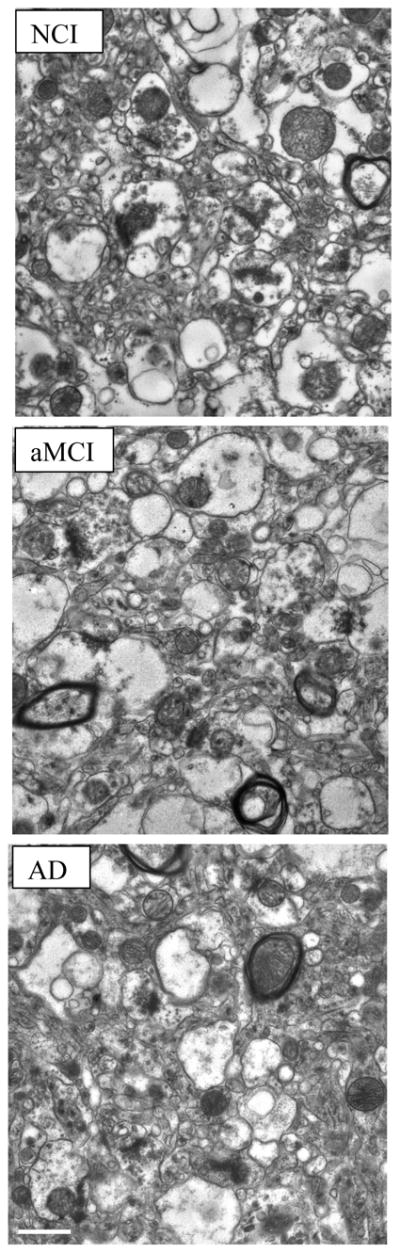
Representative electron micrographs of lamina 3 of the precuneus showing synaptic complexes in tissue from the three different cohorts studied: no cognitive impairment (NCI); amnestic mild cognitive impairment (aMCI); Alzheimer’s disease (AD). In all tissues, the synaptic complexes appeared normal with synaptic vesicles observed in the presynaptic compartment and a synaptic density observed in the postsynaptic component. Calibration bar = 0.5μm.
The numerical density of synapses per unit volume, Nv, was calculated using the following formula: , where Q− is the mean number of synapses counted in each disector and Vdis is the mean disector volume. The total number of synapses, Nsyn, was calculated for each case using the following formula .
Estimation of total volume of lamina III
As part of the procedure for estimating the total number of synapses using the physical dissector it is necessary to estimate the total reference volume (Vref) of the region of interest. This was accomplished as previously described [6]. Briefly, 100 μm thick sections immediately adjacent to those used for ultrastructural analysis were designated for determination of Vref and processed using procedures identical to that for ultrastructural evaluation. These sections were infused with embedding resin, flat embedded on glass microscope slides held in rubber molds (Ted Pella, Redding, CA) and coverslipped using embedding resin as the mounting medium. Using an image analysis system (BIOQUANT, Nashville, TN) interfaced with a light microscope (VANOX-S AH-2, Olympus Optical, Tokyo, Japan), lamina III of the PreC was determined on each section using well described anatomical landmarks [38]. The total volume was determined using the Cavalieri method [35].
Measurement of soluble Aβ and [3H]PiB binding assay
The subjects used in the present ultrastructural study are a subset of NCI, MCI, and AD cases used in a recent publication by our group evaluating soluble Aβ1-42 concentration and [3H]PiB binding in the PreC [39]. Briefly, Aβ42 peptide concentration was quantified in diethylamine (DEA)-soluble Aβ fractions and assayed using a fluorescent-based ELISA (Biosource, Camarillo, CA) with a capture antibody specific for the NH2 terminus of human Aβ (amino acids 1–16). Values for detection antibodies specific for the neoepitope at the 42-amino acid end of Aβ were determined from standard curves using synthetic Aβ42 peptide (Biosource) and expressed as picomoles per gram wet weight. For the [3H]PiB binding, unlabeled PiB was dissolved in dimethyl sulfoxide (DMSO) at 400 mM to yield < 1% DMSO in the final assay. [3H]PiB (American Radiolabled Chemicals, St. Louis, MO) was incubated with 100 mg tissue in 1 mL PBS. The binding mixture was filtered through a Whatman FG/B glass filter, rapidly washed with 3 mL PBS, vortexed overnight. Filters were counted in CytoScint ES, corrected for nonspecific, non-displaceable binding in the presence of 1 mM PiB and final values expressed as picomoles of [3H]PiB bound per gram of wet tissue weight.
Statistical Analysis
The relationship between dependent variables and clinical diagnostic group was examined with an analysis of variance (ANOVA) using Statview 5.0 (SAS Institute, Cary, NC). If a significant ANOVA was found, post-hoc tests (Fischer’s PLSD) were used to identify pairs of diagnostic groups that differed significantly. Because the diagnostic groups were heterogeneous in their clinical features, the relationship between total synaptic counts and performance on neuropsychological tests at last clinical evaluation was examined using Spearman correlation with the InStat program (GraphPad, San Diego, CA). Level of significance was set at p < 0.05.
RESULTS
Demographics
Table 1 shows characteristics of the sample population by clinical diagnostic group. The NCI, aMCI, and AD groups did not differ in age, postmortem interval (PMI), brain weight, and level of education attained (p > 0.1). As expected there was a significant difference in the MMSE [F(2,24) = 29.015; p < 0.0001] with the AD group significantly different from both NCI and aMCI (p < 0.0001). The NCI and MCI cohorts were not significantly different from each other (p > 0.1). The distribution of subjects categorized by ApoE allele status by cohort is shown in Table 2 and by NIA-Reagan diagnosis in Table 3.
Table 2.
Distribution of ApoE categories by diagnosis
| ApoE | NCI | aMCI | AD |
|---|---|---|---|
| E2/2 | 0 | 1 (10%) | 0 |
| E2/3 | 1 (10%) | 0 | 1 (12%) |
| E3/3 | 8 (80%) | 4 (45%) | 4 (50%) |
| E3/4 | 0 | 4 (45%) | 3 (38%) |
| E4/4 | 1 (10%) | 0 | 0 |
NCI (no cognitive impairment); aMCI (amnestic mild cognitive impairment); AD (Alzheimer’s disease)
Table 3.
Distribution of neuropathological diagnoses by NIA-Reagan criteria
| Clinical Diagnosis | NCI | aMCI | AD | |
|---|---|---|---|---|
| 1. | High likelihood | 1 (11%) | 1 (10%) | 4 (50%) |
| 2. | Intermediate likelihood | 0 | 2 (23%) | 2 (25%) |
| 3. | Low likelihood | 3 (30%) | 6 (67%) | 2 (25%) |
| 4. | Not AD | 6 (60%) | 0 | 0 |
NCI (no cognitive impairment); aMCI (amnestic mild cognitive impairment); AD (Alzheimer’s disease)
Total Synaptic Number and Volume in Lamina 3
The total synaptic counts for lamina 3 of the PreC for each subject in each of the three diagnostic groups are shown in Figure 2A. Following a one-way ANOVA, post hoc testing revealed a significant difference between NCI and AD (p < 0.05) but no difference between NCI and aMCI. An ANOVA also failed to reveal any significant difference between group means for the volume of PreC lamina 3 (p > 0.1) (Figure 2B).
Fig. 2.

Estimates of the total number of synapses (A) in lamina 3 of the precuneus cortex. Subjects were categorized clinically as no cognitive impairment (NCI), amnestic mild cognitive impairment (aMCI), or Alzheimer’s disease (AD). Estimates were obtained using unbiased stereology coupled with electron microscopic imaging of synapses. The total volume (B) of lamina 3 of the precuneus cortex was estimated with the Cavalieri method directly from tissue sections immediately adjacent to regions used for synaptic counts. Single points represent individual subjects. Horizontal lines indicates group median. *p < 0.05 compared to NCI.
Neuropsychological Test Scores
We evaluated the association between the total number of synapses in lamina 3 of the PreC and scores achieved on several neuropsychological tests obtained during the subject’s last clinical evaluation. Correlation between total synaptic numbers and MMSE was not significant (r = .268; p > 0.1), although there was a trend for scores to be higher with increased synaptic numbers (Figure 3). There was no significant association between total synaptic numbers and any of the other standard neuropsychological scores: immediate word list recall (r = .162; p > 0.1), delayed word list recall (r = .028; p > 0.1); word recognition (r = .219; p > 0.1); Boston Naming Test (r = .05; p > 0.1). We also probed a possible association with episodic memory using the logical memory story recall. The analysis failed to detect a significant association (r = .175; p > 0.1) between synaptic numbers and memory score despite the fact that a group analysis showed a significant decline in logical memory with disease progression [F(2,22) = 4.765; p < 0.05]. Subjects’ age (r = .239; p > 0.1) and years of education (r = .322; p > 0.1) were not significantly associated with total synaptic numbers.
Fig. 3.

Scatterplot showing the relationship between estimates of total number of synapses in lamina 3 of the precuneus cortex and the subject’s score on the Mini Mental Status Examination (MMSE).
Pittsburgh compound B (PiB) binding and soluble amyloid-β concentration
PreC [3H]PiB binding and soluble Aβ1-42 concentration were similar to that previously reported for a larger sample which included the current cases [39]. An ANOVA revealed a significant group effect for [3H]PiB binding [F(2,23) = 11.823; p < 0.0005] and post hoc testing revealed a significant increase for the AD cohort compared to both the NCI (p < 0.0001) and aMCI (p < 0.005) groups. Although the NCI and aMCI groups were not significantly different (p > 0.1), the aMCI cohort displayed a 1.6 fold increase. The association between [3H]PiB binding and total synaptic numbers failed to research significance (r = .355; p > 0.07), although there was a trend indicating that as [3H]PiB binding increased total synaptic numbers were lower (Figure 4). A strong association was observed between [3H]PiB binding and MMSE scores (r = .763; p < 0.0001) as previously reported [39]. Other neuropsychological scores were also significantly correlated (delayed recall r = .523; p < 0.005; immediate recall r = .475; p < 0.01; episodic memory r = .596; p < 0.005). There was a significant change in Aβ1–42 concentration with the disease progression [F(2,23) = 6.269; p < 0.01] with the AD group showing significantly increased levels compared to both the NCI (p < 0.005) and aMCI (p < 0.05) cohorts (Figure 5). As with the [3H]PiB binding, the aMCI group was not significantly different from NCI (p > 0.1) but did reveal a 1.7 fold increase in Aβ42. The association between Aβ1–42 concentrations and synaptic numbers was not significant (r = .242; p > 0.1). Concentrations of Aβ1–42 strongly correlated with MMSE (r = .603; p < 0.005); delayed recall (r = .508; p < 0.0100); immediate recall (r = .718; p < 0.0001); episodic memory (r = .478; p < 0.05) but not with word recognition or Boston Naming Test (p > 0.1).
Fig. 4.

Scatterplot showing the relationship between estimates of total number of synapses in lamina 3 of the precuneus cortex and [3H]PiB binding in tissue immediately adjacent to that used for ultrastructural examination.
Fig. 5.

Scatterplot showing the relationship between estimates of total number of synapses in lamina 3 of the precuneus cortex and levels of soluble Aβ42 in tissue immediately adjacent to that used for ultrastructural examination.
DISCUSSION
Numerous neuroimaging studies have identified the PreC as an area involved early in the progression of AD. Based upon high levels of amyloid binding, even in cognitively normal individuals, these studies suggest a possible link to cognitive dysfunction early in the disease process [17, 19–21, 40–45]. Several studies have now questioned whether or not changes in amyloid observed with neuroimaging actually reflect the possible onset of AD and foretell cognitive decline [46–48].
The present quantitative ultrastructural study is the first to evaluate possible synaptic change in the PreC as a function of AD progression. Individuals used in this study were originally enrolled as cognitively normal and subsequently followed until death, with many individuals evaluated for more than 12 years. Some of the individuals transitioned to aMCI and then into AD. Three different cohorts were matched based on age, PMI, and level of education. As expected, the AD group had a significantly lower MMSE compared to the other two groups. The aMCI cohort did not show a significant decline in total synaptic numbers in PreC lamina 3 while individuals with AD displayed lower numbers compared to the NCI group. There was considerable overlap between the three diagnostic groups. A detailed evaluation of lamina 3 volumes among the three diagnostic groups did not reveal any significant differences supporting the idea that this area does not undergo substantial atrophy early in the disease process. This is in contrast to earlier studies that report a significant amount of atrophy in the PreC based upon neuroimaging [49–51] but supports a study using PiB that also failed to identify significant PreC atrophy on structural scans [52]. In the present study, only the volume of lamina 3 was evaluated using an unbiased stereological approach on numerous tissue sections. None of the AD cases examined where early onset cases and the age of all three cohorts were substantially older than in the studies that reported atrophy. It is possible that the overall structure of the PreC shows atrophy that is not totally reflected in lamina 3.
Although imaging studies indicate that the PreC region is affected early and severely in AD, the results of a recent neuropathology study did not support this idea [53]. NFT counts were not significantly different between the PreC and any of the cortical regions expect the occipital cortex (areas BA17-18), which had substantially lower counts. In terms of DP and NP counts, the PreC did not show a greater accumulation compared to any of the other cortical regions examined, with the exception of the occipital areas for DP and the posterior cingulate (BA23) for NPs. The lack of differences in pathology was independent of the cognitive scores. Other neuropathological investigations have not highlighted the PreC as a region of early pathologic involvement or substantially greater involvement in AD [54, 55].
Previous studies evaluating synaptic numbers in neocortex during the progression of AD have shown a significant association with several different tests of cognition [4–7, 56] including the MMSE, a test commonly used to screen for cognitive impairment [57] and a standard in AD clinical research. For example, total synaptic numbers decrease significantly in the inferior temporal gyrus (ITG), a higher order cortical association area in individuals with aMCI and AD [7]. Synaptic numbers in the ITG show a strong association with the MMSE and also a test of verbal fluency that is not part of the MMSE [7]. Similar relationships between cognition and synapse numbers can be observed in the hippocampus [5]. The PreC, a major hub of the default cortical memory circuit that is interconnected with numerous other neocortical association regions [58–60], failed to show a reduction in total synaptic numbers. In addition, total synaptic numbers in the PreC did not strongly associate with the MMSE. Several other cognitive tests, including episodic memory also failed to demonstrate a strong association. These findings suggest that different cortical association areas respond differentially to the disease process at different stages of AD. There is also the possibility that although the synaptic structure is present and appears intact in the micrographs, some of these structures may be impaired in function contributing to a change in cognition.
The underlying causes for this differential response to the disease remain unknown. One possibility is that select cortical regions may show resilience to amyloid toxicity in MCI including the PreC or that a toxic threshold was not reached. Amyloid deposition could possess fundamental, brain region specific characteristics that are not yet fully appreciated. Several studies have suggested that AD is the result of circuit-based pathology, which affects both afferent and efferent projection systems. There was a significant increase in both PreC [3H]PiB binding and soluble Aβ1-42 concentration in the AD group compared to both NCI and aMCI, but these two latter groups did not differ from each other as reported previously [39]. Levels of PreC [3H]PiB binding and soluble Aβ1-42 concentration strongly associate with various cognitive tests, but what is driving that association is unclear. Although a previous study revealed a strong association between 11C-PiB imaging and fibrillar Aβ deposits, but not neurofibrillary pathology [61], increased 11C-PiB imaging has been shown to associate with a decline in a single episodic memory measure [62]. The precise relationship between AD pathology and clinical impairment remains to be determined.
Cognitive impairment is likely the result of an extensive cortical disconnection and not dysfunction related to damage in a single area. The lack of association between synaptic numbers and episodic memory may be due to the fact that the PreC is only component of the circuitry involved in memory. Tract tracing studies of the primate PreC have shown that this neocortical region has widespread efferent and afferent connections with brain regions involved in higher order cognitive activity [63–70]. For example, the PreC has reciprocal connections with frontal cortex, premotor supplementary eye fields, superior and inferior lateral parietal regions, posterior cingulate gyrus and retrosplenial cortex. There are also reciprocal connections with the contralateral PreC [66]. The PreC also has extensive thalamic interconnections with the ventrolateral, lateral posterior, dorsomedial, intralaminar and pulvinar regions [68–70], which in turn innervate cortical regions associated with higher order cognitive function[71].
Although we did not find an association between synapse number and episodic memory, it doesn’t mean that this area isn’t involved in this complex task but rather that the magnitude of the change may not be sufficient to account for possible differences between groups for this cognitive task. Episodic memory involves many diverse cortical regions including the PreC and prefrontal cortex [72, 73]. By contrast, other reports implicate the PreC in episodic memory, a subcategory of explicit memory in which an individual recalls events that are auto-biographical [58, 59, 72, 73]. In this regard, functional MRI (fMRI) studies have shown that medial parietal cortex, including the PreC is activated during episodic memory retrieval [60]. A major component of episodic memory is autonoetic awareness coupled with a subjectively sensed time of when certain events occurred [74]. Autonoetic consciousness is compromised early in the progression of AD [75, 76]. Both a meta-analysis[77] and a principal component analysis (PCA) [78] have shown that episodic memory deficits can be a significant factor in predicting conversion from NCI to AD. In healthy brain, the precuneus demonstrates high metabolic activity during conscious rest and selectively deactivates during non-self-directed cognitive tasks [79]. However, there is a marked decrease in brain glucose metabolism at rest that corresponds to the severity of autobiographical memory impairment in AD brain [80]. Several fMRI investigations support this finding and show a significant impairment in the ability of the precuneus to inactivate during cognitive tasks, even at the earliest disease stages before the onset of overt cognitive impairment [43, 49, 81–91]. Although altered glucose activity may predispose the PreC to synaptic insult over time, it may not be the driving factor early in the disease state.
In the samples used in the present analysis, there was a significant increase in both [3H]PiB binding and soluble Aβ42 concentration in the AD group compared to both NCI and aMCI, but these two latter groups did not differ from each other. Although PiB binding was 1.6 fold higher in the aMCI cohort compared to the NCI group, this wasn’t sufficient to statistically differentiate the two groups. It is important to note that the current study used a relatively small number of cases in each cohort precluding generalizations concerning the relationship between total synaptic numbers and cognitive test results. Further investigation using a larger sample size are warrented.
Acknowledgments
This work was supported by the National Institute of Health grants: P01 AG14449; P30 AG028383; P01 AG025204R01; AG027219, AG025204 and the Mansbach Chair in Alzheimer’s Disease. We are indebted to the altruism of the participants in the SBCOA (http://www.mc.uky.edu/coa/clinicalcore/research_opportunities.html) and the Religious Orders Study (http://www.rush.edu/rumc/page-R1239.html). The pathological diagnosis was performed by M.R. Markesbery and P.T. Nelson (SBCOA) and J.A. Schneider (Rush University Medical Center).
References
- 1.Consensus recommendations for the postmortem diagnosis of Alzheimer’s disease. The National Institute on Aging, and reagan Institute Working Group on Diagnostic Criteria for the Neuropathological Assessment of Alzheimer’s Disease. Neurobiol Aging. 1997;18:S1–S2. [PubMed] [Google Scholar]
- 2.Montine TJ, Phelps CH, Beach TG, Bigio EH, Cairns NJ, Dickson DW, Duyckaerts C, Frosch MP, Masliah E, Mirra SS, Nelson PT, Schneider JA, Thal DR, Trojanowski JQ, Vinters HV, Hyman BT. National Institute on Aging-Alzheimer’s Association guidelines for the neuropathologic assessment of Alzheimer’s disease: a practical approach. Acta Neuropathol. 2012;123:1–11. doi: 10.1007/s00401-011-0910-3. [DOI] [PMC free article] [PubMed] [Google Scholar]
- 3.Scheff SW, Price DA. Alzheimer’s disease-related alterations in synaptic density: neocortex and hippocampus. J Alzheimers Dis. 2006;9:101–115. doi: 10.3233/jad-2006-9s312. [DOI] [PubMed] [Google Scholar]
- 4.Terry RD, Masliah E, Salmon DP, Butters N, DeTeresa R, Hill R, Hansen LA, Katzman R. Physical basis of cognitive alterations in Alzheimer’s disease: synapse loss is the major correlate of cognitive impairment. Ann Neurol. 1991;30:572–580. doi: 10.1002/ana.410300410. [DOI] [PubMed] [Google Scholar]
- 5.Scheff SW, Price DA, Schmitt FA, DeKosky ST, Mufson EJ. Synaptic alterations in CA1 in mild Alzheimer disease and mild cognitive impairment. Neurology. 2007;68:1501–1508. doi: 10.1212/01.wnl.0000260698.46517.8f. [DOI] [PubMed] [Google Scholar]
- 6.Scheff SW, Price DA, Schmitt FA, Mufson EJ. Hippocampal synaptic loss in early Alzheimer’s disease and mild cognitive impairment. Neurobiol Aging. 2006;27:1372–1384. doi: 10.1016/j.neurobiolaging.2005.09.012. [DOI] [PubMed] [Google Scholar]
- 7.Scheff SW, Price DA, Schmitt FA, Scheff MA, Mufson EJ. Synaptic loss in the inferior temporal gyrus in mild cognitive impairment and Alzheimer’s disease. J Alzheimers Dis. 2011;24:547–557. doi: 10.3233/JAD-2011-101782. [DOI] [PMC free article] [PubMed] [Google Scholar]
- 8.Counts SE, He B, Nadeem M, Wuu J, Scheff SW, Mufson EJ. Hippocampal drebrin loss in mild cognitive impairment. Neurodegener Dis. 2012;10:216–219. doi: 10.1159/000333122. [DOI] [PMC free article] [PubMed] [Google Scholar]
- 9.Flicker C, Ferris SH, Reisberg B. Mild cognitive impairment in the elderly: predictors of dementia. Neurology. 1991;41:1006–1009. doi: 10.1212/wnl.41.7.1006. [DOI] [PubMed] [Google Scholar]
- 10.Petersen RC. Conceptual overview. In: Petersen RC, editor. Mild cognitive impairment. Oxford University Press; New York: 2003. pp. 1–14. [Google Scholar]
- 11.Markesbery WR, Schmitt FA, Kryscio RJ, Davis DG, Smith CD, Wekstein DR. Neuropathologic substrate of mild cognitive impairment. Arch Neurol. 2006;63:38–46. doi: 10.1001/archneur.63.1.38. [DOI] [PubMed] [Google Scholar]
- 12.Petersen RC, Parisi JE, Dickson DW, Johnson KA, Knopman DS, Boeve BF, Jicha GA, Ivnik RJ, Smith GE, Tangalos EG, Braak H, Kokmen E. Neuropathologic features of amnestic mild cognitive impairment. Arch Neurol. 2006;63:665–672. doi: 10.1001/archneur.63.5.665. [DOI] [PubMed] [Google Scholar]
- 13.Schneider JA, Arvanitakis Z, Leurgans SE, Bennett DA. The neuropathology of probable Alzheimer disease and mild cognitive impairment. Ann Neurol. 2009;66:200–208. doi: 10.1002/ana.21706. [DOI] [PMC free article] [PubMed] [Google Scholar]
- 14.Markesbery WR. Neuropathologic alterations in mild cognitive impairment: a review. J Alzheimers Dis. 2010;19:221–228. doi: 10.3233/JAD-2010-1220. [DOI] [PMC free article] [PubMed] [Google Scholar]
- 15.Hansson O, Zetterberg H, Buchhave P, Londos E, Blennow K, Minthon L. Association between CSF biomarkers and incipient Alzheimer’s disease in patients with mild cognitive impairment: a follow-up study. Lancet Neurol. 2006;5:228–234. doi: 10.1016/S1474-4422(06)70355-6. [DOI] [PubMed] [Google Scholar]
- 16.Herukka SK, Hallikainen M, Soininen H, Pirttila T. CSF Abeta42 and tau or phosphorylated tau and prediction of progressive mild cognitive impairment. Neurology. 2005;64:1294–1297. doi: 10.1212/01.WNL.0000156914.16988.56. [DOI] [PubMed] [Google Scholar]
- 17.Klunk WE, Engler H, Nordberg A, Wang Y, Blomqvist G, Holt DP, Bergstrom M, Savitcheva I, Huang GF, Estrada S, Ausen B, Debnath ML, Barletta J, Price JC, Sandell J, Lopresti BJ, Wall A, Koivisto P, Antoni G, Mathis CA, Langstrom B. Imaging brain amyloid in Alzheimer’s disease with Pittsburgh Compound-B. Ann Neurol. 2004;55:306–319. doi: 10.1002/ana.20009. [DOI] [PubMed] [Google Scholar]
- 18.Cohen AD, Rabinovici GD, Mathis CA, Jagust WJ, Klunk WE, Ikonomovic MD. Using Pittsburgh Compound B for in vivo PET imaging of fibrillar amyloid-beta. Adv Pharmacol. 2012;64:27–81. doi: 10.1016/B978-0-12-394816-8.00002-7. [DOI] [PMC free article] [PubMed] [Google Scholar]
- 19.Buckner RL, Snyder AZ, Shannon BJ, LaRossa G, Sachs R, Fotenos AF, Sheline YI, Klunk WE, Mathis CA, Morris JC, Mintun MA. Molecular, structural, and functional characterization of Alzheimer’s disease: evidence for a relationship between default activity, amyloid, and memory. J Neurosci. 2005;25:7709–7717. doi: 10.1523/JNEUROSCI.2177-05.2005. [DOI] [PMC free article] [PubMed] [Google Scholar]
- 20.Sperling RA, Laviolette PS, O’Keefe K, O’Brien J, Rentz DM, Pihlajamaki M, Marshall G, Hyman BT, Selkoe DJ, Hedden T, Buckner RL, Becker JA, Johnson KA. Amyloid deposition is associated with impaired default network function in older persons without dementia. Neuron. 2009;63:178–188. doi: 10.1016/j.neuron.2009.07.003. [DOI] [PMC free article] [PubMed] [Google Scholar]
- 21.Sheline YI, Raichle ME, Snyder AZ, Morris JC, Head D, Wang S, Mintun MA. Amyloid plaques disrupt resting state default mode network connectivity in cognitively normal elderly. Biol Psychiatry. 2010;67:584–587. doi: 10.1016/j.biopsych.2009.08.024. [DOI] [PMC free article] [PubMed] [Google Scholar]
- 22.Selkoe DJ. Soluble oligomers of the amyloid beta-protein impair synaptic plasticity and behavior. Behav Brain Res. 2008;192:106–113. doi: 10.1016/j.bbr.2008.02.016. [DOI] [PMC free article] [PubMed] [Google Scholar]
- 23.Parihar MS, Brewer GJ. Amyloid-beta as a modulator of synaptic plasticity. J Alzheimers Dis. 2010;22:741–763. doi: 10.3233/JAD-2010-101020. [DOI] [PMC free article] [PubMed] [Google Scholar]
- 24.Arendt T. Synaptic degeneration in Alzheimer’s disease. Acta Neuropathol. 2009;118:167–179. doi: 10.1007/s00401-009-0536-x. [DOI] [PubMed] [Google Scholar]
- 25.Cerpa W, Dinamarca MC, Inestrosa NC. Structure-function implications in Alzheimer’s disease: effect of Abeta oligomers at central synapses. Curr Alzheimer Res. 2008;5:233–243. doi: 10.2174/156720508784533321. [DOI] [PubMed] [Google Scholar]
- 26.Marcello E, Epis R, Di Luca M. Amyloid flirting with synaptic failure: towards a comprehensive view of Alzheimer’s disease pathogenesis. Eur J Pharmacol. 2008;585:109–118. doi: 10.1016/j.ejphar.2007.11.083. [DOI] [PubMed] [Google Scholar]
- 27.Bennett DA, Wilson RS, Schneider JA, Evans DA, Beckett LA, Aggarwal NT, Barnes LL, Fox JH, Bach J. Natural history of mild cognitive impairment in older persons. Neurology. 2002;59:198–205. doi: 10.1212/wnl.59.2.198. [DOI] [PubMed] [Google Scholar]
- 28.DeKosky ST, Ikonomovic MD, Styren SD, Beckett L, Wisniewski S, Bennett DA, Cochran EJ, Kordower JH, Mufson EJ. Upregulation of choline acetyltransferase activity in hippocampus and frontal cortex of elderly subjects with mild cognitive impairment. Ann Neurol. 2002;51:145–155. doi: 10.1002/ana.10069. [DOI] [PubMed] [Google Scholar]
- 29.Mufson EJ, Ma SY, Cochran EJ, Bennett DA, Beckett LA, Jaffar S, Saragovi HU, Kordower JH. Loss of nucleus basalis neurons containing trkA immunoreactivity in individuals with mild cognitive impairment and early Alzheimer’s disease. J Comp Neurol. 2000;427:19–30. doi: 10.1002/1096-9861(20001106)427:1<19::aid-cne2>3.0.co;2-a. [DOI] [PubMed] [Google Scholar]
- 30.Davis DG, Schmitt FA, Wekstein DR, Markesbery WR. Alzheimer neuropathologic alterations in aged cognitively normal subjects. J Neuropathol Exp Neurol. 1999;58:376–388. doi: 10.1097/00005072-199904000-00008. [DOI] [PubMed] [Google Scholar]
- 31.Bennett DA, Schneider JA, Arvanitakis Z, Wilson RS. Overview and findings from the religious orders study. Curr Alzheimer Res. 2012;9:628–645. doi: 10.2174/156720512801322573. [DOI] [PMC free article] [PubMed] [Google Scholar]
- 32.Negash S, Bennett DA, Wilson RS, Schneider JA, Arnold SE. Cognition and neuropathology in aging: multidimensional perspectives from the Rush Religious Orders Study and Rush Memory And Aging Project. Curr Alzheimer Res. 2011;8:336–340. doi: 10.2174/156720511795745302. [DOI] [PMC free article] [PubMed] [Google Scholar]
- 33.Schmitt FA, Nelson PT, Abner E, Scheff S, Jicha GA, Smith C, Cooper G, Mendiondo M, Danner DD, Van Eldik LJ, Caban-Holt A, Lovell MA, Kryscio RJ. University of Kentucky Sanders-Brown healthy brain aging volunteers: donor characteristics, procedures and neuropathology. Curr Alzheimer Res. 2012;9:724–733. doi: 10.2174/156720512801322591. [DOI] [PMC free article] [PubMed] [Google Scholar]
- 34.Schmitt FA, Davis DG, Wekstein DR, Smith CD, Ashford JW, Markesbery WR. “Preclinical” AD revisited: neuropathology of cognitively normal older adults. Neurology. 2000;55:370–376. doi: 10.1212/wnl.55.3.370. [DOI] [PubMed] [Google Scholar]
- 35.Mouton PR. Principles and practices of unbiased stereology. The Johns Hopkins University Press; Baltimore: 2002. [Google Scholar]
- 36.Gundersen HJG. Stereology of arbitrary particles. Journal of Microscopy. 1986;143:3–45. [PubMed] [Google Scholar]
- 37.Weibel E. Point counting method. In: Weibel ER, editor. Stereological Method. Academic Press; London: 1979. pp. 101–161. [Google Scholar]
- 38.Zilles K. Architecture of the human cerebral cortex. In: Paxionos G, Mai JK, editors. The human nervous system. Elsevier Academic Press; London: 2004. pp. 997–1055. [Google Scholar]
- 39.Ikonomovic MD, Klunk WE, Abrahamson EE, Wuu J, Mathis CA, Scheff SW, Mufson EJ, DeKosky ST. Precuneus amyloid burden is associated with reduced cholinergic activity in Alzheimer disease. Neurology. 2011;77:39–47. doi: 10.1212/WNL.0b013e3182231419. [DOI] [PMC free article] [PubMed] [Google Scholar]
- 40.Baron JC, Chetelat G, Desgranges B, Perchey G, Landeau B, de la Sayette V, Eustache F. In vivo mapping of gray matter loss with voxel-based morphometry in mild Alzheimer’s disease. Neuroimage. 2001;14:298–309. doi: 10.1006/nimg.2001.0848. [DOI] [PubMed] [Google Scholar]
- 41.Edison P, Archer HA, Hinz R, Hammers A, Pavese N, Tai YF, Hotton G, Cutler D, Fox N, Kennedy A, Rossor M, Brooks DJ. Amyloid, hypometabolism, and cognition in Alzheimer disease: an [11C]PIB and [18F]FDG PET study. Neurology. 2007;68:501–508. doi: 10.1212/01.wnl.0000244749.20056.d4. [DOI] [PubMed] [Google Scholar]
- 42.Frisoni GB, Testa C, Zorzan A, Sabattoli F, Beltramello A, Soininen H, Laakso MP. Detection of grey matter loss in mild Alzheimer’s disease with voxel based morphometry. J Neurol Neurosurg Psychiatry. 2002;73:657–664. doi: 10.1136/jnnp.73.6.657. [DOI] [PMC free article] [PubMed] [Google Scholar]
- 43.Herholz K, Carter SF, Jones M. Positron emission tomography imaging in dementia. Br J Radiol. 2007;80(Spec No 2):S160–167. doi: 10.1259/bjr/97295129. [DOI] [PubMed] [Google Scholar]
- 44.Ibanez V, Pietrini P, Alexander GE, Furey ML, Teichberg D, Rajapakse JC, Rapoport SI, Schapiro MB, Horwitz B. Regional glucose metabolic abnormalities are not the result of atrophy in Alzheimer’s disease. Neurology. 1998;50:1585–1593. doi: 10.1212/wnl.50.6.1585. [DOI] [PubMed] [Google Scholar]
- 45.Rowe CC, Ng S, Ackermann U, Gong SJ, Pike K, Savage G, Cowie TF, Dickinson KL, Maruff P, Darby D, Smith C, Woodward M, Merory J, Tochon-Danguy H, O’Keefe G, Klunk WE, Mathis CA, Price JC, Masters CL, Villemagne VL. Imaging beta-amyloid burden in aging and dementia. Neurology. 2007;68:1718–1725. doi: 10.1212/01.wnl.0000261919.22630.ea. [DOI] [PubMed] [Google Scholar]
- 46.Driscoll I, Zhou Y, An Y, Sojkova J, Davatzikos C, Kraut MA, Ye W, Ferrucci L, Mathis CA, Klunk WE, Wong DF, Resnick SM. Lack of association between 11C-PiB and longitudinal brain atrophy in non-demented older individuals. Neurobiol Aging. 2011;32:2123–2130. doi: 10.1016/j.neurobiolaging.2009.12.008. [DOI] [PMC free article] [PubMed] [Google Scholar]
- 47.Fjell AM, Walhovd KB. Neuroimaging results impose new views on Alzheimer’s disease--the role of amyloid revised. Mol Neurobiol. 2012;45:153–172. doi: 10.1007/s12035-011-8228-7. [DOI] [PubMed] [Google Scholar]
- 48.Rabinovici GD, Furst AJ, Alkalay A, Racine CA, O’Neil JP, Janabi M, Baker SL, Agarwal N, Bonasera SJ, Mormino EC, Weiner MW, Gorno-Tempini ML, Rosen HJ, Miller BL, Jagust WJ. Increased metabolic vulnerability in early-onset Alzheimer’s disease is not related to amyloid burden. Brain. 2010;133:512–528. doi: 10.1093/brain/awp326. [DOI] [PMC free article] [PubMed] [Google Scholar]
- 49.Karas G, Scheltens P, Rombouts S, van Schijndel R, Klein M, Jones B, van der Flier W, Vrenken H, Barkhof F. Precuneus atrophy in early-onset Alzheimer’s disease: a morphometric structural MRI study. Neuroradiology. 2007;49:967–976. doi: 10.1007/s00234-007-0269-2. [DOI] [PubMed] [Google Scholar]
- 50.Ishii K, Kawachi T, Sasaki H, Kono AK, Fukuda T, Kojima Y, Mori E. Voxel-based morphometric comparison between early- and late-onset mild Alzheimer’s disease and assessment of diagnostic performance of z score images. AJNR Am J Neuroradiol. 2005;26:333–340. [PMC free article] [PubMed] [Google Scholar]
- 51.Frisoni GB, Testa C, Sabattoli F, Beltramello A, Soininen H, Laakso MP. Structural correlates of early and late onset Alzheimer’s disease: voxel based morphometric study. J Neurol Neurosurg Psychiatry. 2005;76:112–114. doi: 10.1136/jnnp.2003.029876. [DOI] [PMC free article] [PubMed] [Google Scholar]
- 52.Tosun D, Schuff N, Mathis CA, Jagust W, Weiner MW. Spatial patterns of brain amyloid-beta burden and atrophy rate associations in mild cognitive impairment. Brain. 2011;134:1077–1088. doi: 10.1093/brain/awr044. [DOI] [PMC free article] [PubMed] [Google Scholar]
- 53.Nelson PT, Abner EL, Scheff SW, Schmitt FA, Kryscio RJ, Jicha GA, Smith CD, Patel E, Markesbery WR. Alzheimer’s-type neuropathology in the precuneus is not increased relative to other areas of neocortex across a range of cognitive impairment. Neurosci Lett. 2009;450:336–339. doi: 10.1016/j.neulet.2008.11.006. [DOI] [PMC free article] [PubMed] [Google Scholar]
- 54.Braak H, Braak E. Neuropathological stageing of Alzheimer-related changes. Acta Neuropathol. 1991;82:239–259. doi: 10.1007/BF00308809. [DOI] [PubMed] [Google Scholar]
- 55.Giannakopoulos P, Hof PR, Michel JP, Guimon J, Bouras C. Cerebral cortex pathology in aging and Alzheimer’s disease: a quantitative survey of large hospital-based geriatric and psychiatric cohorts. Brain Res Brain Res Rev. 1997;25:217–245. doi: 10.1016/s0165-0173(97)00023-4. [DOI] [PubMed] [Google Scholar]
- 56.DeKosky ST, Scheff SW. Synapse loss in frontal cortex biopsies in Alzheimer’s disease: correlation with cognitive severity. Ann Neurol. 1990;27:457–464. doi: 10.1002/ana.410270502. [DOI] [PubMed] [Google Scholar]
- 57.Folstein MF, Folstein SE, McHugh PR. “Mini-mental state”. A practical method for grading the cognitive state of patients for the clinician. J Psychiatr Res. 1975;12:189–198. doi: 10.1016/0022-3956(75)90026-6. [DOI] [PubMed] [Google Scholar]
- 58.Cavanna AE, Trimble MR. The precuneus: a review of its functional anatomy and behavioural correlates. Brain. 2006;129:564–583. doi: 10.1093/brain/awl004. [DOI] [PubMed] [Google Scholar]
- 59.Fransson P, Marrelec G. The precuneus/posterior cingulate cortex plays a pivotal role in the default mode network: Evidence from a partial correlation network analysis. Neuroimage. 2008;42:1178–1184. doi: 10.1016/j.neuroimage.2008.05.059. [DOI] [PubMed] [Google Scholar]
- 60.Wagner AD, Shannon BJ, Kahn I, Buckner RL. Parietal lobe contributions to episodic memory retrieval. Trends Cogn Sci. 2005;9:445–453. doi: 10.1016/j.tics.2005.07.001. [DOI] [PubMed] [Google Scholar]
- 61.Ikonomovic MD, Klunk WE, Abrahamson EE, Mathis CA, Price JC, Tsopelas ND, Lopresti BJ, Ziolko S, Bi W, Paljug WR, Debnath ML, Hope CE, Isanski BA, Hamilton RL, DeKosky ST. Post-mortem correlates of in vivo PiB-PET amyloid imaging in a typical case of Alzheimer’s disease. Brain. 2008;131:1630–1645. doi: 10.1093/brain/awn016. [DOI] [PMC free article] [PubMed] [Google Scholar]
- 62.Perrotin A, Mormino EC, Madison CM, Hayenga AO, Jagust WJ. Subjective cognition and amyloid deposition imaging: a Pittsburgh Compound B positron emission tomography study in normal elderly individuals. Arch Neurol. 2012;69:223–229. doi: 10.1001/archneurol.2011.666. [DOI] [PMC free article] [PubMed] [Google Scholar]
- 63.Cavada C, Goldman-Rakic PS. Posterior parietal cortex in rhesus monkey: II. Evidence for segregated corticocortical networks linking sensory and limbic areas with the frontal lobe. J Comp Neurol. 1989;287:422–445. doi: 10.1002/cne.902870403. [DOI] [PubMed] [Google Scholar]
- 64.Cavada C, Goldman-Rakic PS. Posterior parietal cortex in rhesus monkey: I. Parcellation of areas based on distinctive limbic and sensory corticocortical connections. J Comp Neurol. 1989;287:393–421. doi: 10.1002/cne.902870402. [DOI] [PubMed] [Google Scholar]
- 65.Pandya DN, Seltzer B. Intrinsic connections and architectonics of posterior parietal cortex in the rhesus monkey. J Comp Neurol. 1982;204:196–210. doi: 10.1002/cne.902040208. [DOI] [PubMed] [Google Scholar]
- 66.Leichnetz GR. Connections of the medial posterior parietal cortex (area 7m) in the monkey. Anat Rec. 2001;263:215–236. doi: 10.1002/ar.1082. [DOI] [PubMed] [Google Scholar]
- 67.Goldman-Rakic PS. Topography of cognition: parallel distributed networks in primate association cortex. Annu Rev Neurosci. 1988;11:137–156. doi: 10.1146/annurev.ne.11.030188.001033. [DOI] [PubMed] [Google Scholar]
- 68.Yeterian EH, Pandya DN. Corticothalamic connections of the posterior parietal cortex in the rhesus monkey. J Comp Neurol. 1985;237:408–426. doi: 10.1002/cne.902370309. [DOI] [PubMed] [Google Scholar]
- 69.Schmahmann JD, Pandya DN. Anatomical investigation of projections from thalamus to posterior parietal cortex in the rhesus monkey: a WGA-HRP and fluorescent tracer study. J Comp Neurol. 1990;295:299–326. doi: 10.1002/cne.902950212. [DOI] [PubMed] [Google Scholar]
- 70.Parvizi J, Van Hoesen GW, Buckwalter J, Damasio A. Neural connections of the posteromedial cortex in the macaque. Proc Natl Acad Sci U S A. 2006;103:1563–1568. doi: 10.1073/pnas.0507729103. [DOI] [PMC free article] [PubMed] [Google Scholar]
- 71.Paxionos G, Mai JK. The Human Nervous System. Elsevier Academic Press; San Diego: 2004. [Google Scholar]
- 72.Lundstrom BN, Ingvar M, Petersson KM. The role of precuneus and left inferior frontal cortex during source memory episodic retrieval. Neuroimage. 2005;27:824–834. doi: 10.1016/j.neuroimage.2005.05.008. [DOI] [PubMed] [Google Scholar]
- 73.Lundstrom BN, Petersson KM, Andersson J, Johansson M, Fransson P, Ingvar M. Isolating the retrieval of imagined pictures during episodic memory: activation of the left precuneus and left prefrontal cortex. Neuroimage. 2003;20:1934–1943. doi: 10.1016/j.neuroimage.2003.07.017. [DOI] [PubMed] [Google Scholar]
- 74.Tulving E. Episodic memory: from mind to brain. Annu Rev Psychol. 2002;53:1–25. doi: 10.1146/annurev.psych.53.100901.135114. [DOI] [PubMed] [Google Scholar]
- 75.Irish M, Lawlor BA, O’Mara SM, Coen RF. Impaired capacity for autonoetic reliving during autobiographical event recall in mild Alzheimer’s disease. Cortex. 2011;47:236–249. doi: 10.1016/j.cortex.2010.01.002. [DOI] [PubMed] [Google Scholar]
- 76.Irish M, Lawlor BA, Coen RF, O’Mara SM. Everyday episodic memory in amnestic mild cognitive impairment: a preliminary investigation. BMC Neurosci. 2011;12:80–92. doi: 10.1186/1471-2202-12-80. [DOI] [PMC free article] [PubMed] [Google Scholar]
- 77.Backman L, Jones S, Berger AK, Laukka EJ, Small BJ. Cognitive impairment in preclinical Alzheimer’s disease: a meta-analysis. Neuropsychology. 2005;19:520–531. doi: 10.1037/0894-4105.19.4.520. [DOI] [PubMed] [Google Scholar]
- 78.Chapman RM, Mapstone M, McCrary JW, Gardner MN, Porsteinsson A, Sandoval TC, Guillily MD, Degrush E, Reilly LA. Predicting conversion from mild cognitive impairment to Alzheimer’s disease using neuropsychological tests and multivariate methods. J Clin Exp Neuropsychol. 2011;33:187–199. doi: 10.1080/13803395.2010.499356. [DOI] [PMC free article] [PubMed] [Google Scholar]
- 79.Sperling RA, Dickerson BC, Pihlajamaki M, Vannini P, LaViolette PS, Vitolo OV, Hedden T, Becker JA, Rentz DM, Selkoe DJ, Johnson KA. Functional alterations in memory networks in early Alzheimer’s disease. Neuromolecular Med. 2010;12:27–43. doi: 10.1007/s12017-009-8109-7. [DOI] [PMC free article] [PubMed] [Google Scholar]
- 80.Eustache F, Piolino P, Giffard B, Viader F, De La Sayette V, Baron JC, Desgranges B. ‘In the course of time’: a PET study of the cerebral substrates of autobiographical amnesia in Alzheimer’s disease. Brain. 2004;127:1549–1560. doi: 10.1093/brain/awh166. [DOI] [PubMed] [Google Scholar]
- 81.Kogure D, Matsuda H, Ohnishi T, Asada T, Uno M, Kunihiro T, Nakano S, Takasaki M. Longitudinal evaluation of early Alzheimer’s disease using brain perfusion SPECT. J Nucl Med. 2000;41:1155–1162. [PubMed] [Google Scholar]
- 82.Matsuda H. Cerebral blood flow and metabolic abnormalities in Alzheimer’s disease. Ann Nucl Med. 2001;15:85–92. doi: 10.1007/BF02988596. [DOI] [PubMed] [Google Scholar]
- 83.Herholz K, Salmon E, Perani D, Baron JC, Holthoff V, Frolich L, Schonknecht P, Ito K, Mielke R, Kalbe E, Zundorf G, Delbeuck X, Pelati O, Anchisi D, Fazio F, Kerrouche N, Desgranges B, Eustache F, Beuthien-Baumann B, Menzel C, Schroder J, Kato T, Arahata Y, Henze M, Heiss WD. Discrimination between Alzheimer dementia and controls by automated analysis of multicenter FDG PET. Neuroimage. 2002;17:302–316. doi: 10.1006/nimg.2002.1208. [DOI] [PubMed] [Google Scholar]
- 84.Okamura N, Arai H, Maruyama M, Higuchi M, Matsui T, Tanji H, Seki T, Hirai H, Chiba H, Itoh M, Sasaki H. Combined Analysis of CSF Tau Levels and [(123)I]Iodoamphetamine SPECT in Mild Cognitive Impairment: Implications for a Novel Predictor of Alzheimer’s Disease. Am J Psychiatry. 2002;159:474–476. doi: 10.1176/appi.ajp.159.3.474. [DOI] [PubMed] [Google Scholar]
- 85.Huang C, Wahlund LO, Almkvist O, Elehu D, Svensson L, Jonsson T, Winblad B, Julin P. Voxel- and VOI-based analysis of SPECT CBF in relation to clinical and psychological heterogeneity of mild cognitive impairment. Neuroimage. 2003;19:1137–1144. doi: 10.1016/s1053-8119(03)00168-x. [DOI] [PubMed] [Google Scholar]
- 86.Borroni B, Anchisi D, Paghera B, Vicini B, Kerrouche N, Garibotto V, Terzi A, Vignolo LA, Di Luca M, Giubbini R, Padovani A, Perani D. Combined 99mTc-ECD SPECT and neuropsychological studies in MCI for the assessment of conversion to AD. Neurobiol Aging. 2006;27:24–31. doi: 10.1016/j.neurobiolaging.2004.12.010. [DOI] [PubMed] [Google Scholar]
- 87.Matsuda H. The role of neuroimaging in mild cognitive impairment. Neuropathology. 2007;27:570–577. doi: 10.1111/j.1440-1789.2007.00794.x. [DOI] [PubMed] [Google Scholar]
- 88.Matsuda H, Mizumura S, Nagao T, Ota T, Iizuka T, Nemoto K, Takemura N, Arai H, Homma A. Automated discrimination between very early Alzheimer disease and controls using an easy Z-score imaging system for multicenter brain perfusion single-photon emission tomography. Am J Neuroradiol. 2007;28:731–736. [PMC free article] [PubMed] [Google Scholar]
- 89.Greicius MD, Srivastava G, Reiss AL, Menon V. Default-mode network activity distinguishes Alzheimer’s disease from healthy aging: evidence from functional MRI. Proc Natl Acad Sci U S A. 2004;101:4637–4642. doi: 10.1073/pnas.0308627101. [DOI] [PMC free article] [PubMed] [Google Scholar]
- 90.Lustig C, Snyder AZ, Bhakta M, O’Brien KC, McAvoy M, Raichle ME, Morris JC, Buckner RL. Functional deactivations: change with age and dementia of the Alzheimer type. Proc Natl Acad Sci U S A. 2003;100:14504–14509. doi: 10.1073/pnas.2235925100. [DOI] [PMC free article] [PubMed] [Google Scholar]
- 91.Rombouts SA, Barkhof F, Goekoop R, Stam CJ, Scheltens P. Altered resting state networks in mild cognitive impairment and mild Alzheimer’s disease: an fMRI study. Hum Brain Mapp. 2005;26:231–239. doi: 10.1002/hbm.20160. [DOI] [PMC free article] [PubMed] [Google Scholar]