

Abstract
Therapy for multiple myeloma (MM) has dramatically changed in the past decade with introduction of new drugs, but it is not clear if the improvements have been sustained. We studied 1038 patients diagnosed between 2001 and 2010, grouping patients into two five-year periods by diagnosis, 2001–2005 and 2006–2010. The median estimated follow up for the cohort was 5.9 years with 47% alive at last follow up. The median overall survival (OS) for the entire cohort was 5.2 years; 4.6 years for patients in the 2001–2005 group compared with 6.1 years for the 2006–2010 cohort (P=0.002). The improvement was primarily seen among patients over 65 years; the 6-year OS improving from 31% to 56%; P<0.001. Only 10% of patients died during the first year in the latter group, compared with 17% in the earlier cohort (P<0.01), suggesting improvement in early mortality. The improved outcomes were linked closely to use of one or more new agents in initial therapy. The current results confirm continued survival improvement in MM and highlight the impact of initial therapy with novel agents. Most importantly, we demonstrate that the improved survival is benefitting older patients and that early mortality in this disease has reduced considerably.
Keywords: multiple myeloma, survival, IMiDs, proteasome inhibitors
INTRODUCTION
The treatment paradigms and outcomes for patients with multiple myeloma (MM) have dramatically changed in the past decade with introduction of several new, more effective, and less toxic therapies and more than doubling of the survival. 1–3 Several studies toward the end of the last decade showed an improved survival compared to a nearly stagnant survival during the preceding three decades, where the treatment regimens primarily consisted of alkylating agents, anthracyclines and corticosteroids. 4, 5 During the past decade we have continued to make a remarkable progress in our understanding of the disease biology as well as development of newer therapies, as a result of which we have been able to develop better risk stratification models and risk adapted treatment approaches.6–18 It is not clear if the trend of improving survival seen in the earlier part of last decade has continued as a result of these more recent advances. Furthermore, the previously described improvements in survival was primarily restricted to the younger patients, with the older patients having derived less benefit from the advances, likely a reflection of lower utilization of stem cell transplantation and reduced access to clinical trials evaluating new drugs.5 As drugs are approved and become available outside of clinical trials, and treating physicians become more comfortable with using these new drugs, older patients are more likely to receive such agents. Finally, it is not clear if the prognostic factors identified in the era of older drugs are still of value in the current era with the new drugs with new methods of action. We designed the study with the specific goal of examining if the survival improvement witnessed in myeloma is a sustained phenomenon, particularly in the older patients, and to evaluate the commonly recognized risk factors in the context of the newer therapies.
PATIENTS and METHODS
The study included 1038 patients who were started on therapy for symptomatic multiple myeloma during a 10-year period between January 1, 2001 and December 31, 2010 and seen at Mayo Clinic within 30 days of their diagnosis of symptomatic disease. Patients who had an organ involvement with AL amyloidosis at the time of diagnosis were excluded from the current analysis. Data regarding these patients were extracted from prospectively maintained databases and review of medical records. Follow-up information on these patients are collected prospectively and entered at the time of each visit. For patients followed up at other institutions, annual follow-up letters are sent to patients to inquire regarding their disease status. All patients had consented to the use of their medical records and the study was conducted in accordance with the institutional guidelines with approval of the Institutional Review Board and in accordance with the principles of the Helsinki Declaration.
Fluorescent in-situ hybridization (FISH) results were considered for analysis only if it was performed within 6 months of diagnosis or prior to the diagnosis of symptomatic myeloma. Tests with insufficient plasma cells for adequate analysis were not included in the analysis. FISH analysis was performed as previously described using the following probes 3cen (D3Z1), 7cen (D7Z1), 9cen (D9Z1), 15cen (D15Z4), 11q13 (CCND1-XT), 14q32 (IGH-XT), 13q14 (RB1), 13q34 (LAMP1), 14q32 (5′IGH,3′IGH), 17p13.1 (p53), and 17cen (D17Z1).19 The specificity of the detection process is improved with immune-fluorescent detection of the cytoplasmic-immunoglobulin light-chain in the plasma cells as previously described (cIg-FISH). Patients were considered to have high risk disease if FISH studies demonstrated one of the following abnormalities: t(4;14), t(14;16), t(14;20), or loss of p53 gene locus (del 17p or monosomy 17) in the absence of any trisomies. Patients with any of the other abnormalities or a normal FISH were considered to have standard risk multiple myeloma as previously described.7 Plasma cell labeling index (PCLI; a measure of the plasma cell proliferation) was estimated using a slide-based immunofluorescence method on bone marrow samples, and expressed as the percentage of immunoglobulin positive cells that have taken up bromodeoxyuridine as previously described.20
Kaplan-Meier analysis was used for analyzing overall survival, and the differences between the groups were tested for statistical significance using the 2-tailed log-rank test.21 Survival curves were generated with all patients surviving beyond 6 years censored at that time. Survival estimates and the confidence intervals at different time points were estimated by using the Weibull method. Multivariate analysis of factors affecting survival was carried out using Cox proportional hazards model. Optimal cut points for continuous variables affecting early death were identified by examination of receiver operating characteristic (ROC) analyses. Fisher exact test was used to test differences in nominal variables. Differences in continuous variables between groups were compared using Mann-Whitney or Kruskal-Wallis tests.
RESULTS
The patients were diagnosed between 2001 and 2010, with a median of 106 patients included from each year (range 77 –128). The median age at diagnosis was 66 years (range, 22–93) and 59% were male. Overall, 540 (52%) of the patients were over 65 years and 197 (19%) were over 75 years of age. The median estimated follow up for the entire patient population was 5.9 years (95% CI; 5.5, 6.3) and 53% had died at the time of last follow up. The baseline clinical characteristics are provided in Table 1.
TABLE 1.
Baseline characteristics
| Characteristics | All patients (N=1038) | Group 1 (2001–2005; N=477) | Group 2 (2006–2010; N=561) |
|---|---|---|---|
| Age (years)* | 66 (50, 79) | 65 (50, 80) | 66 (50, 78) |
| Age > 65 | 52% | 50% | 54% |
| Age > 75 | 19% | 22% | 17% |
| Gender: Male | 59% | 60% | 58% |
| ISS Stage 1 | 30% | 35% | 26% |
| ISS Stage 2 | 39% | 36% | 42% |
| ISS Stage 3 | 31% | 29% | 32% |
| Serum creatinine (mg/dl)* | 1.1 (0.8, 2.3) | 1.2 (0.9, 2.5) | 1.0 (0.7, 2) |
| Serum creatinine > 2.0 mg/dL | 12% | 14% | 10% |
| Serum B2M (mg/dL)* | 3.9 (2, 11.4) | 3.8 (2, 11.7) | 3.9 (2.2, 10.7) |
| Serum LDH (IU/dL)* | 158 (110, 269) | 155 (107, 265) | 161 (112, 272) |
| Serum Calcium (mg/dL)* | 9.5 (8.5, 10.5) | 9.5 (8.4, 10.5) | 9.6 (8.6, 10.6) |
| Hemoglobin (g/dL)* | 10.8 (8.6, 13.6) | 10.7 (8.6, 13.3) | 10.9 (8.6, 13.8) |
| BMPC% | 50 (18, 80) | 50 (18, 80) | 50 (15, 84) |
| IgG (g/dL)* | 2.0 (0.3, 6.7) | 2.0 (0.3, 6.2) | 2.0 (0.3, 6.8) |
| IgA (mg/dL)* | 51 (11, 3200) | 51 (12, 3400) | 52 (10, 2900) |
| Kappa: Lambda | 66:34 | 65:35 | 67:33 |
| Light chain MM | 17% | 17% | 17% |
| High Risk MM# | 12% | 12% | 12% |
Represent median (10th percentile, 90th percentile)
defined as presence of (t(4;14), t(14;16), t(16;20), or del 17p in the absence of any trisomy
Survival outcomes
The median overall survival from diagnosis for the entire cohort was 5.2 years (95% CI; 4.8, 5.8); the six-year overall survival estimate was 45% (95% CI; 42, 48). The median overall survival of the patients in the more recent group (n=561) was significantly longer compared with the earlier cohort (n=477); 6.1 years (95% CI; 5.0, NR) and 4.6 years (95% CI; 4.1, 5.2), P = 0.002 (Figure 1A). The 6-year overall survival estimates for the earlier cohort was significantly shorter compared with the recent cohorts and were 40% (95% CI; 36, 44) and 51% (95% CI; 46, 56) respectively; P < 0.001. We also examined the trend along the years using 2-year intervals to examine the consistency in the improvements and as shown in figure 1B; there has been a consistent and steady improvement in survival over the time period studied. Given the limited improvement in survival seen among the older patients in the previous studies4, 5, we examined if the improved survival was limited to any age group. Notably, there was no survival improvement between the two time periods for patients 65 years and under. The median OS was not reached for either time period among those 65 years and under (Figure 1C; P=NS). In contrast, among patients older than 65 years, the OS of the recent cohort was significantly longer with median of 5 years (95% CI; 4.1, NR) compared with 3.2 years (95% CI; 2.4, 3.8) for the earlier cohort, Figure 1D. We then specifically examined if within the group of patients over 65 years, improved outcomes were noted in the very old (i.e. over 75 years of age) patients as well. Improved survival was seen among patients up to 75 years and those over 75 years of age as well (Supplementary Figures s1A, s1B).
Figure 1.
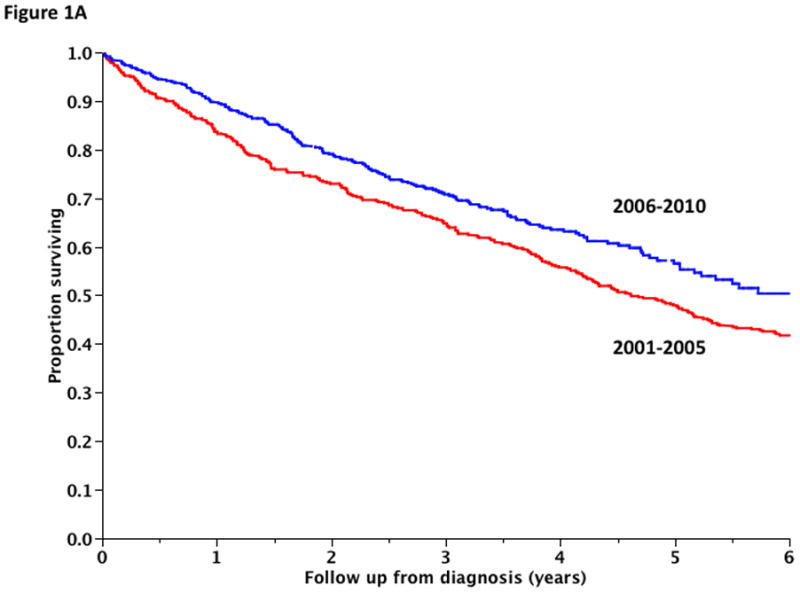
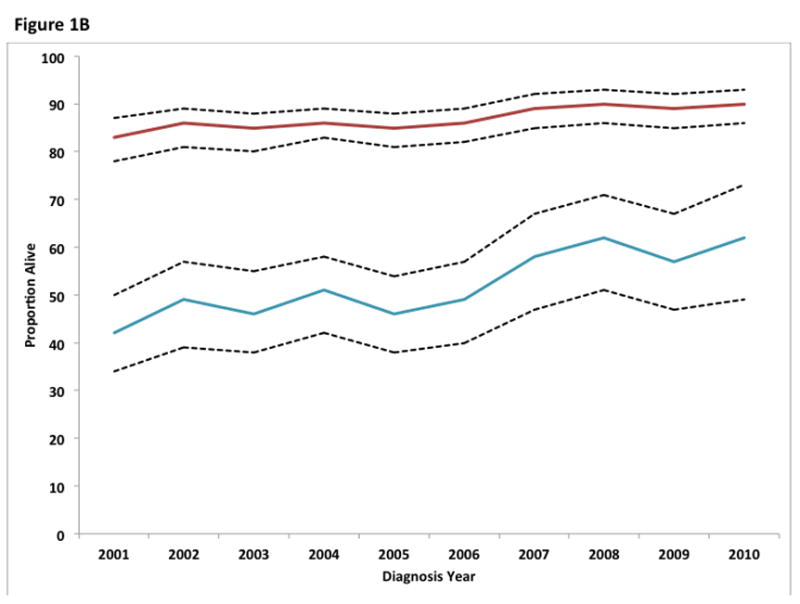
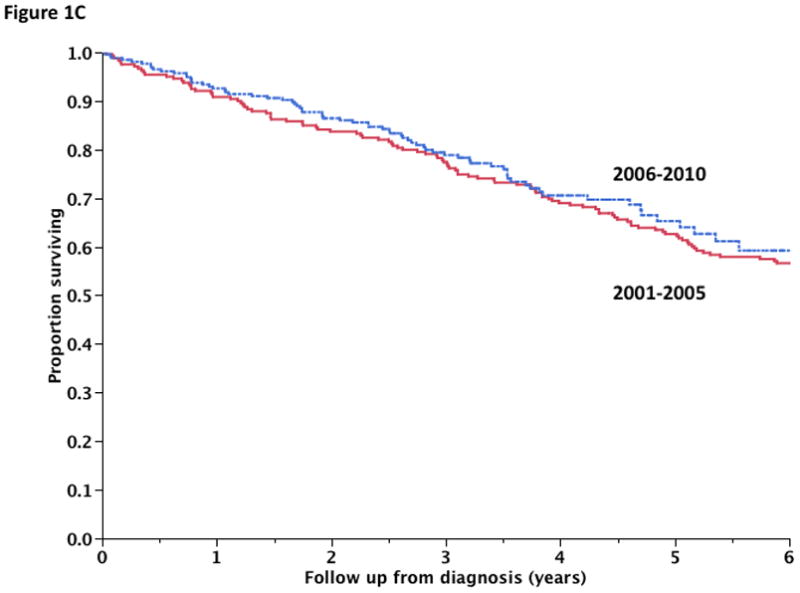
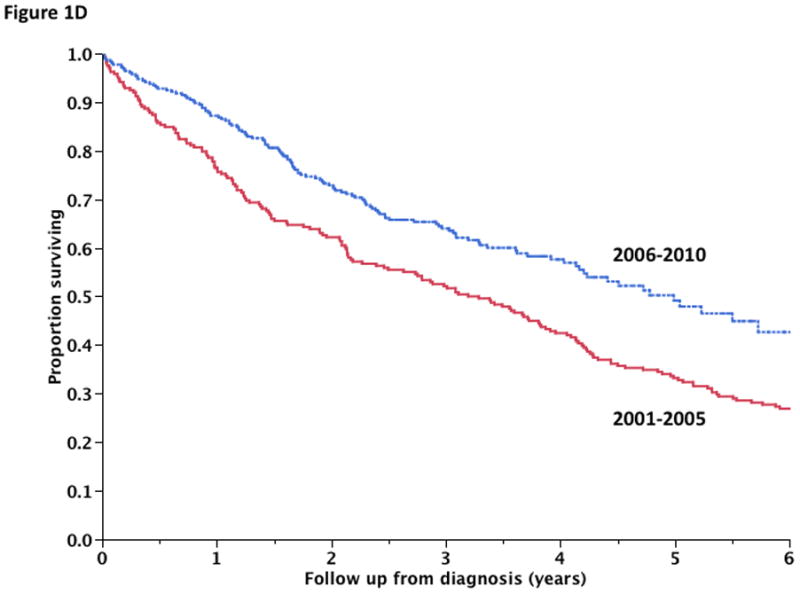
Panel A shows the overall survival comparison between patients diagnosed during January 2001– December 2005 and those diagnosed during January 2006 and December 2010. Panel B shows the trends in the 1 and 5 year overall survival estimates between January 2001 and December 2010 with patients grouped by the year of diagnosis. The dotted lines represent the 95% confidence intervals. Panel C shows the overall survival comparison between patients diagnosed during 2001– 2005 and those diagnosed during 2006–2010 limited to patients 65 years or younger. Panel D shows the overall survival comparison between patients diagnosed during 2001– 2005 and those diagnosed during 2006–2010 limited to patients older than 65 years.
Initial therapy and use of stem cell transplantation
We then examined the impact of novel agents used as part of initial therapy on survival outcomes. The initial treatment regimen contained one or more of the novel drugs (thalidomide, lenalidomide or bortezomib) in 621 (60%) of the patients; a regimen incorporating two novel agents was used in 36 patients (3.5%). Lenalidomide dexamethasone was the most common induction regimen overall with 345 (33%) patients receiving this regimen. The most common non-novel agent regimen used was single agent dexamethasone, with 249 patients receiving this regimen (24%) followed by melphalan and prednisone in 120 patients (12%). The distribution of the most commonly used initial regimens is shown in Table 2. As expected, significantly higher proportion of patients treated in the more recent group had received a novel agent as part of the initial therapy compared with the earlier group (89% vs. 29%; P < 0.001). The median OS for patients receiving at least one novel agent as part of the initial therapy was not reached (95% CI; 5.4, NR) compared with 3.8 years (95% CI; 3.2, 4.5) for those not receiving a novel agent as part of initial therapy; P < 0.001 (Figure 2A). We then performed a multivariable analysis including the diagnosis period and use of novel agents, and only the use of novel agents was associated with improved survival, suggesting that the improved survival in the recent years is mostly related to the increased use of novel agents as part of initial therapy.
Table 2.
Commonly used initial therapy regimens and frequency
| Regimen | 2001–2005 | 2006–2010 |
|---|---|---|
| VAD | 2% | (1 patient) |
| Dexamethasone | 45% | 6% |
| Melphalan-Prednisone | 21% | 3% |
| Thalidomide-Dexamethasone | 16% | 3% |
| Other thalidomide-based regimen | 0% | 3% |
| Lenalidomide-Dexamethasone | 11% | 52% |
| Other lenalidomide-based regimen | 0% | 10% |
| Bortezomib-Dexamethasone | 1% | 7% |
| Other bortezomib-based regimen | 0% | 5% |
| VTD | 0% | 2% |
| VRD | 0% | 4% |
Abbreviations: VAD Vincristine, Adriamycin and Dexamethasone; VTD Bortezomib (Velcade), Thalidomide and Dexamethasone; VRD Bortezomib (Velcade), Lenalidomide (Revlimid) and Dexamethasone
Figure 2.


Panel A shows the overall survival comparison between patients receiving one of the newer drugs (thalidomide, lenalidomide or bortezomib) as part of initial therapy and patients not receiving one of these regimens. Panel B shows the survival comparison between patients receiving an autologous stem cell transplantation versus those did not; with land marking at 6 months. Panels C and D demonstrates the survival comparison between patients receiving a stem cell transplant versus those who have not received a stem cell transplant among those 65 years or younger (Panel C) and those over 65 years (Panel D). Panel E shows the increasing risk of early mortality (1 year mortality) with increasing number of risk factors (identified age >70, serum albumin < 3.5 gm/dL, and serum beta 2 microglobulin > 6.5 mg/dL)
Among the entire cohort, 393 patients (37%) received an autologous stem cell transplant at some point during the disease course, with the median time to transplantation of 5.9 months (range 2 –95). Among patients 65 or younger 277/498 (56%) of patients have undergone an ASCT at the time of last follow up. We did a 6- month landmark analysis to examine the impact of ASCT on overall survival. The median OS for patients receiving an SCT was not reached compared with 4.9 years (95% CI; 4.2, 5.3) for those not receiving an SCT, P < 0.001 (Figure 2B). Restricting the analysis to those 65 or younger, the OS was identical for those who have received a SCT so far compared with those who have not yet had a transplant, median not reached for either group (Figure 2C). Among the patients over 65 years 116 (21%) underwent a SCT; the median OS for those undergoing SCT was NR (95% CI; 5.4, NR) compared with 3.1 years (95% CI; 2.5, 3.7) for those who did not, P <0.01 (Figure 2D).
Early mortality
Overall, 136 (13%) of the patients died within 1 year of diagnosis with the one-year mortality being significantly lower for the recent group 10% vs. 16% for the older cohort (P = 0.004). The early mortality was significantly lower among the patients who had received one of the newer drugs as part of their initial therapy (8% vs. 19%; P < 0.001). We then examined the factors associated with an early mortality, restricting our analysis to those patients who received a newer agent as part of their initial therapy, as that represents the current practice. ROC curves were generated for the continuous variables to identify the optimal cut point, and the values were rounded for convenience and ease of use. We identified age > 70 years, platelet count < 200 × 106/dL, serum creatinine of > 1.5 mg/dl, serum albumin < 3.5 gm/dL, serum beta 2 microglobulin > 6.5 mg/dL, and LDH > 180 IU/dl as factors associated with early mortality. We first examined all the variables in a multivariable model, and identified age >70, serum albumin < 3.5 gm/dL, and serum beta 2 microglobulin > 6.5 mg/dL as factors independently predicting early mortality. Presence of none, one, two or three factors respectively was associated with a 3%, 5%, 9% or 53% risk of early mortality; P<0.001 (Figure 2E).
Prognostic factors for survival
We then examined the value of previously identified prognostic factors, many of which were identified in the context of older therapies, in this recent cohort of patients. Specifically we examined how the prognostic factors may have changed across the two time periods. We first examined the prognostic value of ISS staging among 916 patients in whom the data was available; the median OS was not reached, 5.7 years and 2.1 years for stages 1, and 2 and 3 in the earlier time period (Figure 3A) compared with NR, NR and was 4.2 years respectively during the second time period (Figure 3B). FISH data from around diagnosis was available for only 50 (10%) patients from the first time period compared with 385 (69%) patients from the more recent time period. The median OS for patients with high-risk FISH (defined as presence of (t(4;14), t(14;16), t(16;20), or del 17p in the absence of any trisomy) or standard-risk FISH were 2.3 years and NR respectively for the earlier time period (P=0.05; Figure 3C) and were 3.5 and NR respectively in the latter time period (P<0.001; Figure 3D). We also examined the prognostic value of FISH based risk status using the traditional definition of high risk FISH, not taking into consideration the overlapping abnormality of trisomies (defined as presence of (t(4;14), t(14;16), t(16;20), or del 17p). The median OS for patients with high-risk FISH or standard-risk FISH were 2.4 years and NR respectively for the earlier time period (P=0.01; Supplementary Figure s2A) and were 5.1 and NR respectively in the latter time period (P=0.046; Supplementary Figure s2B). Next we examined the prognostic value of LDH using a cutoff of 222 IU/dL (upper limit of normal for the laboratory). The median OS for patients with LDH >222 IU/dL and <=222 IU/dL were 1.8 and 5.1 years respectively for the earlier time period (Supplementary Figure s2C) and were 3.0 and NR respectively in the latter time period; P<0.001 for both comparisons (Supplementary Figure s2D). Given the important prognostic value of proliferation in myeloma that has been observed with different methods of assessing proliferation across different studies, we examined the prognostic value of plasma cell labeling index and how it has changed over time. Using the traditional cutoff of 1% for the PCLI, the median OS for patients with PCLI >= 1% and <1% were 3.1 years and 5.3 years respectively for the earlier time period (P<0.001; Supplementary Figure s3A) and were 5.5 years and NR respectively in the latter time period; (P=NS; Supplementary Figure s3B). However, using a higher cutoff of 3%, the median OS for patients with PCLI >= 3% and <3% were 3.1 years and 5.1 years respectively for the earlier time period (P=0.005; Supplementary Figure s3C) and were 3.8 years and NR respectively in the latter time period; (P=0.001; Supplementary Figure s3D). The relative risks associated with the different prognostic factors during the two time periods are as shown in Table 3.
Figure 3.


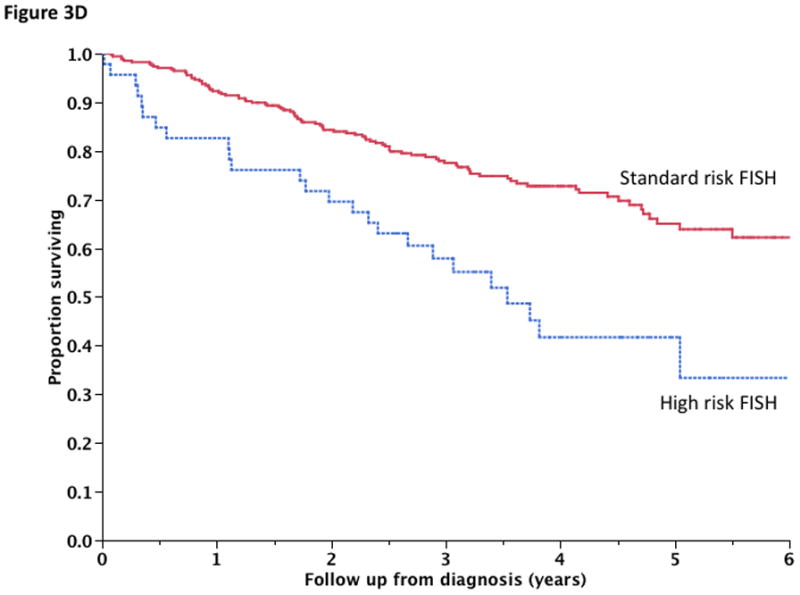
Panel A and B shows the survival according to the International Staging System (ISS) among patients diagnosed during 2001–2005 (Panel A) and those diagnosed later (Panel B). Panel C and D shows the survival according to the FISH based risk status among patients diagnosed during 2001–2005 (Panel C) and those diagnosed later (Panel D).
Table 3.
Impact of various prognostic factors on survival during the two time periods
| Prognostic variable | 2001–2005 | 2006–2010 | ||
|---|---|---|---|---|
| Relative risk | P | Relative risk | P | |
| Age (> 65 years) | 2.2 (1.8, 2.8) | <0.001 | 1.8 (1.3, 2.4) | <0.001 |
| Serum creatinine (> 2.0 mg/dL) | 1.5 (1.1, 2.0) | 0.008 | 2.2 (1.4, 3.1) | <0.001 |
| ISS | ||||
| Stage 2 (vs. Stage 1) | 0.97 (0.7, 1.3) | 0.8 | 1.4 (0.9, 2.2) | 0.08 |
| Stage 3 (vs. Stage 1) | 1.7 (1.3, 2.2) | <0.001 | 2.7 (1.8, 4.1) | <0.001 |
| Serum Calcium (>11.5 mg/dL) | 2.1 (1.2, 3.4) | 0.008 | 3.0 (1.4, 5.7) | 0.01 |
| LDH (> 222 IU/dL) | 2.0 (1.4, 2.7) | <0.001 | 2.7 (1.8, 3.8) | <0.001 |
| High Risk FISH* | 2.4 (0.8, 5.8) | NS | 2.3 (1.5, 3.5) | <0.001 |
| High Risk FISH# | 2.8 (1.1, 6.3) | 0.04 | 1.5 (0.99, 2.2) | 0.05 |
| PCLI > 1% | 1.5 (1.2, 1.9) | <0.01 | 1.2 (0.9, 1.7) | NS |
| PCLI > 3% | 1.5 (1.01, 2.2) | 0.04 | 2.0 (1.3, 2.9) | 0.002 |
defined as presence of (t(4;14), t(14;16), t(16;20), or del 17p in the absence of any trisomy
defined as presence of (t(4;14), t(14;16), t(16;20), or del 17p (traditional definition, no reference to trisomy)
DISCUSSION
The past few years has witnessed continuing advances in the understanding of the myeloma biology, especially the ability to identify patients with high risk disease based on a variety of techniques such as FISH analysis and gene expression profiling techniques in addition to the traditionally recognized risk factors.1, 6–10, 22 This improved understanding has been coupled with addition of new therapies, primarily new agents belonging to the IMiD and proteasome inhibitor classes of drugs.11–18 These improvements have in turn led to better understanding of the differential impact of specific drugs in patients with specific high-risk features such as the use of bortezomib for patients with high-risk translocations and 17p deletion.23, 24 The current analysis provides evidence supporting continued improvement in the survival outcomes within the past decade with those patients identified in the second half enjoying longer survival, and confirms the continuation of the trend we started seeing in the early part of last decade. What is striking, and very encouraging, is the significant improvement seen among the older patients, a group that was left behind in the early period of improved outcomes. This is likely a reflection of the increased use of the newer drugs among the older patients, as is suggested by the significantly higher proportion of patients in the second half receiving a regimen that contained one of the newer drugs. These results are in concordance with the phase 3 trials that demonstrated improved survival for patients over 65 with the addition of thalidomide or bortezomib to melphalan and prednisone.25–29 From the current analysis, the dominant driving factor behind the observed improvement appears to be the increased use of the novel agents in the more recent period. However, the lack of a further improvement in survival among the younger patients highlights the need for continued innovation in the treatment approaches, both in terms of introduction of novel drugs with different mechanisms of action compared to the IMiDs and the proteasome inhibitors. The newer derivatives of the IMiD family (pomalidomide) and the next generation proteasome inhibitors (carfilzomib), which have been shown to improve survival among patients who have become refractory to the previous generation of drugs, the improvements have been incremental and limited to a small proportion of patients.17, 18 A substantial proportion of patients eligible for SCT have received one in this current cohort. While the survival of patients undergoing an SCT is better, as would be expected from the selection bias inherent in being eligible for SCT, two aspects needs to be highlighted. Among the group of patients 65 or younger, the OS was similar between those who had a transplant and those who still have not had one. This reflects our standard approach of collecting stem cells in all eligible patients and giving the patients the option of an early transplant or a delayed one at relapse, given the equivalent results with either approach. This result is consistent with our previous reports.30 The improved survival among those over 65 years who had undergone SCT reflects the improved outcomes among those with better performance status and lack of significant comorbidities, as they are likely to be considered for a transplant. It also highlights the feasibility and safety of this approach among selected older patients.31, 32
Another aspect of the current results that is clearly encouraging is the significant decrease in the early mortality (death within 1 year of diagnosis) in myeloma.33, 34 The population included in the current study gives a better real-world view of the changes in the early mortality as we included only patients who were seen within 30 days of diagnosis. Even with this criteria, the actual proportion of patients dying early after diagnosis is likely to be higher as many critically sick patients are unlikely to get to a tertiary referral center in a timely fashion. This has to be compared and contrasted with the early mortality figures that have been reported from the phase 3 trials performed during the last decade. While confirming the trend that we are observing here, the figures from phase 3 trials are substantially lower highlighting the skewed nature of patients who are eligible for enrolment in clinical trials. Using the current set of patients, we were able to identify specific factors that increased the risk of early mortality, which in turn can help us develop specific therapeutic approaches in the context of well designed clinical trials for these high risk patients. Similar findings were seen in a French study, albeit in a transplant eligible patient population.34 It is quite likely that the low albumin, elevated B2M, and age over 70 years reflect the presence of comorbidities that can result in decreased ability to treat the disease in an effective manner compared to the rest of the patients and increase risk of toxicities with the regimens currently used.
The changes in the treatment approaches and the specific mechanisms of the drugs utilized can clearly affect different aspects of the biology in unique ways. So we examined the various prognostic factors that have been described over time to see if they are still applicable in the era of newer therapies and improved overall survival.7, 22, 35–37 Interestingly, nearly all the prognostic factors continue to identify patients with worse outcomes, with FISH based high-risk stratification remaining a powerful tool for clinical use. One striking finding was the complete lack of prognostic value for the plasma cell labeling index in the newer cohort using the traditional cut off of 1%, a finding we had previously reported in the context of IMiD based therapies.38, 39 However, using a higher cut off of 3% still appear to identify patients with poor outcomes, and this is likely a reflection of the ability of the newer drugs to abrogate some of the mechanisms of poor prognosis associated with high proliferative rate. It is possible that the inherent lack of sensitivity of this slide based test may not allow adequate discrimination between those with groups with high and low proliferation and a different methodology with more sensitivity and or specificity may still have clinical utility.20 To this end, the slide-based method is not longer being used at our institution and we have shifted to a flow base method that determines the proportion of cells in the S-phase. This is particularly relevant, as proliferation signatures have been commonly identified as a poor prognostic factor in gene expression based studies in myeloma.40
In conclusion, the current results indicate continued improvement in the survival of patients with myeloma, reflecting the impact of improved therapies. It is particularly encouraging to note the improved outcomes in the elderly patients, and the decrease in the early mortality, both of which likely reflect the use of new drugs that can be administered with less toxicity and achieve a more rapid control of disease at the outset. Finally, identification of high risk characteristics at diagnosis, especially, cytogenetic abnormalities, will allow us to direct our efforts towards the patients currently doing poorly, so that progress can continue to be made.
Supplementary Material
Shows the overall survival comparison between patients diagnosed during 2001– 2005 and those diagnosed during 2006–2010 limited to patients 65 –75 years (Panel A) and >75 years (Panel B).
Panel A and B shows the survival according to the FISH based risk status among patients diagnosed during 2001–2005, high risk being defined as presence of (t(4;14), t(14;16), t(16;20), or del 17p (traditional definition, no reference to trisomy) (Panel A) and those diagnosed later (Panel B). Panel A and B shows the survival according to the LDH (LDH > 222 IU/dL) among patients diagnosed during 2001–2005 (Panel C) and those diagnosed later (Panel D).
Panel A and B shows the survival according to plasma cell labeling index (PCLI >= 1%) based risk status among patients diagnosed during 2001–2005 (Panel A) and those diagnosed later (Panel B). Panel C and D shows the survival according to plasma cell labeling index (PCLI >= 3%) based risk status among patients diagnosed during 2001–2005 (Panel C) and those diagnosed later (Panel D).
Acknowledgments
FUNDING SUPPORT: Supported in part by the Mayo Clinic Hematological Malignancies Program and Paul Calabresi K12 Award (GrantNo. CA90628), by Grants CA168762, CA07476, CA62242, CA100707, and CA83724 from the National Cancer Institute, and by the Jabbs Foundation and the Henry J. Predolin Foundation
Footnotes
AUTHOR CONTRIBUTIONS
SKK was involved in design of concept, data collection, analysis, and writing the paper, AD, MQL, SRH, SRZ, FKB, NL, RAK, SVR, SP, PK, DD, SJR, JL, AM and MAG were involved in writing the manuscript.
DISCLOSURES
No disclosures relevant to the current manuscript
Supplementary information is available at leukemia’s website
References
- 1.Mikhael JR, Dingli D, Roy V, Reeder CB, Buadi FK, Hayman SR, et al. Management of Newly Diagnosed Symptomatic Multiple Myeloma: Updated Mayo Stratification of Myeloma and Risk-Adapted Therapy (mSMART) Consensus Guidelines 2013. Mayo Clin Proc. 2013 Apr;88(4):360–376. doi: 10.1016/j.mayocp.2013.01.019. [DOI] [PubMed] [Google Scholar]
- 2.Anderson KC. The 39th David A. Karnofsky Lecture: bench-to-bedside translation of targeted therapies in multiple myeloma. J Clin Oncol. 2012 Feb 1;30(4):445–452. doi: 10.1200/JCO.2011.37.8919. [DOI] [PMC free article] [PubMed] [Google Scholar]
- 3.Kyle RA. Targeted therapy of multiple myeloma. Hematology. 2012 Apr;17(Suppl 1):S125–128. doi: 10.1179/102453312X13336169156339. [DOI] [PubMed] [Google Scholar]
- 4.Kumar SK, Rajkumar SV, Dispenzieri A, Lacy MQ, Hayman SR, Buadi FK, et al. Improved survival in multiple myeloma and the impact of novel therapies. Blood. 2008 Mar 1;111(5):2516–2520. doi: 10.1182/blood-2007-10-116129. [DOI] [PMC free article] [PubMed] [Google Scholar]
- 5.Brenner H, Gondos A, Pulte D. Recent major improvement in long-term survival of younger patients with multiple myeloma. Blood. 2008 Mar 1;111(5):2521–2526. doi: 10.1182/blood-2007-08-104984. [DOI] [PubMed] [Google Scholar]
- 6.Avet-Loiseau H, Durie BG, Cavo M, Attal M, Gutierrez N, Haessler J, et al. Combining fluorescent in situ hybridization data with ISS staging improves risk assessment in myeloma: an International Myeloma Working Group collaborative project. Leukemia. 2013 Mar;27(3):711–717. doi: 10.1038/leu.2012.282. [DOI] [PMC free article] [PubMed] [Google Scholar]
- 7.Kumar S, Fonseca R, Ketterling RP, Dispenzieri A, Lacy MQ, Gertz MA, et al. Trisomies in multiple myeloma: impact on survival in patients with high-risk cytogenetics. Blood. 2012 Mar 1;119(9):2100–2105. doi: 10.1182/blood-2011-11-390658. [DOI] [PMC free article] [PubMed] [Google Scholar]
- 8.Kuiper R, Broyl A, de Knegt Y, van Vliet MH, van Beers EH, van der Holt B, et al. A gene expression signature for high-risk multiple myeloma. Leukemia. 2012 Nov;26(11):2406–2413. doi: 10.1038/leu.2012.127. [DOI] [PubMed] [Google Scholar]
- 9.Zhan F, Barlogie B, Mulligan G, Shaughnessy JD, Jr, Bryant B. High-risk myeloma: a gene expression based risk-stratification model for newly diagnosed multiple myeloma treated with high-dose therapy is predictive of outcome in relapsed disease treated with single-agent bortezomib or high-dose dexamethasone. Blood. 2008 Jan 15;111(2):968–969. doi: 10.1182/blood-2007-10-119321. [DOI] [PMC free article] [PubMed] [Google Scholar]
- 10.Decaux O, Lode L, Magrangeas F, Charbonnel C, Gouraud W, Jezequel P, et al. Prediction of survival in multiple myeloma based on gene expression profiles reveals cell cycle and chromosomal instability signatures in high-risk patients and hyperdiploid signatures in low-risk patients: a study of the Intergroupe Francophone du Myelome. J Clin Oncol. 2008 Oct 10;26(29):4798–4805. doi: 10.1200/JCO.2007.13.8545. [DOI] [PubMed] [Google Scholar]
- 11.Richardson PG, Barlogie B, Berenson J, Singhal S, Jagannath S, Irwin D, et al. A phase 2 study of bortezomib in relapsed, refractory myeloma. N Engl J Med. 2003;348:2609–2617. doi: 10.1056/NEJMoa030288. [DOI] [PubMed] [Google Scholar]
- 12.Richardson PG, Sonneveld P, Schuster MW, Irwin D, Stadtmauer EA, Facon T, et al. Bortezomib or high-dose dexamethasone for relapsed multiple myeloma. New England Journal of Medicine. 2005;352(24):2487–2498. doi: 10.1056/NEJMoa043445. [DOI] [PubMed] [Google Scholar]
- 13.Weber DM, Chen C, Niesvizky R, Wang M, Belch A, Stadtmauer EA, et al. Lenalidomide plus dexamethasone for relapsed multiple myeloma in North America. N Engl J Med. 2007 Nov 22;357(21):2133–2142. doi: 10.1056/NEJMoa070596. [DOI] [PubMed] [Google Scholar]
- 14.Dimopoulos M, Spencer A, Attal M, Prince HM, Harousseau JL, Dmoszynska A, et al. Lenalidomide plus dexamethasone for relapsed or refractory multiple myeloma. N Engl J Med. 2007 Nov 22;357(21):2123–2132. doi: 10.1056/NEJMoa070594. [DOI] [PubMed] [Google Scholar]
- 15.Rajkumar SV, Blood E, Vesole D, Fonseca R, Greipp PR Eastern Cooperative Oncology G. Phase III clinical trial of thalidomide plus dexamethasone compared with dexamethasone alone in newly diagnosed multiple myeloma: a clinical trial coordinated by the Eastern Cooperative Oncology Group. J Clin Oncol. 2006 Jan 20;24(3):431–436. doi: 10.1200/JCO.2005.03.0221. [DOI] [PubMed] [Google Scholar]
- 16.Weber D, Rankin K, Gavino M, Delasalle K, Alexanian R. Thalidomide alone or with dexamethasone for previously untreated multiple myeloma. J Clin Oncol. 2003 Jan 1;21(1):16–19. doi: 10.1200/JCO.2003.03.139. [DOI] [PubMed] [Google Scholar]
- 17.Siegel DS, Martin T, Wang M, Vij R, Jakubowiak AJ, Lonial S, et al. A phase 2 study of single-agent carfilzomib (PX-171-003-A1) in patients with relapsed and refractory multiple myeloma. Blood. 2012 Jul 25; doi: 10.1182/blood-2012-05-425934. [DOI] [PMC free article] [PubMed] [Google Scholar]
- 18.Miguel JS, Weisel K, Moreau P, Lacy M, Song K, Delforge M, et al. Pomalidomide plus low-dose dexamethasone versus high-dose dexamethasone alone for patients with relapsed and refractory multiple myeloma (MM-003): a randomised, open-label, phase 3 trial. Lancet Oncol. 2013 Sep 2; doi: 10.1016/S1470-2045(13)70380-2. [DOI] [PubMed] [Google Scholar]
- 19.Fonseca R, Blood E, Rue M, Harrington D, Oken MM, Kyle RA, et al. Clinical and biologic implications of recurrent genomic aberrations in myeloma. Blood. 2003 Jun 1;101(11):4569–4575. doi: 10.1182/blood-2002-10-3017. [DOI] [PubMed] [Google Scholar]
- 20.Greipp PR, Kumar S. Plasma cell labeling index. Methods Mol Med. 2005;113:25–35. doi: 10.1385/1-59259-916-8:25. [DOI] [PubMed] [Google Scholar]
- 21.Kaplan E, Meier P. Nonparametric estimation from incomplete observations. J Am Stat Assoc. 1958;53:457–481. [Google Scholar]
- 22.Avet-Loiseau H, Attal M, Moreau P, Charbonnel C, Garban F, Hulin C, et al. Genetic abnormalities and survival in multiple myeloma: the experience of the Intergroupe Francophone du Myelome. Blood. 2007 Apr 15;109(8):3489–3495. doi: 10.1182/blood-2006-08-040410. [DOI] [PubMed] [Google Scholar]
- 23.Jagannath S, Richardson PG, Sonneveld P, Schuster MW, Irwin D, Stadtmauer EA, et al. Bortezomib appears to overcome the poor prognosis conferred by chromosome 13 deletion in phase 2 and 3 trials. Leukemia. 2007 Jan;21(1):151–157. doi: 10.1038/sj.leu.2404442. [DOI] [PubMed] [Google Scholar]
- 24.Neben K, Lokhorst HM, Jauch A, Bertsch U, Hielscher T, van der Holt B, et al. Administration of bortezomib before and after autologous stem cell transplantation improves outcome in multiple myeloma patients with deletion 17p. Blood. 2012 Jan 26;119(4):940–948. doi: 10.1182/blood-2011-09-379164. [DOI] [PubMed] [Google Scholar]
- 25.Wijermans P, Schaafsma M, Termorshuizen F, Ammerlaan R, Wittebol S, Sinnige H, et al. Phase III study of the value of thalidomide added to melphalan plus prednisone in elderly patients with newly diagnosed multiple myeloma: the HOVON 49 Study. Journal of clinical oncology: official journal of the American Society of Clinical Oncology. 2010 Jul 1;28(19):3160–3166. doi: 10.1200/JCO.2009.26.1610. [DOI] [PubMed] [Google Scholar]
- 26.Hulin C, Facon T, Rodon P, Pegourie B, Benboubker L, Doyen C, et al. Efficacy of Melphalan and Prednisone Plus Thalidomide in Patients Older Than 75 Years With Newly Diagnosed Multiple Myeloma: IFM 01/01 Trial. J Clin Oncol. 2009 May 18; doi: 10.1200/JCO.2008.21.0948. [DOI] [PubMed] [Google Scholar]
- 27.Facon T, Mary JY, Hulin C, Benboubker L, Attal M, Pegourie B, et al. Melphalan and prednisone plus thalidomide versus melphalan and prednisone alone or reduced-intensity autologous stem cell transplantation in elderly patients with multiple myeloma (IFM 99-06): a randomised trial. Lancet. 2007 Oct 6;370(9594):1209–1218. doi: 10.1016/S0140-6736(07)61537-2. [DOI] [PubMed] [Google Scholar]
- 28.Palumbo A, Bringhen S, Caravita T, Merla E, Capparella V, Callea V, et al. Oral melphalan and prednisone chemotherapy plus thalidomide compared with melphalan and prednisone alone in elderly patients with multiple myeloma: randomised controlled trial. Lancet. 2006 Mar 11;367(9513):825–831. doi: 10.1016/S0140-6736(06)68338-4. [DOI] [PubMed] [Google Scholar]
- 29.San Miguel JF, Schlag R, Khuageva NK, Dimopoulos MA, Shpilberg O, Kropff M, et al. Bortezomib plus melphalan and prednisone for initial treatment of multiple myeloma. N Engl J Med. 2008 Aug 28;359(9):906–917. doi: 10.1056/NEJMoa0801479. [DOI] [PubMed] [Google Scholar]
- 30.Kumar SK, Lacy MQ, Dispenzieri A, Buadi FK, Hayman SR, Dingli D, et al. Early versus delayed autologous transplantation after immunomodulatory agents-based induction therapy in patients with newly diagnosed multiple myeloma. Cancer. 2012 Mar 15;118(6):1585–1592. doi: 10.1002/cncr.26422. [DOI] [PMC free article] [PubMed] [Google Scholar]
- 31.Kumar SK, Dingli D, Lacy MQ, Dispenzieri A, Hayman SR, Buadi FK, et al. Autologous stem cell transplantation in patients of 70 years and older with multiple myeloma: Results from a matched pair analysis. Am J Hematol. 2008 Aug;83(8):614–617. doi: 10.1002/ajh.21191. [DOI] [PubMed] [Google Scholar]
- 32.Sirohi B, Powles R, Treleaven J, Mainwaring P, Kulkarni S, Pandha H, et al. The role of autologous transplantation in patients with multiple myeloma aged 65 years and over. Bone Marrow Transplant. 2000 Mar;25(5):533–539. doi: 10.1038/sj.bmt.1702188. [DOI] [PubMed] [Google Scholar]
- 33.Augustson BM, Begum G, Dunn JA, Barth NJ, Davies F, Morgan G, et al. Early mortality after diagnosis of multiple myeloma: analysis of patients entered onto the United kingdom Medical Research Council trials between 1980 and 2002--Medical Research Council Adult Leukaemia Working Party. Journal of clinical oncology. 2005 Dec 20;23(36):9219–9226. doi: 10.1200/JCO.2005.03.2086. [DOI] [PubMed] [Google Scholar]
- 34.Moreau P, Planche L, Attal M, Hulin C, Facon T, Caillot D, et al. The Combination of ISS 3, High LDH and t(4;14) and/or Del(17p) Identify a Simple Prognostic Index for Overall Survival in Patients Treated with Novel Agents-Based Induction Therapy and Front-Line Autologous Stem Cell Transplantation, and Allow the Definition of a Subgroup of Patients At High-Risk of Early Death From Progressive Disease. ASH Annual Meeting Abstracts. 2012 Nov 16;120(21):598. [Google Scholar]
- 35.Greipp PR, San Miguel J, Durie BG, Crowley JJ, Barlogie B, Blade J, et al. International staging system for multiple myeloma. J Clin Oncol. 2005 May 20;23 (15):3412–3420. doi: 10.1200/JCO.2005.04.242. [DOI] [PubMed] [Google Scholar]
- 36.Dimopoulos MA, Barlogie B, Smith TL, Alexanian R. High Serum Lactate Dehydrogenase Level as a Marker for Drug Resistance and Short Survival in Multiple Myeloma. Annals of Internal Medicine. 1991;115(12):931–935. doi: 10.7326/0003-4819-115-12-931. [DOI] [PubMed] [Google Scholar]
- 37.Terpos E, Katodritou E, Roussou M, Pouli A, Michalis E, Delimpasi S, et al. High serum lactate dehydrogenase adds prognostic value to the international myeloma staging system even in the era of novel agents. Eur J Haematol. 2010 Aug;85(2):114–119. doi: 10.1111/j.1600-0609.2010.01466.x. [DOI] [PubMed] [Google Scholar]
- 38.Greipp PR, Lust JA, O’Fallon WM, Katzmann JA, Witzig TE, Kyle RA. Plasma cell labeling index and beta 2-microglobulin predict survival independent of thymidine kinase and C-reactive protein in multiple myeloma. Blood. 1993 Jun 15;81(12):3382–3387. [PubMed] [Google Scholar]
- 39.Kapoor P, Kumar S, Mandrekar SJ, Laumann KM, Dispenzieri A, Lacy MQ, et al. Efficacy of thalidomide- or lenalidomide-based therapy in proliferative multiple myeloma. Leukemia: official journal of the Leukemia Society of America, Leukemia Research Fund, UK. 2011 Apr 5; doi: 10.1038/leu.2011.54. [DOI] [PubMed] [Google Scholar]
- 40.Hose D, Reme T, Hielscher T, Moreaux J, Messner T, Seckinger A, et al. Proliferation is a central independent prognostic factor and target for personalized and risk-adapted treatment in multiple myeloma. Haematologica. 2011 Jan;96(1):87–95. doi: 10.3324/haematol.2010.030296. [DOI] [PMC free article] [PubMed] [Google Scholar]
Associated Data
This section collects any data citations, data availability statements, or supplementary materials included in this article.
Supplementary Materials
Shows the overall survival comparison between patients diagnosed during 2001– 2005 and those diagnosed during 2006–2010 limited to patients 65 –75 years (Panel A) and >75 years (Panel B).
Panel A and B shows the survival according to the FISH based risk status among patients diagnosed during 2001–2005, high risk being defined as presence of (t(4;14), t(14;16), t(16;20), or del 17p (traditional definition, no reference to trisomy) (Panel A) and those diagnosed later (Panel B). Panel A and B shows the survival according to the LDH (LDH > 222 IU/dL) among patients diagnosed during 2001–2005 (Panel C) and those diagnosed later (Panel D).
Panel A and B shows the survival according to plasma cell labeling index (PCLI >= 1%) based risk status among patients diagnosed during 2001–2005 (Panel A) and those diagnosed later (Panel B). Panel C and D shows the survival according to plasma cell labeling index (PCLI >= 3%) based risk status among patients diagnosed during 2001–2005 (Panel C) and those diagnosed later (Panel D).