

Abstract
Bones consist of a number of cell types including osteoblasts and their precursor cells at various stages of differentiation. To analyze cellular organization within the bone, we generated Col1a1CreER-DsRed transgenic mice that express, in osteoblasts, CreER and DsRed under the control of a mouse 3.2 kb Col1a1 promoter. We further crossed Col1a1CreER-DsRed mice with Prx1CreER-GFP mice that express CreER and GFP in osteochondro progenitor cells under the control of a 2.4 kb Prx1 promoter. Since the 3.2 kb Col1a1 promoter becomes active in osteoblasts at early stages of differentiation, and Prx1CreER-GFP-expressing periosteal cells show endogenous Col1a1 expression, we expected to find a cell population in which both the 2.4 kb Prx1 promoter and the 3.2 kb Col1a1 promoter are active. However, our histological and flow cytometric analyses demonstrated that these transgenes are expressed in distinct cell populations. In the periosteum of long bones, Col1a1CreER-DsRed is expressed in the innermost layer directly lining the bone surface, while Prx1CreER-GFP-expressing cells are localized immediately outside of the Col1a1CreER-DsRed-expressing osteoblasts. In the calvaria, Prx1CreER-GFP-expressing cells are also localized in the cranial suture mesenchyme. Our experiments further showed that Col1a1CreER-DsRed-expressing cells lack chondrogenic potential, while the Prx1CreER-GFP-expressing cells show both chondrogenic and osteogenic potential. Our results indicate that Col1a1CreER-DsRed-expressing cells are committed osteoblasts, while Prx1CreER-GFP-expressing cells are osteochondro progenitor cells. The Prx1CreER-GFP and Col1a1CreER-DsRed transgenes will offer novel approaches for analyzing lineage commitment and early stages of osteoblast differentiation under physiologic and pathologic conditions.
Keywords: Prx1, Col1a1, osteoblasts, periosteum, cranial suture mesenchyme
Introduction
Bone formation takes place by two major ossification processes, endochondral ossification and intramembranous ossification [1,2]. In endochondral ossification, the skeletal element first develops as a cartilaginous template that is subsequently replaced by bone. In intramembranous ossification, mesenchymal cells directly differentiate into bone-forming osteoblasts, and the ossification process does not require pre-existing cartilage. Bones in the calvaria, such as the frontal and parietal bones, ossify through intramembranous ossification, while bones such as the long bones in the limb ossify through endochondral ossification. Periosteum that covers most of the external bone surface contains osteochondro progenitor cells that participate in bone and cartilage formation under physiologic states and pathologic conditions such as fracture healing [3,4]. Osteochondro progenitor cells can give rise to cells in both the chondrocyte and osteoblast lineages.
Histologically, periosteum consists of at least two layers: an outer fibrous layer and an inner cambium layer [4,5]. It is believed that the outer fibrous layer consists of fibroblastic cells, while the inner cambium layer contains a number of cell types including fibroblasts, multipotential stem cells, osteochondro progenitor cells, and cells in the osteoblast lineage at various stages of differentiation. Indeed, molecular analyses in chicks have identified a number of distinct cell populations in the periosteum, indicating heterogeneity in cellular organization [6]. To analyze the cellular composition of the periosteum, we previously generated Prx1CreER-GFP transgenic mice that express CreER and GFP under the control of a 2.4 kb Prx1 promoter [7]. Prx1 is a paired-related homeobox gene that is expressed in undifferentiated mesenchyme in the developing limbs [8,9]. Our previous study showed that the Prx1CreER-GFP transgene is expressed in a subset of periosteal cells in the cambium layer surrounding the long bones and that these cells can differentiate into chondrocytes and osteoblasts in vitro and in vivo, indicating that the Prx1CreER-GFP transgene marks osteochondro progenitor cells in the periosteum of long bones. In addition to its expression in the long bones, the Prx1CreER-GFP transgene is also expressed in the calvaria. However, the precise localization of the transgene-expressing cells and their differentiation potential have remained uncharacterized. Because other Prx1-driven transgenes have been reported to inhibit or enhance bone formation at the cranial suture [10–13], the Prx1 promoter may be active in osteoprogenitor cells in the cranial suture mesenchyme.
Our previous study also showed that Prx1CreER-GFP-expressing periosteal cells express the genes for type I collagen, Col1a1 and Col1a2 [7]. Regulatory elements of Col1a1, the gene for the alpha-1 chain of type I collagen, have been shown to direct transgene expression in osteoblasts [14–16]. While the 2.3 kb mouse and rat promoter elements are active only in differentiated osteoblasts, the 3.2 kb mouse and 3.6 kb rat promoter sequences become active at the early stages of osteoblast differentiation [15,16]. A number of studies have indicated that Col1a1-driven transgenes are expressed in the periosteum [17–20]. Because 3.2 kb mouse and 3.6 kb rat promoters become active in early osteoblasts, and Prx1CreER-GFP-expressing cells also express endogenous Col1a1, we hypothesized that the Prx1-driven transgenes and Col1a1-driven transgenes are expressed in distinct but overlapping domains in the periosteum. These transgenes may allow the identification of distinct cell populations and cell layers in the periosteum.
In this study, we generated Col1a1CreER-DsRed transgenic mice that express CreER and DsRed under the control of a mouse 3.2 kb Col1a1 promoter to further delineate the cellular organization of the periosteum and specifically to determine the relationship between Prx1CreER-GFP-expressing osteochondro progenitor cells and Col1a1-expressing osteoblasts. We also examined the localization of Prx1CreER-GFP- and Col1a1CreER-DsRed-expressing cell populations in the calvaria. We show here that Prx1CreER-GFP and Col1a1CreER-DsRed transgenes are expressed in distinct cell populations both in the long bones and calvariae and that Prx1CreER-GFP-expressing cells are precursor cells for the Col1a1CreER-DsRed-expressing osteoblasts. We also show that the Prx1CreER-GFP transgene marks osteochondro progenitor cells in the cranial suture mesenchyme, while the Col1a1CreER-DsRed transgene is expressed in committed osteoblasts. These transgenes will provide novel approaches for analyzing the biology of the periosteum and cranial suture mesenchyme under physiologic and pathologic conditions.
Materials and methods
The institutional animal care and use committee of Case Western Reserve University approved all animal procedures.
DNA construction, screening, and transgenic mice
The Prx1CreER-GFP transgenic mice were described previously in our laboratory [7]. To express CreER and DsRed in osteoblasts in the periosteum, we cloned cDNAs for CreER and DsRed Express2 downstream of a 3.2 kb Col1a1 promoter (Fig. 1A). CreER is a fusion molecule of Cre recombinase and the ligand binding domain of a mutated estrogen receptor [21]. The internal ribosome entry site (IRES), DsRed Express2 cDNA, and SV40 polyadenylation signal were excised from pIRES2 DsRed-Express2 (Clontech) and subcloned downstream of CreER cDNA. The construct was injected into the fertilized C57BL6 or C57BL6 x SJL F2 hybrid eggs at the Case Transgenic and Targeting Facility. Transgenic founders were identified by Polymerase Chain Reaction (PCR) using the primer set (forward) 5′-TGCAACGAGTGATGAGGTTCG-3′ and (reverse) 5′-CATGTTTAGCTGGCCCAAATGT-3′ that amplifies the 241 bp sequence of Cre recombinase. Transgene expression was assessed in offspring mice by examining the calvariae under the fluorescence microscope (Leica, DM-IRB).
Fig. 1.

Generation of Col1a1CreER-DsRed transgenic mice. (A) Schematic representation of the Col1a1CreER-DsRed transgene. cDNAs for CreER and DsRed were cloned downstream of a 3.2 kb Col1a1 promoter. (B) X-gal staining and DsRed fluorescence of E15.5 embryos. Tamoxifen injection at E13.5 caused widespread X-gal staining in the bones of Rosa26 LacZ; Col1a1CreER-DsRed embryos at E15.5. These embryos did not stain positive for X-gal without tamoxifen injection. (Tg) transgenic; (Wt) wild-type. (C) X-gal staining of the calvaria and forelimb of E18.5 Rosa26 LacZ; Col1a1CreER-DsRed embryos showing positive staining in the bones and tendons. Tamoxifen was injected into the mother at E15.5 and E16.5. Scale bars indicate 10 mm. (D) X-gal staining of the calvaria and forelimb of P15 Rosa26 LacZ; Col1a1CreER-DsRed mice showing positive staining in the bones. Tamoxifen was injected at P11 and P13. Scale bars indicate 10 mm.
Tamoxifen injection, X-gal staining, and histological analysis
Tamoxifen-inducible Cre activity was evaluated using the Rosa26 LacZ reporter mice (Jackson Laboratories). 1 mg/100 μl/day tamoxifen (Sigma) was injected into the pregnant mother or offspring mice via intraperitoneal or subcutaneous injection at indicated time points. Mice were sacrificed 2–3 days after the last tamoxifen injection. For X-gal staining, tissues were fixed with 0.2% glutaraldehyde, 5% formalin, 2 mM MgCl2, 5 mM EDTA, 0.02% NP40 in phosphate buffered saline (PBS), washed in rinse buffer (0.1% sodium deoxycholate, 0.2% NP40, 2 mM MgCl2, 0.1 M phosphate buffer, pH 7.3), and stained in X-gal solution (1 mg/ml X-gal, 5 mM ferricyanide, 5 mM ferrocyanide in the rinse buffer). X-gal-stained tissues were postfixed in 10% formalin in PBS, demineralized in 0.5 M EDTA, and embedded in paraffin. Sections were made at 7 μm and counterstained with hematoxylin and eosin. For histological analysis of GFP and DsRed fluorescence, tissues were harvested from Prx1CreER-GFP; Col1a1CreER-DsRed double transgenic mice, fixed in 10% formalin in PBS for 20 h at 4C, and demineralized in 0.5 M EDTA for 18 days. The tissues were then embedded in OCT compound (Sakura Finetek) and sectioned at 7 μm using a cryostat (Leica CM1850 UV). Sections were mounted with Fluoroshield with DAPI (Sigma). All images were acquired with a Leica DM 6000B microscope. Photographs were taken with a digital camera (Leica DC500) using Leica Application Suite 1.3 software. For simultaneous visualization of GFP and DsRed, a G/R filter (Leica) was used. The use of the dual bandpass filter allowed discrimination of GFP and autofluorescence of the bone [22]. The intensity of GFP and DsRed signal was adjusted using Photoshop software (Adobe) by applying adjustments to the whole image, with the strict intent of not obscuring, eliminating, or misrepresenting any information present in the original, including background.
Isolation of transgene-expressing cells
Transgene-expressing bone cells were isolated either from the long bones or from the calvariae. For isolation from the long bones, the diaphyses of tibiae, femora, humeri, radii, and ulnae were dissected out from 6- to 13-day-old Prx1CreER-GFP; Col1a1CreER-DsRed double transgenic mice, and cells were enzymatically released as described previously [7]. For isolation from the calvariae, the frontal, parietal, and interparietal bones were dissected out from Prx1CreER-GFP; Col1a1CreER-DsRed double transgenic mice at E18.5-P3. Calvariae were sequentially digested with collagenase B (Roche) at 3 mg/ml for 1 h or at 0.5 mg/ml overnight followed by 0.25% Trypsin/EDTA (Invitrogen) for an additional 30 min – 1 h at 37C. The released cells were collected by centrifugation, resuspended in PBS, 5% FCS, and filtered through a 70 μm cell strainer. Then the cells were sorted by fluorescence-activated cell sorting at the Case Western Reserve University Comprehensive Cancer Center Facility.
Osteogenic and chondrogenic differentiation
For assessing the osteogenic potential of calvaria-derived Prx1CreER-GFP-expressing cells, GFP (+); DsRed (−) cells were isolated from the calvaria by flow cytometry, plated in a 6-well plate at 30,000 cells/cm2, and cultured in αMEM, 10% FCS with 5% CO2 at 37C. After reaching confluence, osteogenic differentiation was induced by supplementing αMEM, 10% FCS with 5 mM β-glycerophosphate and 100 μg/ml ascorbic acid. The medium was changed three times per week. After 3 weeks of induction, osteogenic differentiation was examined by DsRed fluorescence, calcein blue staining, and alizarin red staining. For calcein blue staining, the medium was supplemented with 30 μM calcein blue [23]. For alizarin red staining, cells were fixed with 70% ethanol and stained in 1% alizarin red solution.
For chondrogenic differentiation, 8×10⁴ of sorted GFP (+); DsRed (−) and GFP (−); DsRed (+) cells were each resuspended in a 10 μl droplet and plated in micromass at the center of a 48-well plate. Cells were incubated for 1.5 h with 5% CO2 at 37C. Then, 200 μl of DMEM, 10% FCS were added onto the micromass droplet. Chondrogenic differentiation was induced by 500 ng/ml BMP2 (R&D). The medium was replaced every 3 days. After 7 days of chondrogenic induction, RNA was extracted and subjected to real-time PCR.
RNA extraction and real-time PCR
Total RNA was extracted using RNeasy micro kit (Qiagen). RNA was reverse-transcribed into cDNA with a High Capacity cDNA Archive Kit (Applied Biosystems) or Ovation Pico WTA System V2 (NuGEN). Real-time PCR was performed on the Applied Biosystems 7500 real-time PCR detection system. TaqMan probe sets were designed and synthesized by Applied Biosystems (Alcam; Mm00711623_m1, Asporin; Mm00445945_m1, Col1a1; Mm00801666_g1, Cxcl12; Mm00445553_m1, Gapdh; 4352932E, Hapln1; Mm00488952_m1, Ibsp; Mm00492555_m1, Ly6a; Mm00726565_s1, Prx1; Mm00599934_m1, Thy1; Mm00493681_m1, Osteopontin; Mm00436767_m1, Osterix; Mm00504574_m1, Periostin; Mm00450111_m1, Runx2; Mm00501584_m1, Satb2; Mm00507337_m1, Sulf1; Mm00552283_m1, Thbs2; Mm01279240_m1, 4Cytl1; Mm01217843_m1). To compare gene expression levels, the comparative cycle threshold (Ct) method was used. Gapdh was used as an endogenous control to correct for potential variation in RNA loading or in efficiency of amplification. A t test was used to compare expression levels between GFP (+); DsRed (−) and GFP (−); DsRed (+) cells. p values < 0.05 were considered statistically significant.
Microarray analysis
Microarray analysis was performed at the Gene Expression and Genotyping Facility of the Case Comprehensive Cancer Center at Case Western Reserve University. Total RNA was converted into double-stranded cDNA and amplified cDNA was labeled with biotin and fragmented using Encore Biotin Module (NuGEN). Approximately 12 ng of total RNA was amplified using standard protocols found in Ovation Pico WTA System V2 (NuGEN) in preparation for use on the latest vintage of Affymetrix Whole Transcript Mouse Gene array ST 1.0 microarrays. Briefly, the RNA was reverse transcribed using random primers and Superscript II enzyme. Second strand synthesis was carried out using RNase H and DNA Polymerase I enzymes. Biotin labeled cDNA was added with carrier molecules, buffers and control spikes to make a hybridization cocktail. Samples were hybridized to Affymetrix mouse Gene Array ST 1.0, containing more than 35,000 probe sets.
Expression signals were generated using proprietary software algorithms contained within Affymetrix’ Expression Console (EC) software (Affymetrix, Inc). Criteria for changed expression were three fold, as follows: Data were subjected to quantile normalization using EC feature named Robust Multichip Analysis (RMA). Data were exported from EC as tab delimited text files containing log2 transformed signals. These files were opened using MS Excel. Signal log ratios were generated between binary paired files and these were converted in to fold changes. The data were imported into MS access and queried for fold changes whose absolute values were greater than or equal to 1.5.
Results
Screening of transgenic mice
Among 94 founder mice, we identified 17 transgenic founders by PCR. These transgenic lines were further crossed with the Rosa26 LacZ reporter mice, and tamoxifen-inducible Cre activity was evaluated in offspring embryos/mice by X-gal staining. Four of the 17 lines showed intense X-gal staining upon induction with tamoxifen. Out of 4 lines that showed similar Cre activity, 1 line was chosen for further analysis. The selected line was further mated to homozygosity. Both heterozygous and homozygous mice developed and bred normally, indicating that the transgene did not disrupt genes that are essential for normal development.
Col1a1CreER-DsRed transgene is expressed in osteoblasts, odontoblasts, and some of the tendon cells
Expression domains of the transgene were further analyzed by the fluorescence of DsRed and tamoxifen-inducible Cre recombinase activity. At E15.5, DsRed fluorescence was observed in the ribs, the mandible, the frontal and parietal bones in the calvaria, and the diaphyses of the long bones, corresponding to the location of bone formation (Fig 1B). We further crossed the Col1a1CreER-DsRed transgenic mice with the Rosa26 LacZ reporter mice and examined Cre-loxP mediated recombination in the offspring mice by X-gal staining. Tamoxifen was injected at various time points between E11.5 and 3 months of age. When tamoxifen was injected into the pregnant mother at E11.5 and the embryos were stained with X-gal at E15.5, not all of the Col1a1CreER-DsRed; Rosa26 LacZ embryos stained positive for X-gal, most likely reflecting the variation in development among embryos (data not shown). When tamoxifen was injected into the pregnant mother at E13.5 and embryos were stained with X-gal at E15.5, all of the Col1a1CreER-DsRed; Rosa26 LacZ embryos showed X-gal staining in a pattern that is very similar to that of DsRed fluorescence (Fig. 1B). Littermate Rosa26 LacZ embryos without the Col1a1CreER-DsRed transgene did not stain positive for X-gal (data not shown). In addition, none of the E15.5 Col1a1CreER-DsRed; Rosa26 LacZ embryos stained positive for X-gal without tamoxifen injection (Fig. 1B). Similarly, tamoxifen injection at E15.5 and E16.5 (Fig 1C) and P11 and P13 (Fig 1D) resulted in intense X-gal staining in the bones of Col1a1CreER-DsRed; Rosa26 LacZ mice at E18.5 and P15, respectively. Tendons also stained positive for X-gal at E18.5 (Fig 1C). These observations indicate that E11.5 is the critical time point after which Cre-loxP mediated recombination is widely induced in skeletal elements. Cre-loxP mediated recombination was induced by tamoxifen at least up to 3 months of age (data not shown).
Histological analysis further revealed DsRed fluorescence in osteoblasts lining the cortical and trabecular bones as well as some of the osteocytes within the bone matrix (Fig. 2A). Consistent with this observation, X-gal staining was observed in osteoblasts and some of the osteocytes of tamoxifen-injected Col1a1CreER-DsRed; Rosa26 LacZ mice both in the cranial bones and long bones (Fig 2B,C,D). X-gal staining was also observed in odontoblasts in the developing teeth and in some cells in the ligaments, in the meniscus of the knee joint, and in muscle fascia (Fig 2D). No chondrocytes in the articular and epiphyseal cartilage stained positive for X-gal (Fig 2C,D).
Fig. 2.

Tissue distribution of DsRed fluorescence and Cre recombinase activity of the Col1a1CreER-DsRed transgenic mice. (A) DsRed fluorescence in the distal ulna (U) and radius (R) of Col1a1CreER-DsRed transgenic mice at P12. The boxed area in the upper panel is magnified in the lower panel. Osteoblasts in the endosteum and periosteum as well as some of the osteocytes (white arrows) show DsRed fluorescence. E: epiphysis, M: metaphysis, D: diaphyses. Asterisks (*) indicate secondary ossification centers. (B) Coronal section of the sagittal suture of E18.5 Rosa26 LacZ; Col1a1CreER-DsRed embryo showing X-gal staining in the osteoblasts of the parietal bones (P). Cells in the cranial suture mesenchyme (*) are negative for X-gal. Tamoxifen was injected into the pregnant mother at E15.5 and E16.5. (C) Coronal section of the temporomandibular joint of E18.5 Rosa26 LacZ; Col1a1CreER-DsRed embryo showing X-gal staining in osteoblasts. Cells in the developing articular cartilage and meniscus (m) are negative for X-gal. Temporal bone (T), Mandible (M). (D) Odontoblasts in the incisor (left), cells in the cruciate ligaments (box 1), meniscus of the knee joint (box 2), and muscle fascia (box 3) stain positive for X-gal. Boxes 1–3 are magnified in the right panels. The incisor and knee samples were harvested at E17.5 and E18.5, respectively. Tamoxifen was injected into the pregnant mother 2 days and 3 days prior to X-gal staining. Scale bars at the right bottom of each panel indicate 100 μm.
Col1a1CreER-DsRed transgene shows no germline recombination
Since germline recombination has been reported in transgenic mice expressing Cre recombinase under the control of the 2.3 kb and 3.6 kb rat Col1a1 promoter [24], we examined whether the Col1a1CreER-DsRed transgene shows Cre activity in the germline or early embryogenesis in the absence of tamoxifen. E15.5 embryos were harvested from the wild-type female that was crossed with the Col1a1CreER-DsRed; Rosa26 LacZ male and from the Col1a1CreER-DsRed; Rosa26 LacZ female that was crossed with the wild-type male. In neither case was X-gal staining observed in Col1a1CreER-DsRed; Rosa26 LacZ embryos, indicating that Cre-loxP-mediated recombination does not take place in the germline or in early embryogenesis in the absence of tamoxifen (data not shown).
Prx1CreER-GFP and Col1a1CreER-DsRed transgenes show complementary expression
We previously generated Prx1CreER-GFP transgenic mice that express CreER and GFP under the control of a 2.4 kb Prx1 promoter [7]. The transgene is expressed in osteochondro progenitor cells that can give rise to osteoblasts, and flow-sorted Prx1CreER-GFP-expressing periosteal cells show endogenous Col1a1 expression, raising the possibility that the Prx1CreER-GFP and Col1a1CreER-DsRed transgenes are expressed in an overlapping cell population. Therefore, we examined and compared expression domains of the respective transgene in Prx1CreER-GFP; Col1a1CreER-DsRed double transgenic mice. At E15.5, the Col1a1CreER-DsRed transgene is expressed in the developing frontal and parietal bones in the calvaria, while Prx1CreER-GFP transgene is expressed in the interposing cranial sutures (Fig 3A). The same pattern of complementary expression was also observed in the calvaria at P12. We further examined the localization of DsRed and GFP fluorescence by histological analysis. While the Col1a1CreER-DsRed transgene is expressed in osteoblasts lining the cranial bone, the Prx1CreER-GFP transgene-expressing cells were found in the cranial suture mesenchyme (Fig 3B). In the long bones, the Col1a1CreER-DsRed transgene is expressed in the osteoblasts lining the cortical and trabecular bones and some of the osteocytes, while the Prx1CreER-GFP transgene is expressed in the periosteum (Fig 3C). Interestingly, while both transgenes are expressed in the inner cambium layer of the periosteum, Col1a1CreER-DsRed and Prx1CreER-GFP transgenes are expressed in distinct cell populations. The Col1a1CreER-DsRed transgene is expressed in the innermost layer lining the cortical bone. In contrast, Prx1CreER-GFP-expressing cells are localized immediately outside of the Col1a1CreER-DsRed-expressing cells. In addition to the bone and periosteum, Col1a1CreER-DsRed and Prx1CreER-GFP transgenes are also expressed in tendon cells (Fig 3C). Similar to their expression in the periosteum, these transgenes are expressed in distinct cell populations in the tendons, and only a few cells expressed both transgenes. The distinct localization of Col1a1CreER-DsRed and Prx1CreER-GFP-expressing cells in the periosteum was further confirmed in the respective mouse line by using the Rosa26 LacZ reporter (Fig 4). Histological measurement indicated that Prx1CreER-GFP-expressing cells are localized at a greater distance from the cortical bone surface compared with the Col1a1CreER-DsRed-expressing cells (Fig 4B).
Fig. 3.

Complementary expression of the Prx1CreER-GFP and Col1a1CreER-DsRed transgenes. (A) GFP and DsRed fluorescence of the calvaria of Prx1CreER-GFP; Col1a1CreER-DsRed at E15.5 and P12 showing complementary expression of the transgenes. The right panel shows magnified view of the sagittal suture. While the Col1a1CreER-DsRed transgene is expressed in the bone, the Prx1CreER-GFP transgene is expressed in the cranial suture. F: frontal bone, P: parietal bone. (B) GFP and DsRed fluorescence of the sagittal suture of Prx1CreER-GFP; Col1a1CreER-DsRed mice at P12. GFP-expressing cells are localized in the cranial suture mesenchyme. P: parietal bone, S: sagittal suture. (C) GFP and DsRed fluorescence of the distal ulna at the level of chondro-osseous junction at P12. The boxed area in the upper right panel is magnified in the lower left panel. Osteoblasts lining the developing cortical bone shows DsRed fluorescence, while GFP-expressing cells are found in the periosteum immediately adjacent to the DsRed-expressing osteoblasts (white arrows). Some of the periosteal cells further outside also show GFP fluorescence. GFP and DsRed-expressing cells are also found in the tendon.
Fig. 4.
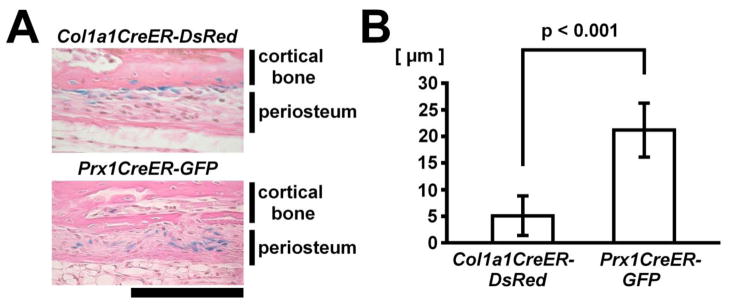
Distinct distribution of Cre recombinase activity in the periosteum of Prx1CreER-GFP and Col1a1CreER-DsRed transgenic mice. (A) X-gal staining of the cortical bone and periosteum of distal radius of Rosa26 LacZ; Col1a1CreER-DsRed (upper panel) and Rosa26 LacZ; Prx1CreER-GFP mice (lower panel) at P27. Tamoxifen was injected twice at P23 and P25. While osteoblasts lining the bone cortex stain positive in Rosa26 LacZ; Col1a1CreER-DsRed mice, periosteal cells overlying X-gal-negative osteoblasts stain positive in Rosa26 LacZ; Prx1CreER-GFP mice. Scale bar at the right bottom of panel indicates 100 μm. (B) Localization of X-gal-positive cells in the periosteum was expressed as the distance from the outer surface of the cortical bone. Histological measurement in the radius of tamoxifen-injected Rosa26 LacZ; Col1a1CreER-DsRed and Rosa26 LacZ; Prx1CreER-GFP mice indicated that Prx1CreER-GFP -expressing cells (n=52) are localized at a greater distance from the cortical bone compared with Col1a1CreER-DsRed -expressing cells (n=53) that are localized adjacent to the cortical bone.
Prx1CreER-GFP and Col1a1CreER-DsRed-expressing cells are distinct cell populations
To further characterize Col1a1CreER-DsRed and Prx1CreER-GFP-expressing cells, cells were isolated from the calvariae of wild type and Col1a1CreER-DsRed; Prx1CreER-GFP double transgenic mice by sequential digestion with collagenase and trypsin/EDTA. The released cells were plated in the culture dish, and GFP and DsRed fluorescence was examined under the microscope (Fig 5A, Supplemental Fig 1A). Consistent with the histological observation, only a few cells showed both GFP and DsRed fluorescence in the culture of Col1a1CreER-DsRed; Prx1CreER-GFP double transgenic cells. Wild type cells showed minimal background for GFP and DsRed fluorescence. The specificity of GFP and DsRed fluorescence was also confirmed in C3H10T1/2 cells expressing either GFP or DsRed alone (Supplemental Fig 1B). The non-overlapping expression of the Col1a1CreER-DsRed and Prx1CreER-GFP transgenes was further confirmed by flow cytometry (Fig 5B). Very similar results were obtained when the cells were isolated from the diaphyses of long bones (data not shown).
Fig. 5.

Prx1CreER-GFP and Col1a1CreER-DsRed transgenes are expressed in mostly distinct cell populations. (A) GFP and DsRed fluorescence and corresponding bright field view of calvaria cells isolated from E18.5 Prx1CreER-GFP; Col1a1CreER-DsRed embryos one day after plating. GFP and DsRed are expressed in distinct cell populations, and only a few cells express both GFP and DsRed (arrow). (B) Flow cytometry analysis of calvaria cells isolated from wild type (Wt) and Prx1CreER-GFP; Col1a1CreER-DsRed (Tg) mice at P12. The proportion of cells in each quadrant is indicated. The proportion of the upper right quadrant corresponding to GFP and DsRed double positive cells is similar between wild type and Col1a1CreER-DsRed; Prx1CreER-GFP double transgenic cells, indicating that the fluorescence is mostly background. (C) Real-time PCR analysis of GFP(−); DsRed(+), GFP(+); DsRed(−), and GFP(−); DsRed(−) cells isolated from the diaphyses of long bones. Both GFP(+); DsRed(−) and GFP(−); DsRed(+) cells show relatively high Prx1 expression compared with GFP(−); DsRed(−) cells, while GFP(−); DsRed(+) cells show highest expression of Col1a1. Data represent mean ± standard deviations. The figure presents data from one of three experiments with similar results.
Prx1CreER-GFP and Col1a1CreER-DsRed-expressing cells express endogenous Prx1 and Col1a1
We next examined whether the expression of Col1a1CreER-DsRed and Prx1CreER-GFP transgenes reflects endogenous Col1a1 and Prx1 mRNA expression. GFP (−); DsRed (+), GFP (+); DsRed (−), and GFP (−); DsRed (−) cells were sorted from the diaphyses of long bones by flow cytometry, and Prx1 and Col1a1 expression was examined by real-time PCR. Interestingly, endogenous Prx1 and Col1a1 expression did not strictly correlate with the transgene expression (Fig 5C). Although GFP (−); DsRed (+) cells do not express the Prx1CreER-GFP transgene, these cells express endogenous Prx1 at relatively high levels. Similarly, GFP (+); DsRed (−) cells that do not express the Col1a1CreER-DsRed transgene express endogenous Col1a1, albeit at a reduced level.
Prx1CreER-GFP-expressing calvaria cells show both chondrogenic and osteogenic potential, while Col1a1CreER-DsRed-expressing calvaria cells lack chondrogenic potential
Our previous study indicated that Prx1CreER-GFP-expressing periosteal cells in the long bones are osteochondro progenitor cells that can give rise to chondrocytes and osteoblasts [7]. Interestingly, the Prx1CreER-GFP transgene is also expressed in the developing calvaria. We therefore examined the osteogenic and chondrogenic potential of Prx1CreER-GFP-expressing cells isolated from the calvaria. For osteogenic differentiation, we first isolated GFP (+); DsRed (−) cells from the calvaria of Prx1CreER-GFP; Col1a1CreER-DsRed double transgenic mice by flow cytometry. The cells were plated in culture and treated with β-glycerophosphate and ascorbic acid after reaching confluence. After 3 weeks of osteogenic induction, these cells formed mineralized bone nodules as indicated by calcein blue fluorescence and alizarin red staining (Fig 6A and data not shown). The cells in the mineralized nodules showed DsRed fluorescence, indicating the osteogenic differentiation of Prx1CreER-GFP-expressing cells.
Fig. 6.

GFP (+); DsRed (−) cells show osteogenic and chondrogenic potential, while GFP (−); DsRed (+) cells lack chondrogenic potential. (A) GFP(+); DsRed(−) calvaria cells form mineralizing bone nodules consisting of DsRed-expressing osteoblasts in culture. GFP(+); DsRed(−) cells were isolated from the calvariae of Prx1CreER-GFP; Col1a1CreER-DsRed mice at P0-2 by enzymatic digestion followed by flow cytometry, and osteogenic differentiation was induced with ascorbic acid and β-glycerophosphate. After 25 days of osteogenic induction, GFP(+); DsRed(−) cells formed bone nodules containing DsRed-expressing osteoblasts (middle panel), and their matrix showed mineralization as indicated by calcein blue fluorescence (right panel). (B) GFP(+); DsRed(−) calvaria cells, but not GFP(−); DsRed(+) cells, show chondrogenic differentiation in micromass culture. GFP(+); DsRed(−) and GFP(−); DsRed(+) cell populations were isolated from the calvariae of Prx1CreER-GFP; Col1a1CreER-DsRed mice at P0-1 by enzymatic digestion followed by flow cytometry. The cells were cultured in micromass, and chondrogenic differentiation was induced with 500 ng/ml BMP2 for 7 days. Real-time PCR showed remarkable upregulation of Aggrecan and Col2a1 in BMP2-treated GFP(+); DsRed(−) cells, but not in GFP(−); DsRed(+) cells. Osteoblast markers Ibsp and Satb2 remained relatively unchanged in BMP2-treated GFP(+); DsRed(−) cells. Data represent mean ± standard deviations. The figure presents data from one of two experiments with similar results.
For chondrogenic differentiation, we flow-sorted GFP (+); DsRed (−) and GFP (−); DsRed (+) cells from the calvariae of Prx1CreER-GFP; Col1a1CreER-DsRed double transgenic mice, and each cell population was plated in micromass and maintained in parallel. The cells were treated with BMP2 at 500 ng/ml for 7 days to induce chondrogenic differentiation. In GFP (+); DsRed (−) cells, BMP2 caused a 20-fold and 4-fold increase in Aggrecan and Col2a1 expression, while the same treatment did not induce Aggrecan and Col2a1 expression in GFP (−); DsRed (+) cells (Fig 6B). Expression of osteoblast markers Ibsp and Satb2 remained relatively unaffected in BMP2-treated GFP(+); DsRed(−) cells. These results indicate the chondrogenic potential of GFP (+); DsRed (−) cells and the lack of chondrogenic potential in GFP (−); DsRed (+) cells.
Prx1CreER-GFP-expressing calvaria cells give rise to chondrocytes and osteoblasts in vivo
Since Prx1CreER-GFP-expressing calvaria cells showed osteogenic and chondrogenic potential in culture, we further examined whether Prx1CreER-GFP-expressing cells differentiate into osteoblasts and chondrocytes in vivo. We crossed Prx1CreER-GFP transgenic mice with Rosa26 LacZ reporter mice, and tamoxifen was injected into the pregnant mother at E13.5. X-gal staining of calvariae at P15 showed intense staining in the frontal, parietal, and interparietal bones (Fig 7A). Histological analysis confirmed X-gal staining in the osteoblasts and some of the osteocytes, indicating that Prx1CreER-GFP-expressing cells differentiate into the osteoblast lineage (Fig 7B). Furthermore, in the interparietal bone that at least partially forms through endochondral ossification [25], some of the chondrocytes stained positive for X-gal, indicating that Prx1CreER-GFP-expressing cells in the calvaria also differentiate into the chondrocyte lineage (Fig 7C). Similar to the calvaria, X-gal staining of the long bones in the limb also showed positive staining both in osteoblasts and chondrocytes (Fig 7D).
Fig. 7.
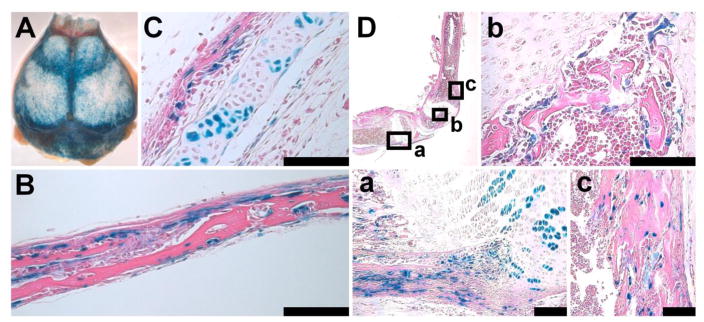
Prx1CreER-GFP-expressing cells give rise to both chondrocytes and osteoblasts in the calvaria and long bone. (A) X-gal staining of the calvaria of Rosa26 LacZ; Prx1CreER-GFP mice at P15. Tamoxifen was injected into the mother at E13.5. (B) Coronal section of the parietal bone shown in (A). Some of the osteoblasts, osteocytes and periosteal cells stained positive for X-gal. (C) Section of the interparietal bone shown in (A). In addition to osteoblasts, some of the chondrocytes stained positive for X-gal, indicating osteogenic and chondrogenic potential of Prx1CreER-GFP-expressing cells. (D) X-gal staining of the tibia and femur of the Rosa26 LacZ; Prx1CreER-GFP mouse shown in (A). Boxed areas (a–c) in the upper left panel are magnified in the corresponding panel. (a) Some of the chondrocytes, osteoblasts, and periosteal cells stained positive in the proximal tibia. (b) Osteoblasts lining the bone trabeculae stained positive in the secondary ossification center of the distal femur. (c) Osteoblasts stained positive in the anterior cortex of the distal femur. Scale bars at the right bottom of each panel indicate 100 μm.
Prx1CreER-GFP-expressing cells express genes associated with chondrocytes, periosteal cells, and mesenchymal stem cells, while Col1a1CreER-DsRed-expressing cells express osteoblast markers
To identify differentially expressed genes between Col1a1CreER-DsRed and Prx1CreER-GFP-expressing cells, we performed microarray analysis. GFP (+); DsRed (−) and GFP(−); DsRed (+) cells were isolated from the calvaria of Prx1CreER-GFP; Col1a1CreER-DsRed double transgenic mice by flow cytometry, and RNA was subjected to microarray analysis using Affymetrix Mouse Gene array ST1.0 Chips. We identified 497 genes that reproducibly showed a difference of 1.5 fold or greater in two independent experiments (Supplemental Table 1). Contrary to our expectations, Col1a1 and Prx1 were not among the 497 genes; Col1a1 was not identified in one of the two experiments, and Prx1 was not identified in either experiment. Nevertheless, we found a number of osteoblast-related genes that are expressed at higher levels in GFP (−); DsRed (+) cells. We also found that GFP (+); DsRed (−) cells express genes associated with chondrocytes, periosteal cells, and mesenchymal stem cells at higher levels compared with GFP (−); DsRed (+) cells. The differential expression was further confirmed by real-time PCR for some of the representative genes (Fig 8). While the GFP (−); DsRed (+) cells showed higher expression of osteoblast markers Runx2, Osterix, Satb2, Col1a1, Spp1, and Ibsp, the GFP (+); DsRed (−) cells showed higher expression of chondrocyte markers Sox9, Sulf-1, Aggrecan, Hapln1, 4Cytl-1, and Col2a1, of periosteal markers Asporin, Periostin, and Thrombospondin 2, and of markers associated with mesenchymal stem cells, Cxcl12 (SDF-1), Ly6a (Sca-1), Thy1 (CD90), and Alcam (CD166).
Fig. 8.

Real-time PCR analyses of GFP(+); DsRed(−) and GFP(−); DsRed(+) cells isolated from the calvariae of E18.5 Prx1CreER-GFP; Col1a1CreER-DsRed embryos. While GFP(−); DsRed(+) cells show higher expression for osteoblast markers (A), GFP(+); DsRed(−) cells express chondrocyte markers (B), periosteal markers (C), and markers associated with mesenchymal stem cells (D) at higher levels. Data represent mean ± standard deviations. The figure presents data from one of three experiments with similar results. Acan: Aggrecan, Thbs2: Thrombospondin 2, Postn: Periostin, Aspn: Asporin.
Discussion
Several lines of evidence had indicated that the Prx1 promoter is active in progenitor cells that give rise to osteoblasts. When genes essential for osteoblast differentiation were disrupted by using the Prx1Cre transgene, the gene inactivation resulted in severe impairment of bone formation, as observed in the case of β-catenin and ERK1/ERK2 [10,11]. In addition, our previous experiments using the Prx1CreER-GFP transgene showed that the transgene-expressing cells in the periosteum give rise to osteoblasts in the fracture callus [7]. In the present study, we further showed that Prx1CreER-GFP-expressing cells give rise to osteoblasts during normal development both in the long bones and the calvariae, and that flow-sorted Prx1CreER-GFP-expressing cells differentiate into Col1a1CreER-DsRed-expressing osteoblasts in culture. These observations indicate that Prx1CreER-GFP-expressing cells are precursor cells for Col1a1CreER-DsRed-expressing osteoblasts.
Since the 3.2 kb Col1a1 promoter is active in immature osteoblasts, and Prx1CreER-GFP-expressing periosteal cells express endogenous Col1a1, we expected to find a cell population in which both the 2.4 kb Prx1 promoter and the 3.2 kb Col1a1 promoter are active. However, our histological and flow cytometric analyses demonstrated that these transgenes are virtually expressed in distinct cell populations. The non-overlapping expression of the transgenes indicates that either the Prx1CreER-GFP transgene is turned off before the Col1a1CreER-DsRed transgene is activated or the cells express both Prx1CreER-GFP and Col1a1CreER-DsRed transgenes only for a short period of time during the course of osteoblast differentiation.
Calvaria-derived Prx1CreER-GFP and Col1a1CreER-DsRed-expressing cells showed a distinct difference in chondrogenic potential in vitro. While Prx1CreER-GFP-expressing cells underwent chondrogenic differentiation in micromass culture as evidenced by the remarkable induction of Col2a1 and Aggrecan with BMP2 treatment, the same culture conditions did not induce chondrogenic differentiation in Col1a1CreER-DsRed-expressing cells isolated in parallel, implying that Col1a1CreER-DsRed-expressing cells are already committed to the osteoblast lineage. This is also consistent with our experiments using the Rosa26 LacZ reporter, in which no chondrocytes showed positive staining for X-gal in tamoxifen-injected Col1a1CreER-DsRed; Rosa26 LacZ embryos and mice (Fig 2). In the periosteum of long bones, the Col1a1CreER-DsRed-expressing cells are localized in the innermost layer directly lining the bone matrix, while Prx1CreER-GFP-expressing cells are localized immediately on the outer side of the Col1a1CreER-DsRed-expressing cells (Fig 3C, 4). Apparently, osteochondro progenitor cells maintain close association with committed osteoblasts within the periosteum.
Our microarray experiments and real-time PCR analyses demonstrated distinct gene expression profiles of the two cell populations. Consistent with their differentiation potential and lineage commitment, Col1a1CreER-DsRed-expressing cells show high levels of osteoblast marker expression and very low levels of chondrocyte marker expression, while Prx1CreER-GFP-expressing cells express both osteoblast and chondrocyte markers at modest levels. In addition, Prx1CreER-GFP-expressing cells also express periosteal markers and some of the mesenchymal stem cell markers. This is also consistent with their periosteal localization and undifferentiated progenitor status. Based on the gene expression profile, Prx1CreER-GFP-expressing cells may best be described as osteochondro progenitor cells with some molecular characteristics of periosteal cells and mesenchymal stem cells.
Bones in the calvaria are derived from both cranial neural crest and paraxial mesoderm [26,27]. Bones anterior to the coronal suture, such as frontal bones, are derived from the neural crest, while bones posterior to the coronal suture, such as parietal and interparietal bones, are mostly derived from the paraxial mesoderm [28,29]. Cells that stain positive for X-gal were uniformly distributed among cranial bones, implicating that the Prx1CreER-GFP transgene is expressed in the mesenchyme derived from both origins, which is consistent with the known expression patterns of endogenous Prx1 [30]. Our analysis also indicated that Prx1CreER-GFP-expressing cells are localized in the cranial suture mesenchyme. Cranial bones grow by the apposition of bone tissue at the cranial suture [27]. Cranial suture mesenchyme provides osteoblasts that participate in this appositional growth, while at the same time the mesenchyme remains undifferentiated and separates the growing cranial bones. The precise regulation of the differentiation of Prx1CreER-GFP-expressing cells would be essential for the proper growth of the calvaria, since premature ossification of the cranial suture leads to the growth disturbance known as craniosynostosis. The aberrant differentiation of osteochondro progenitor cells also accounts for the ectopic chondrocyte marker expression and cartilage formation in the calvariae of genetically engineered mouse models [10,31,32].
In summary, we have generated transgenic mice that express CreER and DsRed in osteoblasts under the control of a 3.2 kb Col1a1 promoter. Histological and flow cytometric analyses of Prx1CreER-GFP; Col1a1CreER-DsRed double transgenic mice indicated that Prx1CreER-GFP and Col1a1CreER-DsRed transgenes are expressed in distinct cell populations in the long bones and calvariae. While the Prx1CreER-GFP transgene marks osteochondro progenitor cells, the Col1a1CreER-DsRed transgene is expressed in committed osteoblasts. The Prx1CreER-GFP and Col1a1CreER-DsRed transgenes will be useful in inducing Cre-loxP-mediated recombination in respective cell populations. These transgenes will allow the visualization and isolation of transgene-expressing cells and thus facilitate the analysis of the lineage commitment of progenitor cells in a variety of mouse models for bone disorders.
Supplementary Material
Highlights.
We generated Col1a1CreER-DsRed mice that express, in osteoblasts, CreER and DsRed under the control of a 3.2 kb Col1a1 promoter.
Histological and flow cytometric analyses demonstrated that Prx1 and 3.2 kb Col1a1 promoters target distinct bone cell populations.
While Prx1CreER-GFP-expressing cells show both chondrogenic and osteogenic potential, Col1a1CreER-DsRed-expressing cells are committed osteoblasts lacking chondrogenic potential.
Acknowledgments
We thank Benoit de Crombrugghe for the mouse 3.2 kb Col1a1 promoter. We also thank Teresa Pizzuto and Chunbiao Li for technical assistance, Yoichi Ezura for critically reading of the manuscript, and Valerie Schmedlen for editorial assistance. We thank the Case Transgenic and Targeting Facility for assistance with the generation of transgenic mice. This work was supported by a pilot grant from National Center for Regenerative Medicine, the Ray A. Kroc and Robert L. Kroc Scholars Award in Arthritis and Connective Tissue Diseases Research, and NIH grants R03DE019814 to SM and R01AR055556 to SM and EMG. The Gene Expression and Genotyping Facility of the Case Comprehensive Cancer Center was supported by NIH grant P30CA43703.
Footnotes
Publisher's Disclaimer: This is a PDF file of an unedited manuscript that has been accepted for publication. As a service to our customers we are providing this early version of the manuscript. The manuscript will undergo copyediting, typesetting, and review of the resulting proof before it is published in its final citable form. Please note that during the production process errors may be discovered which could affect the content, and all legal disclaimers that apply to the journal pertain.
References
- 1.Kronenberg HM. Developmental regulation of the growth plate. Nature. 2003;423:332–336. doi: 10.1038/nature01657. [DOI] [PubMed] [Google Scholar]
- 2.Long F. Building strong bones: molecular regulation of the osteoblast lineage. Nat Rev Mol Cell Biol. 2011;13:27–38. doi: 10.1038/nrm3254. [DOI] [PubMed] [Google Scholar]
- 3.Colnot C. Skeletal cell fate decisions within periosteum and bone marrow during bone regeneration. J Bone Miner Res. 2009;24:274–282. doi: 10.1359/jbmr.081003. [DOI] [PMC free article] [PubMed] [Google Scholar]
- 4.Colnot C, Zhang X, Knothe Tate ML. Current insights on the regenerative potential of the periosteum: Molecular, cellular, and endogenous engineering approaches. J Orthop Res. 2012;30:1869–1878. doi: 10.1002/jor.22181. [DOI] [PMC free article] [PubMed] [Google Scholar]
- 5.Tanenbaum HC. An ultrastructural study of osteogenesis in chick periosteum in vitro. Bone. 1986;7:295–302. doi: 10.1016/8756-3282(86)90211-5. [DOI] [PubMed] [Google Scholar]
- 6.Bandyopadhyay A, Kubilus JK, Crochiere ML, Linsenmayer TF, Tabin CJ. Identification of unique molecular subdomains in the perichondrium and periosteum and their role in regulating gene expression in the underlying chondrocytes. Dev Biol. 2008;321:162–174. doi: 10.1016/j.ydbio.2008.06.012. [DOI] [PMC free article] [PubMed] [Google Scholar]
- 7.Kawanami A, Matsushita T, Chan Y, Murakami S. Mice expressing GFP and CreER in osteochondro progenitor cells in the periosteum. Biochem Biophys Res Commun. 2009;386:477–482. doi: 10.1016/j.bbrc.2009.06.059. [DOI] [PMC free article] [PubMed] [Google Scholar]
- 8.Nohno T, Koyama E, Myokai F, Taniguchi S, Ohuchi H, Saito T, Noji S. A chicken homeobox gene related to Drosophila paired is predominantly expressed in the developing limb. Dev Biol. 1993;158:254–264. doi: 10.1006/dbio.1993.1184. [DOI] [PubMed] [Google Scholar]
- 9.Kuratani S, Martin JF, Wawersik S, Lilly B, Eichele G, Olson EN. The expression pattern of the chick homeobox gene gMHox suggests a role in patterning of the limbs and face and in compartmentalization of somites. Dev Biol. 1994;161:357–369. doi: 10.1006/dbio.1994.1037. [DOI] [PubMed] [Google Scholar]
- 10.Hill TP, Später D, Taketo MM, Birchmeier W, Hartmann C. Canonical Wnt/beta-catenin signaling prevents osteoblasts from differentiating into chondrocytes. Dev Cell. 2005;8:727–738. doi: 10.1016/j.devcel.2005.02.013. [DOI] [PubMed] [Google Scholar]
- 11.Matsushita T, Chan Y, Kawanami A, Balmes G, Landreth GE, Murakami S. Extracellular Signal-Regulated Kinase 1 (ERK1) and ERK2 play essential roles in osteoblast differentiation and in supporting osteoclastogenesis. Mol Cell Biol. 2009;29:5843–5857. doi: 10.1128/MCB.01549-08. [DOI] [PMC free article] [PubMed] [Google Scholar]
- 12.Seo HS, Serra R. Tgfbr2 is required for development of the skull vault. Dev Biol. 2009;334:481–490. doi: 10.1016/j.ydbio.2009.08.015. [DOI] [PMC free article] [PubMed] [Google Scholar]
- 13.Maeno T, Moriishi T, Yoshida CA, Komori H, Kanatani N, Izumi S, Takaoka K, Komori T. Early onset of Runx2 expression caused craniosynostosis, ectopic bone formation, and limb defects. Bone. 2011;49:673–682. doi: 10.1016/j.bone.2011.07.023. [DOI] [PubMed] [Google Scholar]
- 14.Pavlin D, Lichtler AC, Bedalov A, Kream BE, Harrison JR, Thomas HF, Gronowicz GA, Clark SH, Woody CO, Rowe DW. Differential utilization of regulatory domains within the alpha 1(I) collagen promoter in osseous and fibroblastic cells. J Cell Biol. 1992;116:227–236. doi: 10.1083/jcb.116.1.227. [DOI] [PMC free article] [PubMed] [Google Scholar]
- 15.Rossert J, Eberspaecher H, de Crombrugghe B. Separate cis-acting DNA elements of the mouse pro-alpha 1(I) collagen promoter direct expression of reporter genes to different type I collagen-producing cells in transgenic mice. J Cell Biol. 1995;129:1421–1432. doi: 10.1083/jcb.129.5.1421. [DOI] [PMC free article] [PubMed] [Google Scholar]
- 16.Kalajzic I, Kalajzic Z, Kaliterna M, Gronowicz G, Clark SH, Lichtler AC, Rowe D. Use of type I collagen green fluorescent protein transgenes to identify subpopulations of cells at different stages of the osteoblast lineage. J Bone Miner Res. 2002;17:15–25. doi: 10.1359/jbmr.2002.17.1.15. [DOI] [PubMed] [Google Scholar]
- 17.Kim JE, Nakashima K, de Crombrugghe B. Transgenic mice expressing a ligand-inducible cre recombinase in osteoblasts and odontoblasts: a new tool to examine physiology and disease of postnatal bone and tooth. Am J Pathol. 2004;165:1875–1882. doi: 10.1016/S0002-9440(10)63240-3. [DOI] [PMC free article] [PubMed] [Google Scholar]
- 18.Liu F, Woitge HW, Braut A, Kronenberg MS, Lichtler AC, Mina M, Kream BE. Expression and activity of osteoblast-targeted Cre recombinase transgenes in murine skeletal tissues. Int J Dev Biol. 2004;48:645–653. doi: 10.1387/ijdb.041816fl. [DOI] [PubMed] [Google Scholar]
- 19.Kamiya N, Ye L, Kobayashi T, Mochida Y, Yamauchi M, Kronenberg HM, Feng JQ, Mishina Y. BMP signaling negatively regulates bone mass through sclerostin by inhibiting the canonical Wnt pathway. Development. 2008;135:3801–3811. doi: 10.1242/dev.025825. [DOI] [PMC free article] [PubMed] [Google Scholar]
- 20.Maes C, Kobayashi T, Selig MK, Torrekens S, Roth SI, Mackem S, Carmeliet G, Kronenberg HM. Osteoblast precursors, but not mature osteoblasts, move into developing and fractured bones along with invading blood vessels. Dev Cell. 2010;19:329–344. doi: 10.1016/j.devcel.2010.07.010. [DOI] [PMC free article] [PubMed] [Google Scholar]
- 21.Feil R, Wagner J, Metzger D, Chambon P. Regulation of Cre recombinase activity by mutated estrogen receptor ligand-binding domains. Biochem Biophys Res Commun. 1997;237:752–757. doi: 10.1006/bbrc.1997.7124. [DOI] [PubMed] [Google Scholar]
- 22.Jiang X, Kalajzic Z, Maye P, Braut A, Bellizzi J, Mina M, Rowe DW. Histological analysis of GFP expression in murine bone. J Histochem Cytochem. 2005;53:593–602. doi: 10.1369/jhc.4A6401.2005. [DOI] [PubMed] [Google Scholar]
- 23.Wang YH, Liu Y, Maye P, Rowe DW. Examination of mineralized nodule formation in living osteoblastic cultures using fluorescent dyes. Biotechnol Prog. 2006;22:1697–1701. doi: 10.1021/bp060274b. [DOI] [PMC free article] [PubMed] [Google Scholar]
- 24.Cochrane RL, Clark SH, Harris A, Kream BE. Rearrangement of a conditional allele regardless of inheritance of a Cre recombinase transgene. Genesis. 2007;45:17–20. doi: 10.1002/dvg.20259. [DOI] [PubMed] [Google Scholar]
- 25.Holmbeck K, Bianco P, Chrysovergis K, Yamada S, Birkedal-Hansen H. MT1-MMP-dependent, apoptotic remodeling of unmineralized cartilage: a critical process in skeletal growth. J Cell Biol. 2003;163:661–671. doi: 10.1083/jcb.200307061. [DOI] [PMC free article] [PubMed] [Google Scholar]
- 26.Noden DM, Trainor PA. Relations and interactions between cranial mesoderm and neural crest populations. J Anat. 2005;207:575–601. doi: 10.1111/j.1469-7580.2005.00473.x. [DOI] [PMC free article] [PubMed] [Google Scholar]
- 27.Morriss-Kay GM, Wilkie AO. Growth of the normal skull vault and its alteration in craniosynostosis: insights from human genetics and experimental studies. J Anat. 2005;207:637–653. doi: 10.1111/j.1469-7580.2005.00475.x. [DOI] [PMC free article] [PubMed] [Google Scholar]
- 28.Jiang X, Iseki S, Maxson RE, Sucov HM, Morriss-Kay GM. Tissue origins and interactions in the mammalian skull vault. Dev Biol. 2002;241:106–116. doi: 10.1006/dbio.2001.0487. [DOI] [PubMed] [Google Scholar]
- 29.Yoshida T, Vivatbutsiri P, Morriss-Kay G, Saga Y, Iseki S. Cell lineage in mammalian craniofacial mesenchyme. Mech Dev. 2008;125:797–808. doi: 10.1016/j.mod.2008.06.007. [DOI] [PubMed] [Google Scholar]
- 30.Martin JF, Bradley A, Olson EN. The paired-like homeo box gene MHox is required for early events of skeletogenesis in multiple lineages. Genes Dev. 1995;9:1237–1249. doi: 10.1101/gad.9.10.1237. [DOI] [PubMed] [Google Scholar]
- 31.Zhou H, Mak W, Kalak R, Street J, Fong-Yee C, Zheng Y, Dunstan CR, Seibel MJ. Glucocorticoid-dependent Wnt signaling by mature osteoblasts is a key regulator of cranial skeletal development in mice. Development. 2009;136:427–436. doi: 10.1242/dev.027706. [DOI] [PubMed] [Google Scholar]
- 32.Behr B, Longaker MT, Quarto N. Craniosynostosis of coronal suture in twist1 mice occurs through endochondral ossification recapitulating the physiological closure of posterior frontal suture. Front Physiol. 2011;2:37. doi: 10.3389/fphys.2011.00037. [DOI] [PMC free article] [PubMed] [Google Scholar]
Associated Data
This section collects any data citations, data availability statements, or supplementary materials included in this article.