

Abstract
Individually, metabolic disorders are rare, but overall they account for a significant number of neonatal disorders affecting the central nervous system. The neonatal clinical manifestations of inborn errors of metabolism (IEMs) are characterized by nonspecific systemic symptoms that may mimic more common acute neonatal disorders like sepsis, severe heart insufficiency, or neonatal hypoxic-ischemic encephalopathy. Certain IEMs presenting in the neonatal period may also be complicated by sepsis and cardiomyopathy. Early diagnosis is mandatory to prevent death and permanent long-term neurological impairments. Although neuroimaging findings are rarely specific, they play a key role in suggesting the correct diagnosis, limiting the differential diagnosis, and may consequently allow early initiation of targeted metabolic and genetic laboratory investigations and treatment. Neuroimaging may be especially helpful to distinguish metabolic disorders from other more common causes of neonatal encephalopathy, as a newborn may present with an IEM prior to the availability of the newborn screening results. It is therefore important that neonatologists, pediatric neurologists, and pediatric neuroradiologists are familiar with the neuroimaging findings of metabolic disorders presenting in the neonatal time period.
Keywords: inborn errors of metabolism, neonates, neuroimaging, brain, MRI
INBORN ERRORS OF METABOLISM
INDIVIDUALLY, inborn errors of metabolism (IEMs) are very rare, but overall they account for a remarkable number of disorders of the pediatric central nervous system (CNS) (1). About 25% present in the neonatal period (2,3). Early diagnosis and institution of the appropriate therapy is mandatory in IEM to prevent death or ameliorate long-term neurological sequelae (3,4). The incidence, variability, complexity, and nonspecific clinical presentation of IEMs, however, present a diagnostic challenge for the neonatologists and neonatal neurologists. Neuroimaging plays a key role in the investigation of neonates with IEM. Therefore it is important to be familiar with the neuroimaging findings of IEM.
After a general introduction summarizing the classification, presentation, and common diagnostic work-up of IEM in neonates, we review the neuroimaging findings of the most common IEMs that may present in the neonatal period.
Classification of IEM
IEMs may be defined as a group of conditions in which there is a deficiency in production, synthesis, metabolism, storage, or transport of biochemical compounds. They can be classified into four major groups depending on the mechanism leading to the clinical presentation: 1) intoxication disorders, 2) energy production disorders, 3) disorders of the biosynthesis and breakdown of complex molecules, and 4) neurotransmitter defects (2).
Intoxication disorders are typically characterized by a variable symptom-free interval, which is followed by symptoms of acute and/or chronic intoxication of the CNS. In these disorders, the metabolic error leads to accumulation of toxic metabolites proximal to the metabolic block. Because these metabolites cross the placenta in utero and are metabolized by the mother, affected newborns are typically asymptomatic at birth. Subsequent deterioration occurs due to postnatal accumulation of toxic metabolites. Aminoacidopathies and organic acidemias are the most important examples.
Energy production disorders are caused by a deficiency in energy production or utilization. The symptoms tend to be multisystemic and in particular involve tissues with a high metabolic rate such as the brain, heart, and skeletal muscles. Mitochondriopathies are the most common energy production disorders.
Disorders of the biosynthesis and breakdown of complex molecules involve the abnormal synthesis or degradation of complex molecules leading to accumulation of these molecules such as in lysosomal or peroxisomal disorders. The symptoms are slowly progressive, permanent, and independent of food intake. The lysosomal and peroxisomal (with the exception of early onset peroxisomal biogenesis disorders such as Zellweger syndrome and neonatal adrenoleukodystrophy) do not typically present with neonatal encephalopathy, but may be identified in the newborn period with neonatal screening.
Neurotransmitter disorders such as pyridoxine and pyridoxal 5′-phosphate dependency are increasingly recognized causes of severe metabolic encephalopathy usually starting in the neonatal period. They typically affect monoamine synthesis and glycine or GABA metabolism. Drug-resistant seizures are typically seen on presentation.
Neonatal Manifestation of IEM
The neonatal manifestation of IEM is usually characterized by nonspecific symptoms or findings including neurological abnormalities (lethargy, poor feeding, vomiting, muscular hypotonia, irritability, apnea, and/or seizures), metabolic acidosis, hypoglycemia, cardiac disorders and liver disease (Table 1) (2–8). All these symptoms and findings may also be found in more common acute neonatal disorders like sepsis, severe heart insufficiency (duct dependent congenital heart disorders), or hypoxic-ischemic encephalopathy (HIE). IEM may also be complicated by concurrent ischemia or immune system failure. An initial misdiagnosis or a delayed diagnosis of IEM is, therefore, common. Maintaining a high index of suspicion of IEM in critically ill neonates is essential. Information from the family history such as parental consanguinity or unexplained previous neonatal deaths may point out IEM. A symptom-free interval followed by a clinical deterioration distinguishes intoxication disorders from HIE. Additionally, unexplained comatose state, progression of the neurological symptoms, dysmorphic features, or hepatosplenomegaly should suggest the possibility of IEM. Occasionally, IEM may predispose to intrauterine demise, intrauterine growth restriction (IUGR), or preterm birth. Prematurity is, however, rarely associated with IEM.
Table 1.
Clinical Findings of the Most Common Inborn Errors of Metabolism Presenting in the Neonatal Period
| Disease | OMIM | Clinical findings | Treatment |
|---|---|---|---|
| Urea cycle disorders | Variable* | Increasing feeding difficulties, vomiting, lethargy, hypothermia, hyperpnea | Available |
| Maple syrup urine disease | 248600 | Poor feeding, vomiting, stupor, dystonia, fluctuating ophthalmoplegia, seizures | Available |
| Glutaric aciduria type 1 | 231670 | Macrocephaly, muscular hypotonia, irritability, jitteriness | Available |
| Pyruvate dehydrogenase complex deficiency |
Variable* | Severe muscular hypotonia, lethargy, weak sucking, microcephaly, facial dysmorphic signs, tachypnea, epileptic seizures |
Available |
| Pyridoxine-dependent epilepsy | 266100 | Epileptic seizures (typically frequent, multifocal or generalized, and myoclonic), tonic symptoms, abnormal eye movements, grimacing, irritability |
Available |
| Creatine deficiency syndromes | Variable* | Epileptic seizures | Partially availablea |
| Sulfite oxidase deficiency | 272300 | Seizures, feeding difficulties, vomiting, facial dysmorphia | Experimentalb |
| 252150 | |||
| Krabbe disease | 245200 | Irritability, spasticity, absent motor development | Experimentalc |
| Isolated complex I deficiency | 252010 | Severe respiratory distress, apnea, muscular hypotonia, weakness, seizures, cardiac hypertrophy, hepatomegaly |
Not available |
| Isolated complex III deficiency | 124000 | Severe encephalopathy | Not available |
| Complex IV deficiency | 220110 | Weakness, hypotonia, respiratory insufficiency, progressive lethargy | Not available |
| Zellweger syndrome | 214100 | Severe muscular hypotonia, poor swallowing and sucking, irritability, craniofacial abnormalities, cataracts, pigmentary retinopathy, hepatomegaly, areflexia |
Not available |
| Phosphomannomutase 2 deficiency or CDG1a |
212065 | Muscular hypotonia, alternating strabismus, rolling eye movements, areflexia, facial dysmorphic signs, inverted nipples, abnormal fat distribution, feeding problems, joint contractures, involvement of heart, liver, kidneys, and coagulation factors |
Not available |
| Smith-Lemli-Opitz syndrome | 270400 | Microcephaly, abnormal sucking, swallowing/feeding difficulties, severe muscular hypotonia, cranial dysmorphic features, syndactyly of second and third toes, genital abnormalities, congenital heart defects, renal hypoplasia, gastrointestinal anomalies |
Not available |
| Nonketotic hyperglycinemia | 605899 | Progressive lethargy, hypotonia, myoclonic jerks, seizures, apnea, coma, hiccups, abnormal ocular movements |
Not available |
Variable, depending on the deficient enzyme/mutated gene; CDG, congenital disorder of glycosylation; OMIM, Online Mendelian Inheritance in Man data base.
Creatine supplementation is effective for disorders of creatine synthesis, but not for creatine transporter deficiencies.
Substitution therapy with purified cyclic pyranopterin monophosphate (Reference 119).
Allogeneic hematopoietic stem-cell transplantation (Reference 97).
Newborn Screening for Inherited Metabolic Disease
The newborn screening (NS) for IEM allows early diagnosis of potentially life-threatening or debilitating inherited disorders (9,10). NS was initially started for phenylketonuria (PKU) in 1959 by Guthrie and nowadays more than 60 disorders may be detected by analysis of acylcarnitine and amino acids using tandem mass spectrometry. For a specific IEM to be considered for NS, the following criteria are usually considered: a significant morbidity or mortality, a known pathomechanism, the possibility of prevention or adequate treatment, the availability of an easy, inexpensive rapid screening test, and a reliable follow-up confirmatory test. Additionally, the cost-to-benefit ratio of incorporating the testing in the NS should be favorable. NS programs, however, differ significantly worldwide with regard to the disorders tested, the type of testing performed, and the turnaround time for the results. Therefore, not only does a normal NS not rule out all IEM, but there may be false-positive and false-negative results and the results may not be available if the neonate presents within the first few days of life. A negative NS should not decrease the index of suspicion for IEM in sick neonates (9,11). Neonatologists, geneticists, pediatric neurologists, and neuroradiologists should remain vigilant for diagnosing IEM as early as possible.
Diagnostic Work-Up
Once history and clinical presentation suggest a metabolic disorder, the diagnostic work-up and general supportive measures, if necessary, are undertaken simultaneously. Laboratory investigations of blood, urine, and/or cerebrospinal fluid (CSF) play the most important diagnostic role (for review, see Leonard and Morris, 2006 (3)). The storage of adequate amounts of plasma, urine, blood (on filter paper), and CSF is an important element in the diagnosis. If possible, all biologic data should be collected at the same time (3).
The diagnostic work-up of newborns with suspicion of metabolic disorders may also include not only laboratory investigations, but depending on the symptoms, chest x-ray, cardiac ultrasound (US), abdomen US, electrocardiography, and electroencephalography. Neuroimaging is a particularly useful adjunct and should not be delayed until laboratory results are known, as it may provide early crucial clues to the diagnosis.
Neuroimaging
Neuroimaging of newborns with IEM typically takes advantage of US, computed tomography (CT), and conventional and advanced magnetic resonance imaging (MRI) techniques. In neonatal IEM, US is a reliable, first-line imaging modality that can be performed at the bedside for early detection of cysts, calcifications, structural brain abnormalities, and edema or altered white matter echogenicity, which can all be suggestive of metabolic disorders (12). Due to excellent anatomic imaging, MRI is considered the most sensitive and specific neuroimaging tool for neonatal IEM (Tables 2, 3). Moreover, the integration of advanced MRI techniques such as diffusion-weighted imaging (DWI), diffusion tensor imaging (DTI), and magnetic resonance spectroscopy (1H-MRS) allows a more accurate and reliable anatomical-functional diagnosis (13). DWI provides image contrast based on differences in diffusion of water molecules within the brain and is crucial to perform when imaging neonates (14,15). DWI may demonstrate abnormalities when the routine T1- and T2-weighted images are normal and is helpful in differentiating between cytotoxic (high intensity on DWI and low apparent diffusion coefficient [ADC] values representing restricted diffusion) and vasogenic (increased ADC values representing increased diffusion) edema. Multiplanar DWI is useful and is not hampered (as in older children) by susceptibility artifact from the sphenoid sinuses. Diffusion tensor imaging (DTI) is becoming more widely available and allows the study of 3D shape of diffusion by measuring the full tensor of the diffusion (16). Qualitative and quantitative 1H-MRS is a powerful noninvasive tool to study various brain metabolites (17). Confirmation of age-appropriate peaks, detection of abnormal peaks such as glycine and lactate, absolute quantification of cerebral metabolites, or loss of peaks such as creatine may help to identify metabolic diseases such as nonketotic hyperglycinemia, disorders of energy metabolism, and creatine deficiency syndromes (17,18).
Table 2.
Neuroimaging Findings of the Most Common Inborn Errors of Metabolism
| Disease | Neonatal conventional MRI | Neonatal 1H-MRS | Neonatal DWI | MRI in older children |
|---|---|---|---|---|
| Urea cycle disorders | diffuse generalized cytotoxic edema (cerebral cortex, subcortical wm); abnormal signal of BG (T1-/T2-hyper of the globi pallidi, T2-hyper of putamina and caudate nuclei) |
prominent glutamine/ glutamate peaks |
scalloped ribbon of restriction
at the depth of sulci |
ulegyria, sparing of occipital and perirolandic cortex |
| Maple syrup urine disease | increased signal of myelinated structures (cerebellar and perirolandic, dorsal brainstem, cerebral peduncles, PLIC, thalami and globi pallidi) |
branched-chain amino and keto acids (0.9 ppm) |
Diffusion restriction of myelinated structures (cerebellar and perirolandic wm, dorsal brainstem, cerebral peduncles, PLIC, thalami and globi pallidi), superimposed vasogenic edema of unmyelinated WM |
profound lack of myelination |
| Glutaric aciduria type 1 | enlarged fronto-temporal CSF spaces, wide Sylvian fissures |
probably normal (if no acute encephalopathy) |
probably normal (if no acute encephalopathy) |
increased signal of BG (mostly putamen and caudate), caudate atrophy |
| Pyruvate dehydrogenase complex deficiency |
CC dysgenesis, MCM, subcortical heterotopias, pachygyria, cortical atrophy, T2-hyper lesions BG (putamen) and wm (cerebellum, PLIC and occipital lobes), subependymal cysts |
lactate doublet | diffusion restriction of BG and wm (cerebellum, PLIC and occipitally) |
Leigh-like findings, delayed myelination, atrophy |
| Mitochondriopathies | cerebral atrophy, T2-hyper lesions (dorsal midbrain, cerebral peduncles, pontine corticospinal tracts, central tegmental tracts, dorsal medulla, subcortical wm), subependymal cysts |
lactate doublet | restriction of dorsal midbrain, cerebral peduncles, pontine corticospinal tracts, central tegmental tracts, dorsal medulla, subcortical wm |
Leigh-like changes of the basal ganglia, atrophy of BG and wm |
| Sulfite oxidase deficiency* | extensive generalized edema (frontal and temporal cortex and thalami may be spared), cerebellar hypoplasia |
S-sulocysteine (3.61 ppm), taurine (3.42 and 3.24 ppm), cysteine (2.92 and 2.97 ppm) |
generalized diffusion restriction (frontal and temporal cortex and thalami may be spared) |
rapid evolution to extensive cystic lesions in the cerebral wm and global cortical atrophy |
| Zellweger syndrome | polymicro-/pachygyria (particularly peri-Sylvian and parieto-temporo-occipital lobes), hypomyelination, subependymal cysts |
increased lactate and lipids (0.9 -1.33 ppm), decreased NAA |
normal | wm signal abnormality (generalized, cerebellum), atrophy, polymicro-/ pachygyria |
| Congenital disorder of glycosylation type 1a |
early maybe normal or ponto-cerebellar hypoplasia, abnormal signal cerebellar wm, intracranial hemorrhages |
probably normal | probably normal | superimposed cerebellar atrophy, supratentorial atrophy, stroke-like lesions |
| Smith-Lemli-Opitz syndrome | ventriculomegaly, hypoplastic frontal lobes and cerebellum, CC dysgenesis, holoprosencephaly |
lipid peak (0.8-1.5 ppm) | normal | similar to the neonatal findings |
| Krabbe disease | thick optic nerve and chiasm may be first clue, T2-hyper lesions in cerebellar wm |
increased myo-inositol and choline, decreased NAA |
reduction of subcortical wm, caudate, ALIC |
T2-hyper lesions in cortical spinal tracts and thalami |
| Pyridoxine-dependent epilepsy | usually normal; thinning of the isthmus of the CC, MCM, findings similar to HIE |
unknown | maybe abnormal (findings similar to HIE) |
wm abnormalities, ventriculomegaly |
| Nonketotic hyperglycinemia | T2-hyper lesions of the myelinated wm tracts, CC agenesis, vermian hypoplasia |
glycine peak | restricted diffusion of myelinated wm tracts |
delayed myelination, ventriculomegaly, enlarged subarachnoid spaces |
| Creatine deficiency syndromes | normal |
absent or severely deficient
creatine peak |
probably normal | probably normal |
| GLUT1 deficiency | normal | probably normal | probably normal | probably normal |
ALIC, anterior limb of the internal capsule; BG, basal ganglia; CC, corpus callosum; CDG, Congenital disorder of glycosylation; CSF, cerebrospinal fluid; HIE, hypoxic-ischemic encephalopathy; hyper, hyperintense; hypo, hypointense; MCM, mega cisterna magna; NAA, N-acetyl aspartate; PLIC, posterior limb of the internal capsule; wm, white matter.
Sulfite oxidase deficiency include both forms: isolated sulfite oxidase deficiency and molybdenum cofactor deficiency; bold, pathognomonic or highly suggestive MRI or MRS features.
Table 3.
Neuroimaging Pattern-Recognition Approach in Neonatal Inborn Errors of Metabolism
| Suggestive neuroimaging findings | Diseases | |
|---|---|---|
| Structural abnormalities | Holoprosencephaly | Smith-Lemli-Opitz syndrome |
| Polymicrogyria | Zellweger syndrome | |
| Pachygyria | Zellweger syndrome | |
| Glutaric aciduria type 2 | ||
| Subcortical heterotopias | Pyruvate dehydrogenase deficiency | |
| Pyruvate carboxylase deficiency | ||
| Glutaric aciduria type 2 | ||
| Corpus callosum dysgenesis | Nonketotic hyperglycinemia | |
| Pyridoxine dependent epilepsy | ||
| Glutaric aciduria type 2 | ||
| Cerebellar hypoplasia | Congenital disorders of glycosylation | |
| Sulfite oxidase deficiency* | ||
| Zellweger syndrome | ||
| Pyruvate dehydrogenase deficiency | ||
| Smith-Lemli-Opitz syndrome | ||
| Nonketotic hyperglycinemia | ||
| Glutaric aciduria type 2 | ||
| Pontine hypoplasia | Congenital disorders of glycosylation | |
| Germinolytic cysts | Zellweger syndrome | |
| Oxidative phosphorylation disorders | ||
| Pyruvate dehydrogenase deficiency | ||
| Pyruvate carboxylase deficiency | ||
| Wide Sylvian fissure | Glutaric aciduria type 1 | |
| White matter signal abnormalities | Generalized | Zellweger syndrome |
| Sulfite oxidase deficiency* | ||
| Pelizaeus Merzbacher disease | ||
| Vanishing white matter disease | ||
| Brainstem | Oxidative phosphorylation disorders | |
| Nonketotic hyperglycinemia | ||
| Myelinated white matter | Maple syrup urine disease | |
| Propionic acidemia | ||
| Temporal lobes | Menkes disease | |
| Gray matter signal abnormalities | Basal ganglia + thalami | Oxidative phosphorylation disorders |
| Pyruvate dehydrogenase deficiency | ||
| Basal ganglia | Urea cycle disorders | |
| Globi pallidi | Sulfite oxidase deficiency* | |
| Thalami | Maple syrup urine disease | |
| Propionic acidemia | ||
| Insular or perirolandic | Urea cycle disorders | |
| Early cystic degeneration | Sulfite oxidase deficiency* | |
| Urea cycle disorders | ||
| Oxidative phosphorylation disorders | ||
| Vanishing white matter disease | ||
Sulfite oxidase deficiency include both forms: isolated sulfite oxidase deficiency and molybdenum cofactor deficiency.
In the remainder of this review we summarize and describe the most common and well-defined IEM presenting during the newborn period and their neuroimaging findings.
INTOXICATION DISORDERS
Urea Cycle Disorders
Urea cycle disorders are caused by deficiency of the five enzymes converting ammonia to urea (Krebs–Henseleit cycle). Deficiency of four different enzymes are typically symptomatic in the neonatal period: carbamyl phosphate synthetase 1 deficiency (OMIM 237300), ornithine transcarbamylase deficiency (OTC, OMIM 311250), citrullinemia (OMIM 215700), and arginosuccinate lyase deficiency (OMIM 207900) (19).
Newborns with urea cycle disorders usually present about 1 to 5 days after birth with increasing feeding difficulties, vomiting, subsequent lethargy, hypothermia, and hyperpnea (20). Hyperammonia in plasma and CSF is suggestive of urea cycle disorders, particularly when associated with respiratory alkalosis, a normal anion gap and blood glucose, absence of ketoacidosis, and normal or reduced levels of urea.
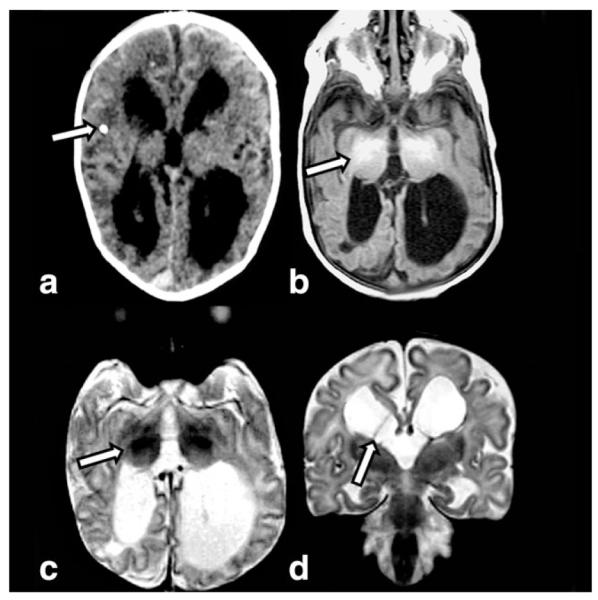
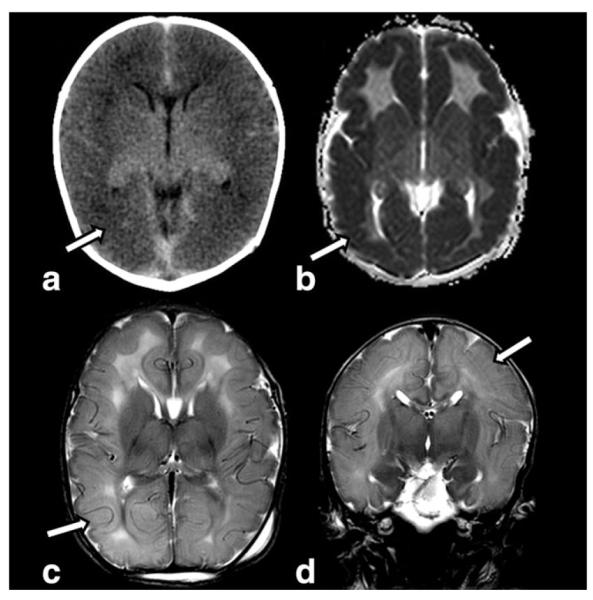
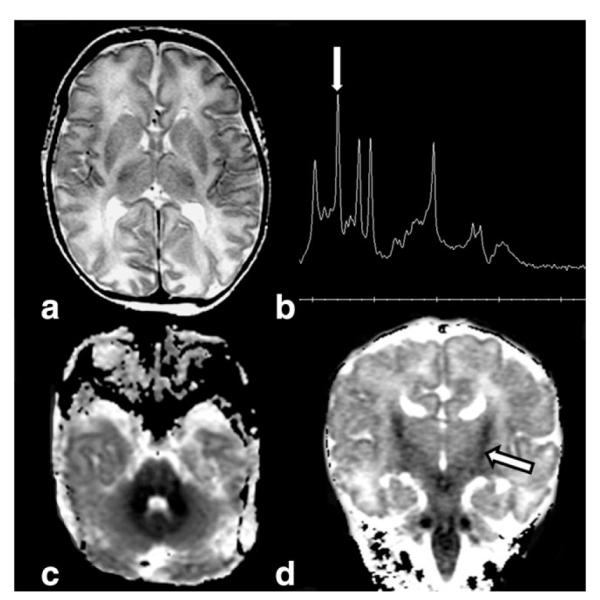
The neuroimaging pattern of neonatal urea cycle disorders is characterized by diffuse generalized edema involving the cerebral cortex and the subcortical white matter (21–24). The T1-hypointense and T2-hyperintense signal of cerebral edema seems to be caused by increased levels of glutamine, which results from the metabolism of ammonia (25). Glutamine is osmotically active, likely leading to astrocytic swelling and cytotoxic edema. Additionally, the basal ganglia may show abnormal signal intensity including T1-and T2-hyperintensity of the globi pallidi (Fig. 1) and T2-hyperintensity of the putamina and caudate nuclei (21). The pattern of globus pallidus and putaminal involvement, while sparing the thalamus, allows distinguishing urea cycle disorders from HIE-related brain injury. T1-hyperintensity in the deep insular and peri-Rolandic cortex has also been reported, while the cerebellum is typically spared. Basal ganglia as well as the insular and peri-Rolandic cortex are the highest metabolic active regions at term and are consequently the most vulnerable areas for hypoperfusion injury (21). The T1 and T2 findings are relatively nonspecific, however. It is the DWI scalloped ribbon pattern of injury to the depth of the sulcus that strongly supports the diagnosis of urea cycle disorders (Fig. 1). 1H-MRS typically shows elevated glutamine/glutamate peaks and an abnormal lactate/lipid complex (21,25) (Fig. 1).
Figure 1.
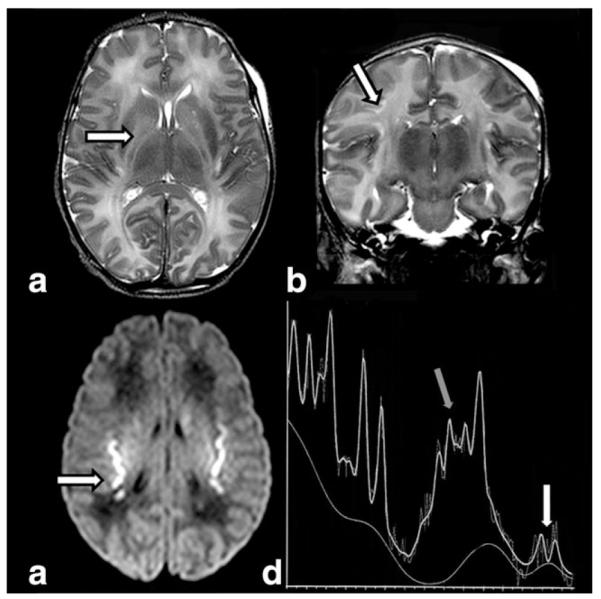
Axial T2W (a) image in a 5-day-old infant with citrullinemia demonstrates increased signal intensity in the globi pallidi (arrow), posterior caudate nuclei, and surrounding the internal capsule. Coronal T2W image (b) reveals increased signal intensity at the gray-white interface at the depth of the parietal sulci (arrow). Axial DWI (c) shows the typical scalloped diffusion restriction at the insular gray-white junction (arrow). MRS (short TE) (d) reveals prominent glutamine/glutamate peaks (gray arrow) and a lactate doublet (white arrow).
Arginase 1 deficiency, which typically lacks hyperammonemia, usually presents later in life. Affected newborns who do present with hyperammonemia will have similar MRI and DWI findings to the urea cycle disorders that typically present during the neonatal period (26).
Disorders of Amino and Organic Acids
Disorders of Catabolism of Branched-Chain Amino Acids
Maple syrup urine disease (MSUD, OMIM 248600) is the prototype of the disorders of catabolism of branched-chain amino acids (BCAA; leucine, isoleucine, and valine) and is caused by deficiency of the branched-chain keto-acid (BCKA) dehydrogenase enzyme (27,28). Usually, MSUD presents at the end of the first week of life with poor feeding, vomiting, and stupor followed by dystonia (rhythmic boxing and cycling movements of the limbs), fluctuating ophthalmoplegia, and seizures (29). Early detection is critical, as initiation of therapy within the first 5 days may be associated with near normal cognitive outcome (30). The diagnosis is suggested by the odor of maple syrup or burnt sugar in cerumen at 24 to 48 hours of life or in urine during the latter part of the first week and is confirmed by detecting increased values of BCAAs and BCKAs in blood and urine (29). Neuroimaging, including CT or MRI, can suggest the diagnosis. DWI, however, demonstrates the typical MSUD pattern exquisitely. Two types of brain edema may be seen in MSUD. Intramyelinic edema, intense edema affecting the myelinated white matter (cerebellar white matter, dorsal brainstem, cerebral peduncles, posterior limb of the internal capsule, and peri-Rolandic cerebral white matter), thalami, and globi pallidi (both structures have a high density of myelinated fibers) may be observed. Intramyelinic edema provides the typical pattern of “MSUD edema”: hyperintense on T2-weighted images (Fig. 2a) and DWI (Fig. 2b) and hypointense on T1-weighted images, with decrease in both ADC (Fig. 2b) and fractional anisotropy (FA) values (31–34). Intramyelinic edema is thought to be caused by energy failure resulting in a decreased Na+/K+ ATPase activity due to accumulation of BCKA. An accumulation of water molecules between the myelinic lamellae follows and splits the myelin layers. The resulting myelin instability and ongoing fiber destruction can be detected by DTI (decreased FA values) (33,34). Delayed myelination and white matter atrophy are possible long-term sequelae. The intramyelinic edema may regress, but frequently persists after initiation of therapy (33). In addition to the intramyelinic edema, a superimposed vasogenic edema involving the unmyelinated brain structures may be observed. This second type of edema is due to blood–brain barrier disruptions causing global water increase in the extracellular spaces and is present only during the acute metabolic decompensation or crisis (33,34).
Figure 2.

Axial T2W images (a) in a 10-day-old neonate with MSUD show hyperintense signal and swelling of the cerebellar white matter, dorsal pons, corticospinal tracts in the basis pontis, midbrain, posterior limb of the internal capsule, thalami, and central corona radiata. DWI images (b, top row) and ADC maps (b, bottom row) show hyperintense signal on DWI and hypo-intensity on ADC maps representing restricted diffusion in the cerebellar white matter, dorsal pons, corticospinal tracts in the basis pontis, midbrain, posterior limb of the internal capsule, thalami, and central corona radiata.
The 1H-MRS findings in MSUD include a lactate peak (anaerobic glycolysis because of energy failure), a peak at 0.9 ppm representing BCAAs and BCKAs (Fig. 3), and an increased N-acetyl aspartate (NAA) / creatine (Cr) ratio indicating neuronal death (31). This peaks may be absent in newborns who have already undergone urgent dialysis/hemofiltration prior to MRI/MRS.
Figure 3.

Short-echo-time (TE = 35 msec) water-suppressed 1H-MRS spectrum from the posterior limb of the internal capsule in a 10-day-old newborn with MSUD demonstrates an abnormal wide peak at 0.9 ppm representing BCAAs and BCKAs.
Isovaleric acidemia (IVA, OMIM 243500) is an additional disorder of the BCAA catabolism. IVA is due to mutations in the isovaleric acid CoA dehydrogenase gene and the affected patients are reported to have a “sweaty feet” odor of their urine. An increased frequency of intracranial hemorrhages (subarachnoid, intra- or periventricular, cerebellar, and diffuse, petechial lesions in the white matter) has been reported in IVA. Hemorrhages may be the result of various factors such as CNS edema due to accumulation of abnormal organic acids, thrombocytopenia, coagulopathy secondary to associated liver disease, and as complication of anticoagulation therapy during hemofiltration (35,36) (Fig. 4).
Figure 4.
13-day-old male infant with isovaleric acidemia presented with lethargy and jitteriness and smelled “sweaty.” Multiplanar gradient recalled (MPGR) image (a) demonstrates multifocal small hemorrhages in the cerebellum (arrow). DWI (b) reveals low signal without diffusion restriction of the white matter of the corona radiata. Axial (c) and coronal (d) T2W images show mild increased signal of the white matter (arrows).
Propionic Acidemia
Propionic acidemia (PPA, OMIM 606054) presents during the neonatal period with deterioration after a short symptom-free interval. Hyperammonemia is a feature.
Diffuse swelling may be present on MRI of neonatal onset PPA (Fig. 5). Basal ganglia may be normal in PPA during neonatal life. Lesions of the globi pallidi, volume loss, and delay in myelination are typically identified during later episodes of decompensation. MRS in one series of PPA patients demonstrated decreased NAA, decreased glutamate and glutamine, and increased lactate during encephalopathic episodes when compared with MRS during metabolically stable periods (37). Imaging reflects the changes seen on pathologic specimens. White matter spongiosis has been shown in pathologic specimens of neonatal PPA, with involvement at the gray/white matter junction of the cortex and the white matter tracts of the brainstem, while histopathology in the older child demonstrates involvement of the Purkinje cells and granular cell layers in the cerebellum as well as of the basal ganglia (38). Finally, an increased frequency of intracranial hemorrhages has been reported in PPA.
Figure 5.
This 4-day-old infant with propionic acidemia presented with poor feeding, lethargy, hypothermia, bradycardia, and markedly elevated ammonia. T1W (a) image shows focal increased signal in the lateral thalami (arrow), while T2W image (b) demonstrates edema surrounding the internal capsule (arrow) and globi pallidi. Axial (DWI (c) reveals restricted diffusion in the hippocampi (arrow) and mesencephalon. Coronal DWI (d) demonstrates restricted diffusion in the internal capsule and adjacent globi pallidi (arrow).
Methylmalonic Acidemia
Methylmalonic acidemia (MMA, OMIM 251000) presents in the neonatal form with deterioration after a short symptom-free interval. Hyperammonemia is a feature.
Diffuse swelling may be present on MRI of neonatal onset MMA (Fig. 6). Imaging in neonatal MMA may also show swelling, while later imaging reveals volume loss, delay in myelin maturation, calcification of the basal ganglia, and focal necrosis of the globi pallidi (39). While neonatal imaging reports are less common than reports in the older child, imaging reflects the changes seen on pathologic specimens. Death of immature neurons of the germinal matrix, migrating neuro-blasts, cerebellar granular cell layers, and dentate gyrus of the hippocampus has been described in neonatal MMA, as have necrotic foci in the basal ganglia, thalami, hypothalamus, and brainstem. White matter spongiosis of the depth of sulcus and myelinated nerve fibers of the brainstem have also been reported. In older children, histopathology demonstrates involvement of the globi pallidi, hypomyelination, and spongiosis of the white matter and small hemorrhagic foci (40–42). Additionally, an increased frequency of intracranial hemorrhages has also been reported in MMA.
Figure 6.
This 6-day-old small for gestational age term newborn with methylmalonic acidemia presented with acute encephalopathy and hyperammonemia. T1W image (a) reveals lack of normal increased signal of myelin in posterior limb of the internal capsule (PLIC sign). Slightly increased signal surrounding the posterior limb of the internal capsule (arrow) is shown on T2W axial image (b). Coronal DWI (c) demonstrates extensive involvement of the corticospinal tracts (arrow) as they course through the posterior limbs of the internal capsule to brainstem. Additional foci of restriction are present in the cerebellum and the cingulate gyrus (arrows) on coronal DWI (d).
Glutaric Aciduria Type 1 (OMIM 231670)
Glutaric aciduria type 1 (GA1) is an inborn error of lysine, hydroxyline, and tryptophan catabolism (43). Typically, GA1 presents in later infancy as an acute encephalopathy with dystonia and dyskinesia due to necrosis of the basal ganglia, particularly affecting the putamina. Almost all neonates present with macrocephaly and subtle neurological signs such as hypotonia, irritability, and jitteriness.
Neonatal neuroimaging shows enlarged frontotemporal CSF spaces, wide Sylvian fissures, and a large cavum septi pellucidi (44). These findings are suggestive of GA1, particularly in populations with overrepresentation of GA1. Detection by NS and institution of a therapy (carnitine supplementation, dietary measures) in a pre-encephalopathic state is important and may result in a normal development or lessening of the neurologic sequelae (45).
ENERGY PRODUCTION DISORDERS
Pyruvate Dehydrogenase Complex Deficiency
Pyruvate dehydrogenase complex (PDHc) deficiency is an important cause of encephalopathy associated with lactic acidosis. It is caused by mutations in the multi-enzyme PDHc that catalyzes the conversion of pyruvate to acetyl-CoA (46). In patients with PDHc-deficiency, four different neurological presentations have recently been reported (47).
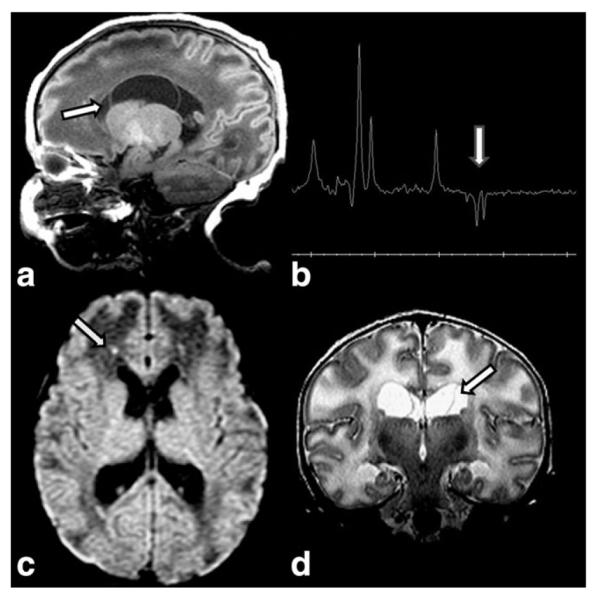
Neonatal presentation in PDHc-deficiency typically consists of severe muscular hypotonia, lethargy, weak sucking, microcephaly, facial dysmorphic signs, and tachypnea (47). Epileptic seizures occur in about one-third of the patients. Marked lactic acidosis with increased level of lactate in blood and CSF or only in CSF is mandatory for the diagnosis. Neuroimaging may show dysgenesis of the corpus callosum (complete callosal agenesis, however, has not been reported), mega cisterna magna, subcortical heterotopias, pachygyria, germinolytic cysts (mostly located in the frontal horns of the lateral ventricles and in the caudothalamic grooves), cortical atrophy, and T2-hyperintense lesions in the basal ganglia (particularly in the putamen) and white matter (cerebellum, posterior limb of the internal capsule, and occipitally, associated with increased ADC values) (47,48). Cerebral dysgenesis, a well developed periventricular leukomalacia (PVL) and germinolytic-cysts are the sequelae of the prenatal onset of PDHc-deficiency. Cerebral dysgenesis may be due to the critical role of PDHc in energy metabolism of proliferating and migrating cells, while the germinolytic cysts are clastic lesions that may result from an acute prenatal energy failure. 1H-MRS demonstrates a lactate peak at 1.33 ppm (Fig. 7).
Figure 7.
Ultrasound (not shown) in a 2-day newborn with PDH deficiency revealed ventriculomegaly due to central volume loss. CT (a) at 7 days of age confirmed central white matter loss and calcifications (arrow). Axial T1W MR image (b) performed at 21 days of age in the same infant confirms well-established PVL with increased signal intensity of the atrophied thalami in keeping with status marmoratus (arrow). T2W axial image (c) shows PVL and status marmoratus (arrow). Coronal T2W image (d) reveals septations from large subependymal cysts (arrow) in the anterior horns, vertical hippocampi, and a very thin, atrophied corpus callosum above the septum pellucidum.
The neonatal form of pyruvate carboxylase deficiency (PCD, OMIM 312170) presents with clinical and neuroimaging findings (including PVL already well developed in the third trimester of pregnancy and at birth) similar to those seen in PDHc-deficiency and lactic acidemia (Fig. 8). Macrocephaly is common (49). Hypertonia, rigidity, high-amplitude tremor, unusual ocular movements, hypoglycemia, lactic acidosis, secondary hypercitrullinemia, hyperammonemia, and cystic PVL with a frontal predominance already identifiable at birth have been reported in severe neonatal onset PCD-“B” type (French phenotype) (50). One survivor of neonatal onset PCD with lactic acidosis has demonstrated peripheral increased signal of subcortical white matter at 18 months of age in follow-up, similar to findings seen in follow-up of PPA. Brain MRI during the neonatal period was not performed in PCD-“B” (51).
Figure 8.
MRI in a full-term newborn with macrocrania, hypoglycemia and lactic acidosis due to pyruvate carboxylase deficiency demonstrates a large caudothalamic groove cyst (arrow) on T1W sagittal image (a). TE 144 MRS (b) shows a lactate doublet (arrow). Axial DWI (c) reveals puncta of diffusion restriction (arrow), while coronal T2W image (d) confirms large cysts (arrow), and diffuse white matter edema.
Mitochondrial Oxidative Phosphorylation Disorders
Oxidative phosphorylation (OXPHOS) disorders may present in the neonatal period (52,53). The OXPHOS system comprises the mitochondrial respiratory chain complexes (complexes I–IV) and adenosine triphosphatase (complex V). In newborns, deficiency of complex I, II, and IV have been reported. Features of OXPHOS disorders at birth and before include fetal hydrops, IUGR, prematurity, poor feeding, vomiting, lactic acidosis, and lack of a symptom-free interval following birth (52,54).
Isolated complex I deficiency (OMIM 252010) is the most common enzymatic defect of the OXPHOS disorders. It may cause a wide range of clinical disorders, ranging from lethal neonatal disease to adult-onset neurodegenerative disorders. Neonatal symptoms/findings are severe respiratory distress, apnea, muscular hypotonia, weakness, seizures, cardiac hypertrophy, and/or hepatomegaly. Marked lactic acidosis with elevated blood lactate and pyruvate levels are consistent findings. Neuroimaging reported in neonates includes cerebral atrophy, white-matter abnormalities, involvement of the posterior columns in the lower brainstem, pontine corticospinal tracts and subcortical white matter, and an HIE-like involvement of the cortex and thalami in the absence of obstetrical history of birth asphyxia (Fig. 9). Extensive cavitations may result (54). 1H-MRS demonstrates a lactate doublet in the affected areas (Fig. 9). Neuroimaging features of Leigh syndrome, as seen in older infants, are rare in newborns (Fig. 10).
Figure 9.
T1W axial image (a) in a 41-week gestational age infant with normal Apgar scores, now 3 days of age with seizures and lactic acidosis due to complex 1 deficiency, demonstrates low signal in the frontal white matter (arrow). MRS (TE 144) (b) reveals a lactate doublet (arrow). T2W coronal image (c) confirms white matter edema (arrow). DWI (d) reveals diffusion restriction in the cortical spinal tracts (arrow), more than expected for myelinating tracts.
Figure 10.
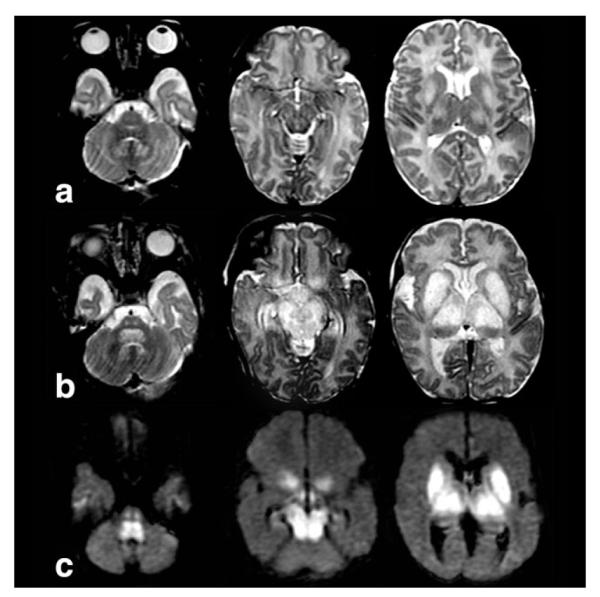
Axial T2W images at 2 weeks of age (a), axial T2W images at 4 weeks of age (b), and DWI images (c) at 2 weeks of age in a newborn with mutation in the ND3 gene show Leigh-like swelling, T2-hyperintensity, and restricted diffusion in the nuclei dentati, central tegmental and corticospinal tracts, putamina, globi pallidi, and thalami.
Isolated complex III deficiency (OMIM 124000) may present in its neonatal form with lactic acidosis, hypoglycemia, hypotonia, renal tubulopathy, hepatopathy, and severe encephalopathy (55). Mild and severe neuroimaging phenotypes have been reported in pediatric cases. These have included brainstem lesions resembling those seen in Leigh syndrome (T2-hyperintensities in the dorsal midbrain, particularly in the periaqueductal region, cerebral peduncles, central tegmental tracts, and dorsal medulla) may be found. Severe atrophy and white matter abnormal signal may be seen in follow-up of neonatal cases. However, reported acute findings on neuroimaging performed in the neonatal period are sparse and include normal studies (56).
Complex IV (cytochrome-c oxidase) deficiency (OMIM 220110) usually presents in newborns with myopathic features (weakness, hypotonia, and respiratory insufficiency) and lactic acidosis. Involvement of the CNS has been reported with progressive lethargy (57). Neuroimaging in childhood may be variable ranging from normal to the typical “Leigh pattern” of tissue injury (56,57).
Generally, neuroimaging may be helpful in the diagnosis of OXPHOS defects in newborns, although the most characteristic findings described in older children are not commonly seen during the neonatal period (56).
Sulfite Oxidase Deficiency and Molybdenum Cofactor Deficiency
Sulfite oxidase deficiency (SOD) can occur isolated (in about 25% of the cases, OMIM 272300) or associated with xanthine dehydrogenase deficiency as part of molybdenum cofactor (MOCO) deficiency (OMIM 252150) (58,59). The sulfite oxidase enzyme is located in the mitochondrial intermembranous space and seems to be involved in the electrons transfer from sulfites into the electron transport chain (60). Prenatal brain destruction in SOD has been reported (61). Both isolated SOD and MOCO present during the first days of life with seizures, feeding difficulties, and vomiting. Facial dysmorphia can be present, while ectopia lentis appears later. The diagnosis is based on high sulfite level in fresh urine. S-sulfocysteine and taurine concentrations are also increased. Low uric acid levels in serum and urine and increased urinary xanthine and hypoxanthine concentrations allow to distinguish MOCO deficiency from isolated SOD (59).
MRI initially shows extensive bilateral abnormal signal intensity suggesting edema of both gray and white matter with cytotoxic edema (62–64) (Fig. 11). The frontal and temporal cortex and thalami may be spared (62,63). On early follow-up, edema decreases and curvilinear areas of reduced signal intensity appear at the gray/white matter junction, suggesting hemorrhagic deposits and laminar necrosis (62). The final stage is characterized by rapid development of extensive cystic leukomalacia, which may collapse (62–64). Additionally, the cortex is globally atrophic and abnormal signal intensities are present bilaterally in the basal ganglia, internal capsule, and centrum semiovale (62–64). The cerebellum may be hypoplastic. 1H-MRS shows increased lactate and choline, elevated levels of glutamine and glutamate (due to the inhibition of glutamate dehydrogenase by sulfites), reduced NAA, and additional, elevated peaks of several other metabolites that are possibly accumulated including taurine at 3.42 and 3.24 ppm, S-sulocysteine at 3.61 ppm, and cysteine at 2.92 and 2.97 ppm (63,64).
Figure 11.
Nonenhanced helical computed tomography (NECT) (a) obtained in a 4-day-old with molybdenum cofactor deficiency shows diffuse low density (arrow) of the cortex and subcortical white matter. The gyri are diffusely swollen. ADC map (b) reveals diffuse diffusion restriction of the cortex (arrow). Axial (c) and coronal (d) T2W images confirm swollen gyri and diffusely increased signal intensity of the cortex, white matter and deep gray structures. There is loss of sulci due to gyral swelling (arrows).
The clinical and neuroimaging findings in SOD and HIE are very similar and it is not surprisingly that most of the SOD cases are initially misdiagnosed as HIE (59,63,64). However, there are some important differences: newborns experiencing HIE usually stabilize 1–2 weeks after delivery, while neonates with SOD do not show improvement or stability (59); in HIE the caudate is rarely affected, whereas it is always involved in SOD (63); in contrast to HIE, in SOD patients the choline peak on 1H-MRS is increased, not reduced (64).
DISORDERS OF THE BIOSYNTHESIS AND BREAKDOWN OF COMPLEX MOLECULES
Neonatal Peroxisomal Disorders (OMIM 601539)
Peroxisomes are cellular organelles catalyzing a number of indispensable functions in cellular metabolism such as beta-oxidation of very-long-chain fatty acids (VLCFA), degradation of reactive oxygen species, pipe-colic acid metabolism, oxidation of phytanic acid, and biosyntheses of plasminogens and bile acids (65). Almost all of the peroxisomal disorders presenting in the neonatal period are caused by disturbance of peroxisome biogenesis and as such are called peroxisomal biogenesis disorders (PBD). Peroxisomal biogenesis disorders include Zellweger syndrome (ZS), neonatal adrenoleukodystrophy (NALD), infantile Refsum disease, and rhizomelic chondrodysplasia punctata (66).
Zellweger syndrome (ZS, OMIM 214100), the PBD prototype, usually presents soon after birth with severe muscular hypotonia, poor swallowing and sucking, irritability to environmental stimuli, and epileptic seizures (67,68). Reflecting the ubiquitous nature of the peroxisome, nearly every organ may be affected. Nonneurologic features are distinctive craniofacial abnormalities, cataracts, pigmentary retinopathy, hepatomegaly, renal cysts, and epiphyseal stippling (Fig. 12). This clinical presentation is highly suggestive of ZS. Subsequently, biochemical analysis of VLCFA (increased) and plasmalogen (reduced) in plasma and serum is diagnostic. Mutation detection confirms the diagnosis and is crucial for genetic counseling, carrier testing, or prenatal diagnosis (68).
Figure 12.

Sagittal T1W image (a) in a 1-day-old newborn with Zellweger syndrome show a subependymal cyst (arrow) in the caudothalamic groove. Knee radiograph (b) of an 8-day-old newborn with Zellweger syndrome demonstrates typical patellar stippling (arrow). Axial T2W images (c,d) in a 5-day-old reveals bright signal of the white matter and polymicrogyria of the lateral aspects of the brain (arrow in c) and within the perisylvian region (arrow in d).
Neuroimaging may lead the way to the diagnosis in the absence of distinct clinical features. Typical neonatal neuroimaging abnormalities in ZS include cortical malformations, germinolytic cysts, white matter abnormalities, and atrophy of gray and white matter (69,70). Cortical malformations primarily consist of polymicrogyria particularly in the perisylvic region, but may also be more generalized affecting the parieto-temporo-occipital lobes (Fig. 12). Pachygyria is most often seen in the frontoparietal regions (70). Periventricular heterotopias are also reported (71). Migrational disorders in ZS indicate that peroxisomal metabolism is required for normal neuronal migration in the brain. Subependymal germinolytic cysts, most commonly located in the caudothalamic notch, are characteristic, but not consistent findings in ZS (70) (Fig. 12). They may be best identified on coronal or sagittal MR images and represent prenatally acquired clastic lesions. Hypomyelination of the white matter may be found and is believed to be related to the destabilizing effect of VLCFA on myelin. Finally, generalized brain atrophy may be present (70). 1H-MRS findings are not specific and include a decreased NAA peak and abnormal signal at 1.33 and 0.9 ppm consisting of lactate and lipids, respectively (72).
Neonatal adrenoleukodystrophy (NALD, OMIM 202370) is an autosomal recessive disorder with a similar, but generally less severe clinical presentation than ZS (73). In NALD, facial dysmorphic features are less marked than in ZS and patellar stippling and renal cysts are not seen. White matter abnormalities due to almost complete absence of myelin represent the neuroimaging findings in NALD and are usually more severe in NALD than in ZS (71).
Congenital Disorders of Glycosylation
Congenital disorders of glycosylation (CDG) are a large family of genetic diseases resulting from defects in the synthesis of glycans and in the attachment of glycans to other compounds (74). Most types of CDG that have been discovered so far were identified by demonstrating defects in the N-glycosylation pathway of glycoproteins (75). Phosphomannomutase 2 deficiency (OMIM 212065) or PMM2-CDG (CDGIa) is by far the most common form. The neonatal presentation is characterized by facial dysmorphism, inverted nipples, abnormal fat distribution (Fig. 13), joint contractures, feeding problems, and multisystemic involvement (heart, liver, kidneys, and coagulation factors) (76). Neurological features include muscular hypotonia, alternating internal strabismus, “rolling” eye movements, and areflexia (77).
Figure 13.
Sagittal T1W image (a) reveals micrognathia and a normal sized brainstem and vermis in a neonate with congenital disorder of glycosylation type 1a. Axial T2W image (b) demonstrates increased cerebellar white matter signal (arrow), abnormal for age. There is no restriction noted on axial DWI (c). The brainstem, cerebellum, and vermis developed atrophy by follow-up examination at 7 months of age (not shown). Axial T1W abdominal image (d) reveals large fatty deposits (arrow) adjacent to the superior edge of the iliac crest.
Imaging in the neonatal period may be normal (76). Marked and global pontocerebellar hypoplasia with superimposed atrophy that likely begins in utero, progresses in infancy but seems to stabilize in older childhood is the typical neuroimaging finding in CDG1a (78,79) (Fig. 13). Distinguishing between cerebellar hypoplasia and cerebellar atrophy may be difficult based on a single examination; follow-up imaging is necessary (80). Intracranial hemorrhages secondary to coagulopathy have been reported as the initial neonatal manifestation of CDG1a (81). Supratentorial atrophy and stroke-like episodes/lesions are typical neuroimaging findings in CDG1a, but not typically found in the neonate (82).
Smith–Lemli–Opitz Syndrome (OMIM 270400)
Smith–Lemli–Opitz syndrome (SLO) is caused by abnormal cholesterol biosynthesis (83). Typical neonatal presentation includes characteristic cranial dysmorphic features (Fig. 14), skeletal anomalies (particularly syndactyly of second and third toes), genital abnormalities, congenital heart defects, renal hypoplasia, and gastrointestinal anomalies. Neonatal neurological symptoms are microcephaly, abnormal sucking, swallowing and feeding difficulties, and severe muscular hypotonia (84). A clinical diagnosis of SLO may be confirmed by finding elevated 7-dehydrocholesterol (DHC) in blood or tissues. The blood cholesterol level, however, is not a reliable screening test because ≈10% of patients with SLO have normal serum cholesterol level (84).
Figure 14.
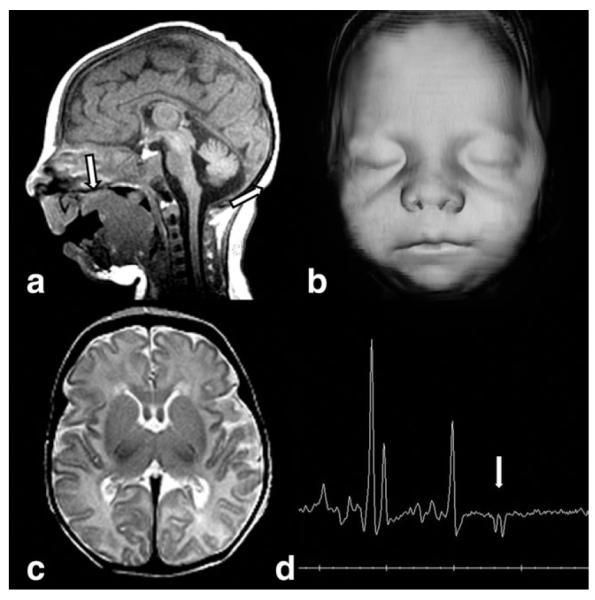
Sagittal T1W image (a) demonstrates microcephaly, micrognathia, and tongue extending through a cleft soft palate (arrow) in a neonate with Smith–Lemli–Opitz syndrome. 3D skin surface reconstruction (b) shows typical upturned nares, long philtrum, and small chin. T2W axial image (c) reveals a small but well-formed brain. MRS (d) demonstrates a lactate doublet (arrow).
Neuroimaging demonstrates structural brain anomalies in about 30%–40% of the patients (85). Common imaging findings in SLO are ventriculomegaly, hypoplastic or absent corpus callosum, microcephaly (Fig. 14), hypoplastic frontal lobes, pituitary lipoma, and cerebellar hypoplasia. Various forms of holoprosencephaly occur in about 5% of patients (84,86). The high prevalence of CNS abnormalities in patients with SLO underlines the role of cholesterol in the embryogenesis of the brain. The covalent binding of cholesterol to the sonic hedgehog (SHH) signaling protein plays an important role in controlling embryonic development of the forebrain and the limbs and mutations in the SHH gene may result in holoprosencephaly (87). Additionally, abnormal myelination has been suggested in some patients with SLO, which may be related to the role of cholesterol in myelin formation (86). 1H-MRS may show elevated Cho/NAA-ratio and abnormally elevated lipid peaks prior to cholesterol therapy (86).
Krabbe Disease or Globoid-Cell Leukodystrophy (OMIM 245200)
Krabbe disease or globoid-cell leukodystrophy (GLD) is due to deficiency of the lysosomal enzyme galactocerebrosidase and characterized by failure of the process of myelination in the central and peripheral nervous systems (88). Patients with the infantile form generally present with spasticity, marked irritability, and arrested motor development at 3–6 months of age. Typical neuroimaging findings in infantile-onset GLD include signal abnormalities in the cerebral and cerebellar white matter and thalami (89) and enlargement of optic nerve and chiasm due to focal accumulation of globoid cells.
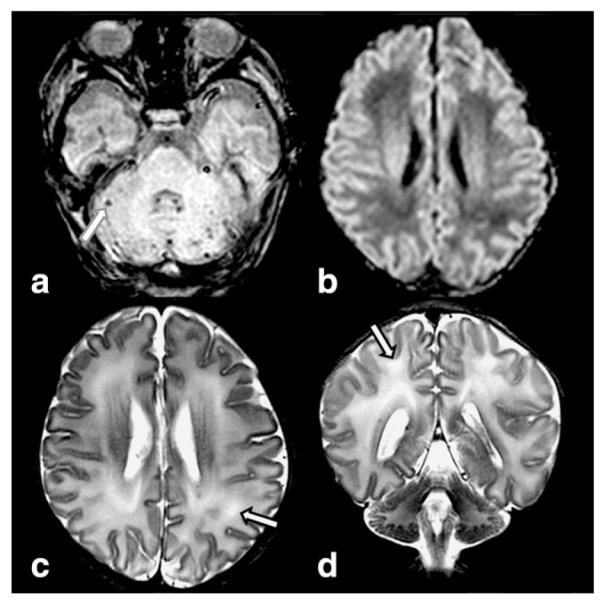
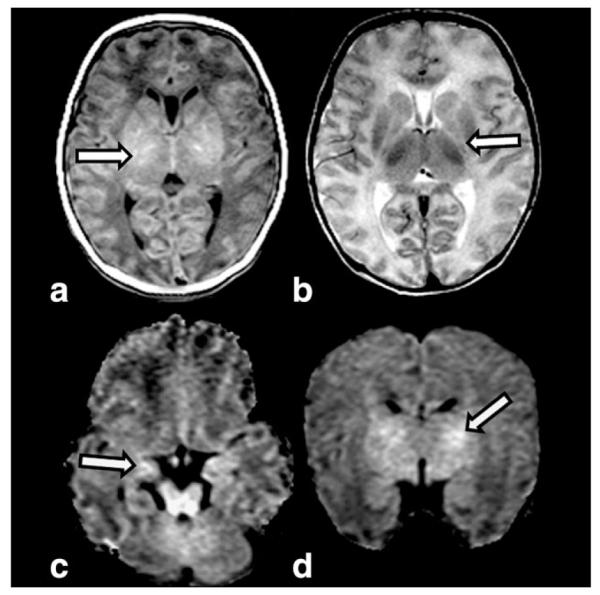
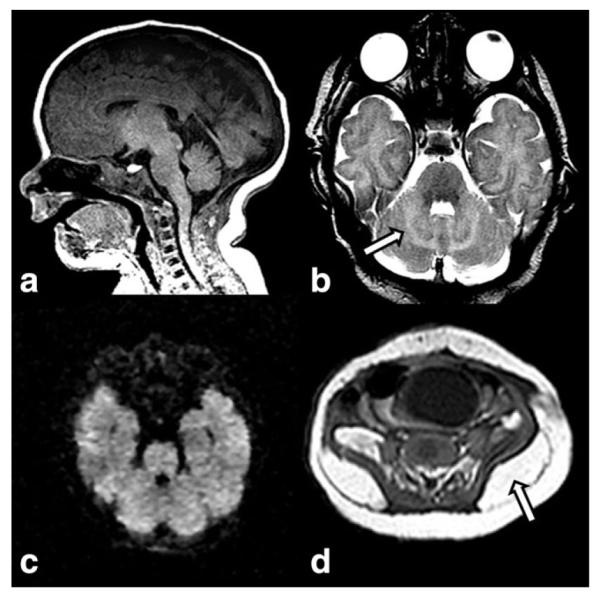
Neonatal onset of GLD is exceptional (90–92). Clinical presentation is similar to the infantile form. Neonatal neuroimaging findings have been reported twice: in one newborn, neuroimaging showed signal abnormalities of the lateral thalami, corona radiata, and dentate nuclei (92), while in the other neonate neuroimaging was reported as normal (91). We show additional unpublished images of neonatal onset of GLD revealing T1-hypo- and T2-hyperintense signal abnormalities of the dentate nuclei and enlargement of the optic chiasm (Fig. 15). MRS in infantile GLD has reported elevation of myo-inositol and choline and decrease of NAA (93).
Figure 15.

MRI was performed in a 9-day-old nonsymptomatic female infant with a prenatal diagnosis of Krabbe. T1 axial (a) demonstrates low signal intensity dentate nuclei (arrow). No diffusion restriction is present on DWI (b). Dentate nuclei (arrow) are increased in signal on T2W image (c). The optic chiasm (arrow) is enlarged on coronal T2W image (d).
Transplantation of umbilical-cord blood stem cells from unrelated donors in asymptomatic newborns with infantile GLD have been reported to favorably alter the natural history of the disease (94). Therefore, a neonatal screening for GLD has been started in some states (95). Interpreting the results is limited, however, because neither enzyme activity nor genetic mutation reliably predicts the resulting phenotype. DTI with quantitative tractography has been reported to detect significant differences in the corticospinal tracts of asymptomatic neonates who had the early onset form of GLD. This tool has the potential to be used as a marker of disease progression in neonates diagnosed through statewide neonate screening programs (96).
NEUROTRANSMITTER DEFECTS AND RELATED DISORDERS
Pyridoxine-Dependent Epilepsy (OMIM 266100)
Pyridoxine-dependent epilepsy (PDE) is due to mutations in the ALDH7A1 gene and is characterized by prenatal or neonatal onset of epileptic seizures that are typically frequent, multifocal or generalized, and myoclonic, and often intermixed with tonic symptoms, abnormal eye movements, grimacing, or irritability (97,98). Seizures are resistant to antiepileptic drugs. EEG is inconclusive, with normal and abnormal recordings (99). The diagnosis should be suspected based on the clinical presentation. Cessation of seizures after intravenous injection of 50–100 mg of pyridoxine confirms the diagnosis. The epilepsy remains controlled by 5–10 mg/kg/day of oral pyridoxine.
Typically, neuroimaging appears normal in patients with PDE (99–102). Certain abnormalities, however, have been reported such as thinning of the isthmus of the corpus callosum, agenesis of the corpus callosum, heterotopias, ventriculomegaly, PVL, cerebellar hypoplasia, and mega cisterna magna (99). It is actually unclear if these abnormalities are related to the disease (Fig. 16). Additionally, neuroimaging findings similar to HIE have been reported (99).
Figure 16.
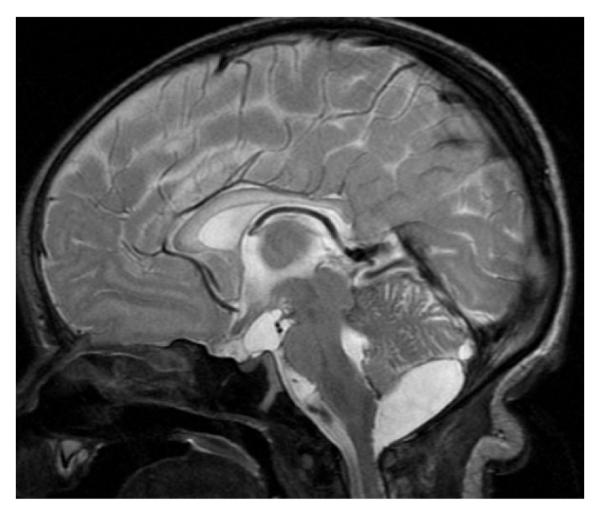
Sagittal T2-weighted image of a 7-day-old newborn with pyridoxine dependent epilepsy shows a mild hypoplasia of the isthmus of the corpus callosum and an infravermian arachnoid cyst. Additionally, notice the signal hyperintensity and swelling of the entire corpus callosum as well as a small prepontine arachnoid cyst.
Pyridoxamine-5-phosphate oxidase deficiency results also in treatment-refractory neonatal seizures that respond to treatment with pyridoxal-5-phosphate (PLP), but not to conventional antiepileptic drugs or pyridoxine. The clinical findings are nonspecific and do not allow differentiating between PDE- and PLP-dependent seizures. We are not aware of neonatal neuroimaging studies. MRI in older children may show hypomyelination or cerebral atrophy (103).
Nonketotic Hyperglycinemia or Glycine Encephalopathy (OMIM 605899)
Nonketotic hyperglycinemia (NKH) or glycine encephalopathy is caused by a defective glycine cleavage system, which leads to accumulation of large amounts of glycine in body fluids and tissues and subsequent CNS toxicity (104). The neurotoxicity of glycine seems to be related to excitatory and inhibitory neuronal effects on glycine and N-methyl-D-aspartate receptors in the telencephalon and brainstem/spinal cord, respectively, and to a disturbance in myelin proteins (105). Additionally, the glycine cleavage system plays an important role in the neurogenesis (105,106).
The majority of NKH patients presents in the neonatal period. Typically, the newborns present in the first 2 days of life with progressive lethargy, hypotonia, and myoclonic jerks rapidly evolving into apnea, coma, and often death (104). Hiccups and abnormal ocular movements are additional symptoms. The majority of the surviving infants have profound intellectual disability and intractable seizures (107). The neonatal EEG is abnormal in at least 90% of the cases and usually presents a burst-suppression pattern. Diagnosis of NKH is established by an increase in CSF glycine concentration and an increased CSF-to-plasma glycine ratio.
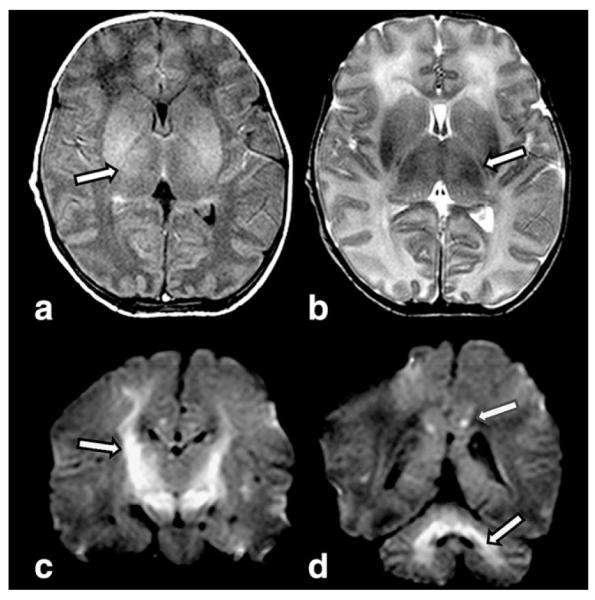
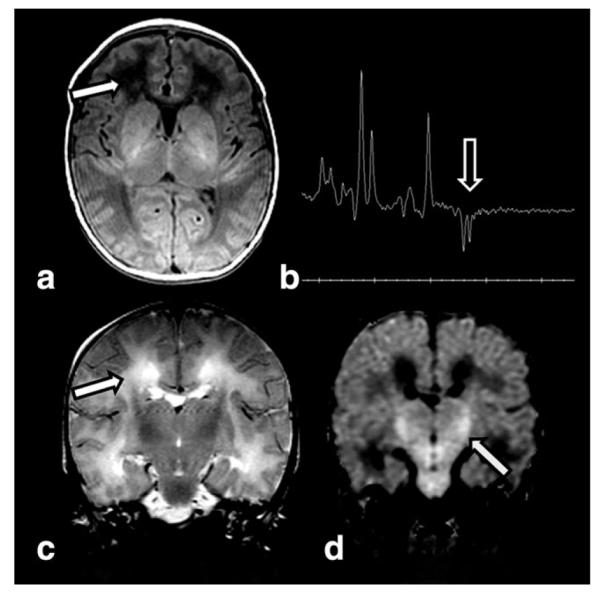
Neonatal neuroimaging findings include structural and white matter abnormalities. Agenesis of the corpus callosum is the most common structural abnormality in NKH and associated with the clinical presentation is suggestive of the diagnosis (108). Additionally, hypoplasia of the cerebellar vermis, particularly of the inferior part, has been reported (107). The myelinated white matter is affected and appears T2-hyperintense and the degree of involvement is best seen on DWI sequences (Fig. 17) (108–110). Restricted diffusion in the myelinated white matter tracts is indicated by matching low ADC values and is due to myelin vacuoles secondary to the splitting of the myelin sheets (109,110). Sequential neuroimaging findings demonstrate disappearance of restricted diffusion in myelinated white matter (111). This suggests that myelination itself is not delayed and is probably due to coalescence of the myelin vacuoles. In the myelinated white matter, FA values have been reported to be initially normal, but to decrease subsequently indicative of axonal loss (111). 1H-MRS shows a striking increase in the glycine peak at 3.55 ppm (Fig. 17) (112,113). Because in short-echo MR spectra glycine cannot be distinguished from the normal myo-inositol peak, the elevation of glycine may be best evaluated with long-echo 1H-MR spectra. Measuring the glycine concentration, 1H-MRS may not only suggest the diagnosis of NKH, but also monitor the effects of therapeutic interventions.
Figure 17.
Axial T2-weighted image (a) in a 5-day-old infant with nonketotic hyperglycinemia reveals white matter swelling. Short- (TE = 32 msec) echo-time water-suppressed 1H MRS spectra (b) from basal ganglia confirms an elevated glycine peak (arrow) at 3.55 ppm. Axial (c) ADC map shows diffuse cerebellar and brainstem diffusion restriction, while coronal (d) ADC map demonstrates involvement in the corticospinal tracts (arrow). The “bull’s head” appearance of the ventricular system suggests agenesis or severe hypogenesis of the corpus callosum.
Creatine Deficiency Syndromes
Creatine and creatine phosphate are essential for energy storage and transmission in most tissues, predominantly in skeletal muscles and brain. Creatine deficiency syndromes include three inherited defects in the biosynthesis and transport of creatine, guanidinoacetate methyltransferase deficiency (GAMT gene) and L-arginine-glycine amidinotransferase deficiency (GATM gene), and creatine transporter deficiencies (an X-linked disorder with SLC6A8 gene mutations). Guanidinoacetate methyltransferase (GAMT) deficiency may present in the first month of life with epileptic seizures. Later there is mental, speech, and language delay, epilepsy, or autistic-like behavior.
MRI is usually normal, while 1H-MRS shows the diagnostic markedly reduced or completely absent creatine peak at 3.0 ppm (Fig. 18). This is most easily seen on long-echo 1H-MR spectra. A reduced creatine peak has been shown as early as 9 days of age (114). On short-echo 1H-MR spectra, an abnormal broad guanidinoacetate peak is present at 3.78 ppm. 1H-MRS is the diagnostic tool of choice in creatine deficiency syndrome, while determination of creatine or creatinine in serum or urine cannot be used because normal concentrations have been found in affected patients. Disorders of creatine synthesis may be treated by creatine supplementation. After initiation of therapy, the creatine peak slowly reappears in the disorders of creatine synthesis, but not transport (115,116).
Figure 18.
MRS (TE 144) demonstrates lack of the typical creatine peak in a toddler with creatine deficiency syndrome and otherwise normal brain imaging.
NEONATAL HYPOGLYCEMIA
At the end of this review we include a very short section on neonatal hypoglycemia because, like IEM, neonatal hypoglycemia may present with neurological features such as stupor, jitteriness, seizures, apnea, irritability, and muscular hypotonia mimicking many other more frequent diseases. Neonatal hypoglycemia may also overlap with, or result from HIE, because the brain regulates the glucose output from the liver in the neonatal period. Moreover, although neonatal hypoglycemia is rarely due to IEM, disorders of the amino acid, organic acid, fatty acid, and carbohydrate metabolism may cause severe recurrent symptomatic hypoglycemia. In this case, hypoglycemia may accentuate the neurological symptoms. Additional causes of severe recurrent hypoglycemia include hyperinsulinismus (eg, Beckwith-Wiedemann [OMIM 130650], familial hyperinsulinemic hypoglycemias [OMIM 601820], or macrosomia) and endocrine deficiencies (eg, panhypopituitarism, isolated growth hormone deficiency, or cortisol deficiency).
The typical neuroimaging pattern of symptomatic hypoglycemia includes signal abnormalities localized to the parietal and occipital cortex and subcortical white matter (117) (Fig. 19). Typically, the superficial layers of the cortex are involved, supporting the hypothesis that an increased concentration of excitatory amino acids released from synaptic endings within the CSF enhances neuronal death. In HIE the deeper layers of the cortex are typically involved. Finally, in contrast to HIE, the hippocampus, basal ganglia, and peri-Rolandic cortex are less commonly involved in neonatal hypoglycemia. In the involved areas, DWI may show restricted diffusion and a lactate peak may be seen on 1H-MRS (117). Recently, however, a more varied pattern of injury has been reported: the white matter injury is not confined to the posterior regions, the cortex is usually involved, and hemorrhages, middle cerebral artery infarction, and basal ganglia or thalamic abnormalities may be also present (118).
Figure 19.

Axial T2W (a) image in a 5-day-old newborn with recurrent severe symptomatic hypoglycemia show an abnormal increased signal in the parieto-occipital white matter. Axial T1W (b) reveals abnormal T1 hyperintense signal in the globi pallidi. There is restricted diffusion on DWI (c) confirming parieto-occipital involvement. Note additionally involvement of the splenium of corpus callosum.
CONCLUSION
Neonatal IEMs are rare and usually manifest with nonspecific symptoms that may mimic more common acute neonatal disorders like sepsis, severe heart insufficiency, or neonatal HIE. Therefore, initially IEM may be misdiagnosed. Early diagnosis and institution of the appropriate therapy, however, is mandatory in IEM to prevent death or permanent long-term neurological sequelae. A high index of suspicion for IEM in every sick newborn is important. Neuroimaging is an important diagnostic tool in neonatal neurometabolic disorders. Although metabolic or genetic laboratory investigations are needed to confirm the diagnosis of IEM, conventional MRI with integration of advanced MR techniques may suggest the diagnosis and allow targeted laboratory investigations. Additionally, detailed review of the neuroimaging may be helpful to distinguish between neonatal IEM and other more common disorders with similar, initial clinical presentation. Moreover, advanced neuroimaging techniques help to better understand disease pathomechanisms. Finally, neuroimaging (particularly 1H-MRS) has the potential to serve as a valuable biomarker for monitoring therapeutic efficacy in selected disorders.
ACKNOWLEDGMENTS
We thank Jan Buijs, MD, Department of Neonatology, Maxima Medical Center, Veldhoven, the Netherlands, and Bernhard Schmitt, MD, Division of Clinical Neurophysiology/Epilepsy, University Children’s Hospital, Zurich, Switzerland, for sharing neuroimaging data of two patients.
REFERENCES
- 1.Filiano JJ. Neurometabolic diseases in the newborn. Clin Perinatol. 2006;33:411–479. doi: 10.1016/j.clp.2006.03.013. [DOI] [PubMed] [Google Scholar]
- 2.Saudubray JM, Sedel F, Walter JH. Clinical approach to treatable inborn metabolic diseases: an introduction. J Inherit Metab Dis. 2006;29:261–274. doi: 10.1007/s10545-006-0358-0. [DOI] [PubMed] [Google Scholar]
- 3.Leonard JV, Morris AA. Diagnosis and early management of inborn errors of metabolism presenting around the time of birth. Acta Paediatr. 2006;95:6–14. doi: 10.1080/08035250500349413. [DOI] [PubMed] [Google Scholar]
- 4.Burton BK. Inborn errors of metabolism in infancy: a guide to diagnosis. Pediatrics. 1998;102:E69. doi: 10.1542/peds.102.6.e69. [DOI] [PubMed] [Google Scholar]
- 5.Chakrapani A, Cleary MA, Wraith JE. Detection of inborn errors of metabolism in the newborn. Arch Dis Child Fetal Neonatal Ed. 2001;84:F205–210. doi: 10.1136/fn.84.3.F205. [DOI] [PMC free article] [PubMed] [Google Scholar]
- 6.Ficicioglu C, Bearden D. Isolated neonatal seizures: when to suspect inborn errors of metabolism. Pediatr Neurol. 2011;45:283–291. doi: 10.1016/j.pediatrneurol.2011.07.006. [DOI] [PubMed] [Google Scholar]
- 7.Mastrangelo M, Celato A, Leuzzi V. A diagnostic algorithm for the evaluation of early onset genetic-metabolic epileptic encephalopathies. Eur J Paediatr Neurol. 2012;16:179–191. doi: 10.1016/j.ejpn.2011.07.015. [DOI] [PubMed] [Google Scholar]
- 8.Van Hove JL, Lohr NJ. Metabolic and monogenic causes of seizures in neonates and young infants. Mol Genet Metab. 2011;104:214–230. doi: 10.1016/j.ymgme.2011.04.020. [DOI] [PubMed] [Google Scholar]
- 9.Kamboj M. Clinical approach to the diagnoses of inborn errors of metabolism. Pediatr Clin North Am. 2008;55:1113–1127. doi: 10.1016/j.pcl.2008.07.004. [DOI] [PubMed] [Google Scholar]
- 10.Hinton CF, Feuchtbaum L, Kus CA, et al. What questions should newborn screening long-term follow-up be able to answer? A statement of the US Secretary for Health and Human Services’ Advisory Committee on Heritable Disorders in Newborns and Children. Genet Med. 2011;13:861–865. doi: 10.1097/GIM.0b013e3182209f09. [DOI] [PubMed] [Google Scholar]
- 11.Schulze A, Lindner M, Kohlmuller D, Olgemoller K, Mayatepek E, Hoffmann GF. Expanded newborn screening for inborn errors of metabolism by electrospray ionization-tandem mass spectrometry: results, outcome, and implications. Pediatrics. 2003;111:1399–1406. doi: 10.1542/peds.111.6.1399. [DOI] [PubMed] [Google Scholar]
- 12.Leijser LM, de Vries LS, Rutherford MA, et al. Cranial ultrasound in metabolic disorders presenting in the neonatal period: characteristic features and comparison with MR imaging. AJNR Am J Neuroradiol. 2007;28:1223–1231. doi: 10.3174/ajnr.A0553. [DOI] [PMC free article] [PubMed] [Google Scholar]
- 13.Huisman TA, Tekes A. Advanced MR brain imaging. Why? Pediatr Radiol. 2008;38(Suppl 3):S415–432. doi: 10.1007/s00247-008-0895-9. [DOI] [PubMed] [Google Scholar]
- 14.Huisman TA. Diffusion-weighted imaging: basic concepts and application in cerebral stroke and head trauma. Eur Radiol. 2003;13:2283–2297. doi: 10.1007/s00330-003-1843-6. [DOI] [PubMed] [Google Scholar]
- 15.Patay Z. Diffusion-weighted MR imaging in leukodystrophies. Eur Radiol. 2005;15:2284–2303. doi: 10.1007/s00330-005-2846-2. [DOI] [PubMed] [Google Scholar]
- 16.Feldman HM, Yeatman JD, Lee ES, Barde LH, Gaman-Bean S. Diffusion tensor imaging: a review for pediatric researchers and clinicians. J Dev Behav Pediatr. 2010;31:346–356. doi: 10.1097/DBP.0b013e3181dcaa8b. [DOI] [PMC free article] [PubMed] [Google Scholar]
- 17.Xu D, Vigneron D. Magnetic resonance spectroscopy imaging of the newborn brain—a technical review. Semin Perinatol. 2010;34:20–27. doi: 10.1053/j.semperi.2009.10.003. [DOI] [PMC free article] [PubMed] [Google Scholar]
- 18.Xu D, Bonifacio SL, Charlton NN, et al. MR spectroscopy of normative premature newborns. J Magn Reson Imaging. 2011;33:306–311. doi: 10.1002/jmri.22460. [DOI] [PMC free article] [PubMed] [Google Scholar]
- 19.Leonard JV, Morris AA. Urea cycle disorders. Semin Neonatol. 2002;7:27–35. doi: 10.1053/siny.2001.0085. [DOI] [PubMed] [Google Scholar]
- 20.Summar ML, Dobbelaere D, Brusilow S, Lee B. Diagnosis, symptoms, frequency and mortality of 260 patients with urea cycle disorders from a 21-year, multicentre study of acute hyperammonaemic episodes. Acta Paediatr. 2008;97:1420–1425. doi: 10.1111/j.1651-2227.2008.00952.x. [DOI] [PMC free article] [PubMed] [Google Scholar]
- 21.Takanashi J, Barkovich AJ, Cheng SF, et al. Brain MR imaging in neonatal hyperammonemic encephalopathy resulting from proximal urea cycle disorders. AJNR Am J Neuroradiol. 2003;24:1184–1187. [PMC free article] [PubMed] [Google Scholar]
- 22.Kara B, Albayram S, Tutar O, Altun G, Kocer N, Islak C. Diffusion-weighted magnetic resonance imaging findings of a patient with neonatal citrullinemia during acute episode. Eur J Paediatr Neurol. 2009;13:280–282. doi: 10.1016/j.ejpn.2008.04.015. [DOI] [PubMed] [Google Scholar]
- 23.Okanishi T, Ito T, Nakajima Y, et al. Parieto-occipital encephalomalacia in neonatal hyperammonemia with ornithine transcarbamylase deficiency: a case report. Brain Dev. 2010;32:567–570. doi: 10.1016/j.braindev.2009.07.001. [DOI] [PubMed] [Google Scholar]
- 24.Bireley WR, Van Hove JL, Gallagher RC, Fenton LZ. Urea cycle disorders: brain MRI and neurological outcome. Pediatr Radiol. 2012;42:455–462. doi: 10.1007/s00247-011-2253-6. [DOI] [PubMed] [Google Scholar]
- 25.Gropman A. Brain imaging in urea cycle disorders. Mol Genet Metab. 2010;100(Suppl 1):S20–30. doi: 10.1016/j.ymgme.2010.01.017. [DOI] [PMC free article] [PubMed] [Google Scholar]
- 26.Jain-Ghai S, Nagamani SC, Blaser S, Siriwardena K, Feigenbaum A. Arginase I deficiency: severe infantile presentation with hyperammonemia: more common than reported? Mol Genet Metab. 2011;104:107–111. doi: 10.1016/j.ymgme.2011.06.025. [DOI] [PMC free article] [PubMed] [Google Scholar]
- 27.Schadewaldt P, Wendel U. Metabolism of branched-chain amino acids in maple syrup urine disease. Eur J Pediatr. 1997;156(Suppl 1):S62–66. doi: 10.1007/pl00014274. [DOI] [PubMed] [Google Scholar]
- 28.Harris RA, Joshi M, Jeoung NH, Obayashi M. Overview of the molecular and biochemical basis of branched-chain amino acid catabolism. J Nutr. 2005;135:1527S–1530S. doi: 10.1093/jn/135.6.1527S. [DOI] [PubMed] [Google Scholar]
- 29.Morton DH, Strauss KA, Robinson DL, Puffenberger EG, Kelley RI. Diagnosis and treatment of maple syrup disease: a study of 36 patients. Pediatrics. 2002;109:999–1008. doi: 10.1542/peds.109.6.999. [DOI] [PubMed] [Google Scholar]
- 30.Simon E, Fingerhut R, Baumkotter J, Konstantopoulou V, Ratschmann R, Wendel U. Maple syrup urine disease: favourable effect of early diagnosis by newborn screening on the neonatal course of the disease. J Inherit Metab Dis. 2006;29:532–537. doi: 10.1007/s10545-006-0315-y. [DOI] [PubMed] [Google Scholar]
- 31.Jan W, Zimmerman RA, Wang ZJ, Berry GT, Kaplan PB, Kaye EM. MR diffusion imaging and MR spectroscopy of maple syrup urine disease during acute metabolic decompensation. Neuroradiology. 2003;45:393–399. doi: 10.1007/s00234-003-0955-7. [DOI] [PubMed] [Google Scholar]
- 32.Ha JS, Kim TK, Eun BL, et al. Maple syrup urine disease encephalopathy: a follow-up study in the acute stage using diffusion-weighted MRI. Pediatr Radiol. 2004;34:163–166. doi: 10.1007/s00247-003-1058-7. [DOI] [PubMed] [Google Scholar]
- 33.Righini A, Ramenghi LA, Parini R, Triulzi F, Mosca F. Water apparent diffusion coefficient and T2 changes in the acute stage of maple syrup urine disease: evidence of intramyelinic and vasogenic-interstitial edema. J Neuroimaging. 2003;13:162–165. [PubMed] [Google Scholar]
- 34.Parmar H, Sitoh YY, Ho L. Maple syrup urine disease: diffusion-weighted and diffusion-tensor magnetic resonance imaging findings. J Comput Assist Tomogr. 2004;28:93–97. doi: 10.1097/00004728-200401000-00015. [DOI] [PubMed] [Google Scholar]
- 35.Dave P, Curless RG, Steinman L. Cerebellar hemorrhage complicating methylmalonic and propionic acidemia. Arch Neurol. 1984;41:1293–1296. doi: 10.1001/archneur.1984.04050230079025. [DOI] [PubMed] [Google Scholar]
- 36.Velasco-Sanchez D, Gomez-Lopez L, Vilaseca MA, et al. Cerebellar hemorrhage in a patient with propionic acidemia. Cerebellum. 2009;8:352–354. doi: 10.1007/s12311-009-0103-y. [DOI] [PubMed] [Google Scholar]
- 37.Davison JE, Davies NP, Wilson M, et al. MR spectroscopy-based brain metabolite profiling in propionic acidaemia: metabolic changes in the basal ganglia during acute decompensation and effect of liver transplantation. Orphanet J Rare Dis. 2011;6:19. doi: 10.1186/1750-1172-6-19. [DOI] [PMC free article] [PubMed] [Google Scholar]
- 38.Feliz B, Witt DR, Harris BT. Propionic acidemia: a neuropathology case report and review of prior cases. Arch Pathol Lab Med. 2003;127:e325–328. doi: 10.5858/2003-127-e325-PAANCR. [DOI] [PubMed] [Google Scholar]
- 39.Radmanesh A, Zaman T, Ghanaati H, Molaei S, Robertson RL, Zamani AA. Methylmalonic acidemia: brain imaging findings in 52 children and a review of the literature. Pediatr Radiol. 2008;38:1054–1061. doi: 10.1007/s00247-008-0940-8. [DOI] [PubMed] [Google Scholar]
- 40.Sum JM, Twiss JL, Horoupian DS. Selective death of immature neurons in methylmalonic acidemia of the neonate: a case report. Acta Neuropathol. 1993;85:217–221. doi: 10.1007/BF00227771. [DOI] [PubMed] [Google Scholar]
- 41.Yamaguchi K, Hirabayashi K, Honma K. Methylmalonic acidemia: brain lesions in a case of vitamin B12 non-responsive (mut0) type. Clin Neuropathol. 1995;14:216–222. [PubMed] [Google Scholar]
- 42.Kanaumi T, Takashima S, Hirose S, Kodama T, Iwasaki H. Neuropathology of methylmalonic acidemia in a child. Pediatr Neurol. 2006;34:156–159. doi: 10.1016/j.pediatrneurol.2005.07.006. [DOI] [PubMed] [Google Scholar]
- 43.Kolker S, Christensen E, Leonard JV, et al. Guideline for the diagnosis and management of glutaryl-CoA dehydrogenase deficiency (glutaric aciduria type I) J Inherit Metab Dis. 2007;30:5–22. doi: 10.1007/s10545-006-0451-4. [DOI] [PubMed] [Google Scholar]
- 44.Hoffmann GF, Athanassopoulos S, Burlina AB, et al. Clinical course, early diagnosis, treatment, and prevention of disease in glutaryl-CoA dehydrogenase deficiency. Neuropediatrics. 1996;27:115–123. doi: 10.1055/s-2007-973761. [DOI] [PubMed] [Google Scholar]
- 45.Greenberg CR, Prasad AN, Dilling LA, et al. Outcome of the first 3-years of a DNA-based neonatal screening program for glutaric acidemia type 1 in Manitoba and northwestern Ontario, Canada. Mol Genet Metab. 2002;75:70–78. doi: 10.1006/mgme.2001.3270. [DOI] [PubMed] [Google Scholar]
- 46.De Meirleir L. Defects of pyruvate metabolism and the Krebs cycle. J Child Neurol. 2002;17(Suppl 3):3S26–33. [PubMed] [Google Scholar]
- 47.Barnerias C, Saudubray JM, Touati G, et al. Pyruvate dehydrogenase complex deficiency: four neurological phenotypes with differing pathogenesis. Dev Med Child Neurol. 2010;52:e1–9. doi: 10.1111/j.1469-8749.2009.03541.x. [DOI] [PubMed] [Google Scholar]
- 48.Soares-Fernandes JP, Teixeira-Gomes R, Cruz R, et al. Neonatal pyruvate dehydrogenase deficiency due to a R302H mutation in the PDHA1 gene: MRI findings. Pediatr Radiol. 2008;38:559–562. doi: 10.1007/s00247-007-0721-9. [DOI] [PubMed] [Google Scholar]
- 49.Brun N, Robitaille Y, Grignon A, Robinson BH, Mitchell GA, Lambert M. Pyruvate carboxylase deficiency: prenatal onset of ischemia-like brain lesions in two sibs with the acute neonatal form. Am J Med Genet. 1999;84:94–101. [PubMed] [Google Scholar]
- 50.Garcia-Cazorla A, Rabier D, Touati G, et al. Pyruvate carboxylase deficiency: metabolic characteristics and new neurological aspects. Ann Neurol. 2006;59:121–127. doi: 10.1002/ana.20709. [DOI] [PubMed] [Google Scholar]
- 51.Schiff M, Levrat V, Acquaviva C, Vianey-Saban C, Rolland MO, Guffon N. A case of pyruvate carboxylase deficiency with atypical clinical and neuroradiological presentation. Mol Genet Metab. 2006;87:175–177. doi: 10.1016/j.ymgme.2005.10.007. [DOI] [PubMed] [Google Scholar]
- 52.Gibson K, Halliday JL, Kirby DM, Yaplito-Lee J, Thorburn DR, Boneh A. Mitochondrial oxidative phosphorylation disorders presenting in neonates: clinical manifestations and enzymatic and molecular diagnoses. Pediatrics. 2008;122:1003–1008. doi: 10.1542/peds.2007-3502. [DOI] [PubMed] [Google Scholar]
- 53.Fellman V, Suomalainen A. Mitochondrial disorders in the peri-natal period. Semin Fetal Neonatal Med. 2011;16:173–174. doi: 10.1016/j.siny.2011.04.009. [DOI] [PubMed] [Google Scholar]
- 54.Gire C, Girard N, Nicaise C, Einaudi MA, Montfort MF, Dejode JM. Clinical features and neuroradiological findings of mitochondrial pathology in six neonates. Childs Nerv Syst. 2002;18:621–628. doi: 10.1007/s00381-002-0621-0. [DOI] [PubMed] [Google Scholar]
- 55.de Lonlay P, Valnot I, Barrientos A, et al. A mutant mitochondrial respiratory chain assembly protein causes complex III deficiency in patients with tubulopathy, encephalopathy and liver failure. Nat Genet. 2001;29:57–60. doi: 10.1038/ng706. [DOI] [PubMed] [Google Scholar]
- 56.Dinopoulos A, Cecil KM, Schapiro MB, et al. Brain MRI and proton MRS findings in infants and children with respiratory chain defects. Neuropediatrics. 2005;36:290–301. doi: 10.1055/s-2005-872807. [DOI] [PubMed] [Google Scholar]
- 57.Papadopoulou LC, Sue CM, Davidson MM, et al. Fatal infantile cardioencephalomyopathy with COX deficiency and mutations in SCO2, a COX assembly gene. Nat Genet. 1999;23:333–337. doi: 10.1038/15513. [DOI] [PubMed] [Google Scholar]
- 58.Brown GK, Scholem RD, Croll HB, Wraith JE, McGill JJ. Sulfite oxidase deficiency: clinical, neuroradiologic, and biochemical features in two new patients. Neurology. 1989;39:252–257. doi: 10.1212/wnl.39.2.252. [DOI] [PubMed] [Google Scholar]
- 59.Sass JO, Gunduz A, Araujo Rodrigues Funayama C, et al. Functional deficiencies of sulfite oxidase: differential diagnoses in neonates presenting with intractable seizures and cystic encephalomalacia. Brain Dev. 2010;32:544–549. doi: 10.1016/j.braindev.2009.09.005. [DOI] [PubMed] [Google Scholar]
- 60.Tan WH, Eichler FS, Hoda S, et al. Isolated sulfite oxidase deficiency: a case report with a novel mutation and review of the literature. Pediatrics. 2005;116:757–766. doi: 10.1542/peds.2004-1897. [DOI] [PubMed] [Google Scholar]
- 61.Carmi-Nawi N, Malinger G, Mandel H, Ichida K, Lerman-Sagie T, Lev D. Prenatal brain disruption in molybdenum cofactor deficiency. J Child Neurol. 2011;26:460–464. doi: 10.1177/0883073810383017. [DOI] [PubMed] [Google Scholar]
- 62.Dublin AB, Hald JK, Wootton-Gorges SL. Isolated sulfite oxidase deficiency: MR imaging features. AJNR Am J Neuroradiol. 2002;23:484–485. [PMC free article] [PubMed] [Google Scholar]
- 63.Eichler F, Tan WH, Shih VE, Grant PE, Krishnamoorthy K. Proton magnetic resonance spectroscopy and diffusion-weighted imaging in isolated sulfite oxidase deficiency. J Child Neurol. 2006;21:801–805. doi: 10.1177/08830738060210090601. [DOI] [PubMed] [Google Scholar]
- 64.Hoffmann C, Ben-Zeev B, Anikster Y, et al. Magnetic resonance imaging and magnetic resonance spectroscopy in isolated sulfite oxidase deficiency. J Child Neurol. 2007;22:1214–1221. doi: 10.1177/0883073807306260. [DOI] [PubMed] [Google Scholar]
- 65.Thoms S, Gronborg S, Gartner J. Organelle interplay in peroxisomal disorders. Trends Mol Med. 2009;15:293–302. doi: 10.1016/j.molmed.2009.05.002. [DOI] [PubMed] [Google Scholar]
- 66.Baumgartner MR, Saudubray JM. Peroxisomal disorders. Semin Neonatol. 2002;7:85–94. doi: 10.1053/siny.2001.0089. [DOI] [PubMed] [Google Scholar]
- 67.Steinberg SJ, Dodt G, Raymond GV, Braverman NE, Moser AB, Moser HW. Peroxisome biogenesis disorders. Biochim Biophys Acta. 2006;1763:1733–1748. doi: 10.1016/j.bbamcr.2006.09.010. [DOI] [PubMed] [Google Scholar]
- 68.Krause C, Rosewich H, Gartner J. Rational diagnostic strategy for Zellweger syndrome spectrum patients. Eur J Hum Genet. 2009;17:741–748. doi: 10.1038/ejhg.2008.252. [DOI] [PMC free article] [PubMed] [Google Scholar]
- 69.Barkovich AJ, Peck WW. MR of Zellweger syndrome. AJNR Am J Neuroradiol. 1997;18:1163–1170. [PMC free article] [PubMed] [Google Scholar]
- 70.Weller S, Rosewich H, Gartner J. Cerebral MRI as a valuable diagnostic tool in Zellweger spectrum patients. J Inherit Metab Dis. 2008;31:270–280. doi: 10.1007/s10545-008-0856-3. [DOI] [PubMed] [Google Scholar]
- 71.van der Knaap MS, Valk J. The MR spectrum of peroxisomal disorders. Neuroradiology. 1991;33:30–37. doi: 10.1007/BF00593330. [DOI] [PubMed] [Google Scholar]
- 72.Groenendaal F, Bianchi MC, Battini R, et al. Proton magnetic resonance spectroscopy (1H-MRS) of the cerebrum in two young infants with Zellweger syndrome. Neuropediatrics. 2001;32:23–27. doi: 10.1055/s-2001-12218. [DOI] [PubMed] [Google Scholar]
- 73.Kelley RI, Datta NS, Dobyns WB, et al. Neonatal adrenoleukodystrophy: new cases, biochemical studies, and differentiation from Zellweger and related peroxisomal polydystrophy syndromes. Am J Med Genet. 1986;23:869–901. doi: 10.1002/ajmg.1320230404. [DOI] [PubMed] [Google Scholar]
- 74.Jaeken J, Matthijs G. Congenital disorders of glycosylation: a rapidly expanding disease family. Annu Rev Genomics Hum Genet. 2007;8:261–278. doi: 10.1146/annurev.genom.8.080706.092327. [DOI] [PubMed] [Google Scholar]
- 75.Leroy JG. Congenital disorders of N-glycosylation including diseases associated with O- as well as N-glycosylation defects. Pediatr Res. 2006;60:643–656. doi: 10.1203/01.pdr.0000246802.57692.ea. [DOI] [PubMed] [Google Scholar]
- 76.Perez-Duenas B, Garcia-Cazorla A, Pineda M, et al. Long-term evolution of eight Spanish patients with CDG type Ia: typical and atypical manifestations. Eur J Paediatr Neurol. 2009;13:444–451. doi: 10.1016/j.ejpn.2008.09.002. [DOI] [PubMed] [Google Scholar]
- 77.Miossec-Chauvet E, Mikaeloff Y, Heron D, et al. Neurological presentation in pediatric patients with congenital disorders of glycosylation type Ia. Neuropediatrics. 2003;34:1–6. doi: 10.1055/s-2003-38614. [DOI] [PubMed] [Google Scholar]
- 78.Jensen PR, Hansen FJ, Skovby F. Cerebellar hypoplasia in children with the carbohydrate-deficient glycoprotein syndrome. Neuroradiology. 1995;37:328–330. doi: 10.1007/BF00588349. [DOI] [PubMed] [Google Scholar]
- 79.Antoun H, Villeneuve N, Gelot A, Panisset S, Adamsbaum C. Cerebellar atrophy: an important feature of carbohydrate deficient glycoprotein syndrome type 1. Pediatr Radiol. 1999;29:194–198. doi: 10.1007/s002470050571. [DOI] [PubMed] [Google Scholar]
- 80.Poretti A, Wolf NI, Boltshauser E. Differential diagnosis of cerebellar atrophy in childhood. Eur J Paediatr Neurol. 2008;12:155–167. doi: 10.1016/j.ejpn.2007.07.010. [DOI] [PubMed] [Google Scholar]
- 81.Cohn RD, Eklund E, Bergner AL, et al. Intracranial hemorrhage as the initial manifestation of a congenital disorder of glycosylation. Pediatrics. 2006;118:e514–521. doi: 10.1542/peds.2005-1307. [DOI] [PubMed] [Google Scholar]
- 82.Ishikawa N, Tajima G, Ono H, Kobayashi M. Different neuroradiological findings during two stroke-like episodes in a patient with a congenital disorder of glycosylation type Ia. Brain Dev. 2009;31:240–243. doi: 10.1016/j.braindev.2008.03.012. [DOI] [PubMed] [Google Scholar]
- 83.Haas D, Kelley RI, Hoffmann GF. Inherited disorders of cholesterol biosynthesis. Neuropediatrics. 2001;32:113–122. doi: 10.1055/s-2001-16618. [DOI] [PubMed] [Google Scholar]
- 84.Kelley RI, Hennekam RC. The Smith-Lemli-Opitz syndrome. J Med Genet. 2000;37:321–335. doi: 10.1136/jmg.37.5.321. [DOI] [PMC free article] [PubMed] [Google Scholar]
- 85.Hennekam RC. Congenital brain anomalies in distal cholesterol biosynthesis defects. J Inherit Metab Dis. 2005;28:385–392. doi: 10.1007/s10545-005-7055-2. [DOI] [PubMed] [Google Scholar]
- 86.Caruso PA, Poussaint TY, Tzika AA, et al. MRI and 1H MRS findings in Smith-Lemli-Opitz syndrome. Neuroradiology. 2004;46:3–14. doi: 10.1007/s00234-003-1110-1. [DOI] [PubMed] [Google Scholar]
- 87.Gaoua W, Wolf C, Chevy F, Ilien F, Roux C. Cholesterol deficit but not accumulation of aberrant sterols is the major cause of the teratogenic activity in the Smith-Lemli-Opitz syndrome animal model. J Lipid Res. 2000;41:637–646. [PubMed] [Google Scholar]
- 88.Sakai N. Pathogenesis of leukodystrophy for Krabbe disease: molecular mechanism and clinical treatment. Brain Dev. 2009;31:485–487. doi: 10.1016/j.braindev.2009.03.001. [DOI] [PubMed] [Google Scholar]
- 89.Baram TZ, Goldman AM, Percy AK. Krabbe disease: specific MRI and CT findings. Neurology. 1986;36:111–115. doi: 10.1212/wnl.36.1.111. [DOI] [PubMed] [Google Scholar]
- 90.Clarke JT, Ozere RL, Krause VW. Early infantile variant of Krabbe globoid cell leucodystrophy with lung involvement. Arch Dis Child. 1981;56:640–642. doi: 10.1136/adc.56.8.640-a. [DOI] [PMC free article] [PubMed] [Google Scholar]
- 91.Zafeiriou DI, Anastasiou AL, Michelakaki EM, Augoustidou-Savvopoulou PA, Katzos GS, Kontopoulos EE. Early infantile Krabbe disease: deceptively normal magnetic resonance imaging and serial neurophysiological studies. Brain Dev. 1997;19:488–491. doi: 10.1016/s0387-7604(97)00049-1. [DOI] [PubMed] [Google Scholar]
- 92.Sahai I, Baris H, Kimonis V, Levy HL. Krabbe disease: severe neonatal presentation with a family history of multiple sclerosis. J Child Neurol. 2005;20:826–828. doi: 10.1177/08830738050200100901. [DOI] [PubMed] [Google Scholar]
- 93.Brockmann K, Dechent P, Wilken B, Rusch O, Frahm J, Hanefeld F. Proton MRS profile of cerebral metabolic abnormalities in Krabbe disease. Neurology. 2003;60:819–825. doi: 10.1212/01.wnl.0000049469.29011.e9. [DOI] [PubMed] [Google Scholar]
- 94.Escolar ML, Poe MD, Provenzale JM, et al. Transplantation of umbilical-cord blood in babies with infantile Krabbe’s disease. N Engl J Med. 2005;352:2069–2081. doi: 10.1056/NEJMoa042604. [DOI] [PubMed] [Google Scholar]
- 95.Duffner PK, Caggana M, Orsini JJ, et al. Newborn screening for Krabbe disease: the New York State model. Pediatr Neurol. 2009;40:245–252. doi: 10.1016/j.pediatrneurol.2008.11.010. [DOI] [PubMed] [Google Scholar]
- 96.Escolar ML, Poe MD, Smith JK, et al. Diffusion tensor imaging detects abnormalities in the corticospinal tracts of neonates with infantile Krabbe disease. AJNR Am J Neuroradiol. 2009;30:1017–1021. doi: 10.3174/ajnr.A1476. [DOI] [PMC free article] [PubMed] [Google Scholar]
- 97.Basura GJ, Hagland SP, Wiltse AM, Gospe SM., Jr Clinical features and the management of pyridoxine-dependent and pyridoxine-responsive seizures: review of 63 North American cases submitted to a patient registry. Eur J Pediatr. 2009;168:697–704. doi: 10.1007/s00431-008-0823-x. [DOI] [PubMed] [Google Scholar]
- 98.Stockler S, Plecko B, Gospe SM, Jr, et al. Pyridoxine dependent epilepsy and antiquitin deficiency: clinical and molecular characteristics and recommendations for diagnosis, treatment and follow-up. Mol Genet Metab. 2011;104:48–60. doi: 10.1016/j.ymgme.2011.05.014. [DOI] [PubMed] [Google Scholar]
- 99.Schmitt B, Baumgartner M, Mills PB, et al. Seizures and paroxysmal events: symptoms pointing to the diagnosis of pyridoxine-dependent epilepsy and pyridoxine phosphate oxidase deficiency. Dev Med Child Neurol. 2010;52:e133–142. doi: 10.1111/j.1469-8749.2010.03660.x. [DOI] [PubMed] [Google Scholar]
- 100.Baxter P, Griffiths P, Kelly T, Gardner-Medwin D. Pyridoxine-dependent seizures: demographic, clinical, MRI and psychometric features, and effect of dose on intelligence quotient. Dev Med Child Neurol. 1996;38:998–1006. doi: 10.1111/j.1469-8749.1996.tb15060.x. [DOI] [PubMed] [Google Scholar]
- 101.Baxter P. Pyridoxine dependent and pyridoxine responsive seizures. In: Baxter P, editor. Vitamin responsive conditions in paediatric neurology. MacKeith Press; London: 2001. pp. 109–165. [Google Scholar]
- 102.Gospe SM, Jr, Hecht ST. Longitudinal MRI findings in pyridoxine-dependent seizures. Neurology. 1998;51:74–78. doi: 10.1212/wnl.51.1.74. [DOI] [PubMed] [Google Scholar]
- 103.Hoffmann GF, Schmitt B, Windfuhr M, et al. Pyridoxal 5-phosphate may be curative in early-onset epileptic encephalopathy. J Inherit Metab Dis. 2007;30:96–99. doi: 10.1007/s10545-006-0508-4. [DOI] [PubMed] [Google Scholar]
- 104.Applegarth DA, Toone JR. Glycine encephalopathy (nonketotic hyperglycinaemia): review and update. J Inherit Metab Dis. 2004;27:417–422. doi: 10.1023/b:boli.0000031222.38328.59. [DOI] [PubMed] [Google Scholar]
- 105.Ichinohe A, Kure S, Mikawa S, et al. Glycine cleavage system in neurogenic regions. Eur J Neurosci. 2004;19:2365–2370. doi: 10.1111/j.0953-816X.2004.03345.x. [DOI] [PubMed] [Google Scholar]
- 106.Suzuki Y, Kure S, Oota M, Hino H, Fukuda M. Nonketotic hyperglycinemia: proposal of a diagnostic and treatment strategy. Pediatr Neurol. 2010;43:221–224. doi: 10.1016/j.pediatrneurol.2010.04.018. [DOI] [PubMed] [Google Scholar]
- 107.Hoover-Fong JE, Shah S, Van Hove JL, Applegarth D, Toone J, Hamosh A. Natural history of nonketotic hyperglycinemia in 65 patients. Neurology. 2004;63:1847–1853. doi: 10.1212/01.wnl.0000144270.83080.29. [DOI] [PubMed] [Google Scholar]
- 108.Shah DK, Tingay DG, Fink AM, Hunt RW, Dargaville PA. Magnetic resonance imaging in neonatal nonketotic hyperglycinemia. Pediatr Neurol. 2005;33:50–52. doi: 10.1016/j.pediatrneurol.2005.01.002. [DOI] [PubMed] [Google Scholar]
- 109.Khong PL, Lam BC, Chung BH, Wong KY, Ooi GC. Diffusion-weighted MR imaging in neonatal nonketotic hyperglycinemia. AJNR Am J Neuroradiol. 2003;24:1181–1183. [PMC free article] [PubMed] [Google Scholar]
- 110.Culjat M, Benjak V, Dasovic-Buljevic A, et al. Magnetic resonance findings in a neonate with nonketotic hyperglycinemia: case report. J Comput Assist Tomogr. 2010;34:762–765. doi: 10.1097/RCT.0b013e3181e846d7. [DOI] [PubMed] [Google Scholar]
- 111.Mourmans J, Majoie CB, Barth PG, Duran M, Akkerman EM, Poll-The BT. Sequential MR imaging changes in nonketotic hyperglycinemia. AJNR Am J Neuroradiol. 2006;27:208–211. [PMC free article] [PubMed] [Google Scholar]
- 112.Huisman TA, Thiel T, Steinmann B, Zeilinger G, Martin E. Proton magnetic resonance spectroscopy of the brain of a neonate with nonketotic hyperglycinemia: in vivo-in vitro (ex vivo) correlation. Eur Radiol. 2002;12:858–861. doi: 10.1007/s003300101073. [DOI] [PubMed] [Google Scholar]
- 113.Viola A, Chabrol B, Nicoli F, Confort-Gouny S, Viout P, Cozzone PJ. Magnetic resonance spectroscopy study of glycine pathways in nonketotic hyperglycinemia. Pediatr Res. 2002;52:292–300. doi: 10.1203/00006450-200208000-00024. [DOI] [PubMed] [Google Scholar]
- 114.Cecil KM, DeGrauw TJ, Salomons GS, Jakobs C, Egelhoff JC, Clark JF. Magnetic resonance spectroscopy in a 9-day-old heterozygous female child with creatine transporter deficiency. J Comput Assist Tomogr. 2003;27:44–47. doi: 10.1097/00004728-200301000-00009. [DOI] [PubMed] [Google Scholar]
- 115.Nasrallah F, Feki M, Kaabachi N. Creatine and creatine deficiency syndromes: biochemical and clinical aspects. Pediatr Neurol. 2010;42:163–171. doi: 10.1016/j.pediatrneurol.2009.07.015. [DOI] [PubMed] [Google Scholar]
- 116.Stockler S, Schutz PW, Salomons GS. Cerebral creatine deficiency syndromes: clinical aspects, treatment and pathophysiology. Subcell Biochem. 2007;46:149–166. doi: 10.1007/978-1-4020-6486-9_8. [DOI] [PubMed] [Google Scholar]
- 117.Kim SY, Goo HW, Lim KH, Kim ST, Kim KS. Neonatal hypoglycaemic encephalopathy: diffusion-weighted imaging and proton MR spectroscopy. Pediatr Radiol. 2006;36:144–148. doi: 10.1007/s00247-005-0020-2. [DOI] [PubMed] [Google Scholar]
- 118.Burns CM, Rutherford MA, Boardman JP, Cowan FM. Patterns of cerebral injury and neurodevelopmental outcomes after symptomatic neonatal hypoglycemia. Pediatrics. 2008;122:65–74. doi: 10.1542/peds.2007-2822. [DOI] [PubMed] [Google Scholar]
- 119.Veldman A, Santamaria-Araujo JA, Sollazzo S, et al. Successful treatment of molybdenum cofactor deficiency type A with cPMP. Pediatrics. 2010;125:e1249–1254. doi: 10.1542/peds.2009-2192. [DOI] [PubMed] [Google Scholar]