Abstract
Quantifying the motility of micro-organisms is beneficial in understanding their biomechanical properties. This paper presents a simple image-based algorithm to derive the kinetic power and propulsive force of the nematode Caenorhabditis elegans. To avoid unnecessary disturbance, each worm was confined in an aqueous droplet of 0.5 μl. The droplet was sandwiched between two glass slides and sealed with mineral oil to prevent evaporation. For motion visualization, 3-μm fluorescent particles were dispersed in the droplet. Since the droplet formed an isolated environment, the fluid drag and energy loss due to wall frictions were associated with the worm's kinetic power and propulsion. A microparticle image velocimetry system was used to acquire consecutive particle images for fluid analysis. The short-time interval (Δt < 20 ms) between images enabled quasi real-time measurements. A numerical simulation of the flow in a straight channel showed that the relative error of this algorithm was significantly mitigated as the image was divided into small interrogation windows. The time-averaged power and propulsive force of a N2 adult worm over three swimming cycles were estimated to be 5.2 ± 3.1 pW and 1.0 ± 0.8 nN, respectively. In addition, a mutant, KG532 [kin-2(ce179) X], and a wild-type (N2) worm in a viscous medium were investigated. Both cases showed an increase in the kinetic power as compared with the N2 worm in the nematode growth medium due to the hyperactive nature of the kin-2 mutant and the high viscosity medium used. Overall, the technique deals with less sophisticated calculations and is automation possible.
INTRODUCTION
Biomechanical properties, such as propulsive force, power, and Young's modulus, are crucial in understanding Caenorhabditis elegans.1, 2, 3 For studies regarding motor neurons,4 neuromuscular damage,5 and muscular disorder,6 the properties provide quantitative clues of the worm's physiological changes. However, direct measurements of motility for such a small-sized organism remain challenging due to lack of proper tools. Therefore, analytical solutions as indirect measures are widely used to analyze the worms. Gray and Hancock7 proposed a simple model by treating the sea urchin as a short strip in a plane and applying Taylor sheet theorem to obtain an integral form of the entire propulsive force. According to the theorem, the drag coefficients are different in parallel and perpendicular to the body coordinate. Therefore, a net forward force can be generated as the sea urchin posts a sinusoidal swimming gait. However, the sinusoidal waveform is typically a theoretical model, which may inevitably introduce deviations from the reality. Our findings8 and prior research2, 9 have shown that C. elegans tends to vary its swimming gait in response to the ambient viscosity. Nevertheless, the same theory was later adopted by some research groups to study the nematode neurobiology and behavior10 and characterize the parasitic phenotype.11 Distinct from Gray's model, Jung12 used a wet granular medium to experimentally determine the locomotion of C. elegans based on the resistive force theory. The interactions between the worm and the saturated particulate system provide kinematic parameters for the estimations of Strouhal number and drag coefficients. Fang-Yen et al.2 approximated the nematode's body as a mechanical system consisting of a spring, an active muscular torque, and a damper in parallel. By measuring the internal resistance to bending, the muscle power was estimated. The technique requires to constrain the tail of the worm with a micropipette and then physically bend the worm's head with a hooked end. They successfully quantified the internal viscoelastic properties of the worm's body and their role in the locomotory dynamics, which were never described in the past. Their results suggested that C. elegans locomotory gait continuously adapts to external mechanical load in order to maintain propulsive thrust. By contrast, Sznitman et al.9 improved the theoretical calculations by measuring piecewise velocities along the worm's body. For simplicity, the worm was assumed to be a rod with a squared cross-section. They reasoned that the worm's propulsive force was balanced by the fluid drag at low Reynolds number. The propulsive force was hence obtained by the summation of the piecewise drag forces according to the velocity fields. Although the motility estimation seemed close to the reality, tremendous effort remained necessary to validate the body profile and the velocity near the boundary. Lately, Johari et al.13 reported a direct measurement of the muscular forces of C. elegans using on-chip sensors. The advancement of the bioMEMS technology has led to the rise of microfluidic measures in a variety of nematode applications to date.14, 15 The sensors were made up of polydimethylsiloxane (PDMS) pillars on the scale of several tens of micrometers. When a worm squirms on the chip, the adjacent pillars will be distorted depending on the forces acting on them. By analyzing the bending moment of each pillar from their deformation, the contact forces at different parts of the worm were obtained. However, the forces measured (∼μN) were much higher than the prior studies (∼nN). Taking into consideration that their measured bending frequency was close to the locomotion on agar, the results imply that the technique can explain only the motility in a very viscous medium.
To simplify the measurement process, here we developed an image-based algorithm using a micro-particle image velocimetry (μPIV) system for deriving the kinetic power and propulsive force of C. elegans. By confining a target worm in an aqueous droplet mixed with tracer particles and sandwiching the droplet between two parallel glass slides, the worm's motility can be measured. Mineral oil was used to seal the droplet to prevent evaporation during the measurement. A series of particle images over three swimming cycles were acquired for the image analysis. Considering that the droplet is an isolated space, the motility of the worm can be simply correlated with the fluid drag and wall frictions. Our past results16 and some papers17, 18, 19, 20 have reported that worms in such a confined and aqueous environment tend to be more active but short-lived perhaps due to reduced mechanical load in liquid,20 a different motor program in liquid,19 accumulation of metabolic waste, or food shortage.16 Nevertheless, the aqueous system remains an ideal platform to date for analyzing the biomechanics of the nematodes21 when the motility in liquid is interested and the measurement period is less a few hours. The entire particle image was divided into small interrogation windows to generate a conventional PIV velocity field. As a result, the total power and propulsion were derived from all of the interrogation windows. Since the frame rate of the measurement was at least 50 Hz, quasi real-time variations of motility over three swimming cycles were realized. The final results showed that the time-averaged power and propulsive force of N2 worm in the nematode growth medium (NGM) were 5.2 ± 3.1 pW and 1.0 ± 0.8 nN, respectively. When a hyperactive strain, KG532 [kin-2(ce179) X], and a high viscosity medium (6% dextran solution) were used, increased power values were observed, which were consistent with the expectations. The same technique can also be applied to the biomechanical studies of other micro-swimmers.
METHODS AND MATERIALS
Preparation of worms
C. elegans Bristol strain N2 and the mutant, KG532 [kin-2(ce179) X], were used in the study. N2 is wild-type strain representing reference behavior in this research. KG532 is a hyperactive strain carrying defective gene kin-2, which encodes the regulatory subunit of cyclic adenosine monophosphate (cAMP)-dependent protein kinase (PKA). PKA is known as a major cellular target of cAMP, and both PKA and the PKA substrate cAMP response element-binding protein (CREB) have been implicated as wake-promoting in Drosophila22, 23 as well as in mice.24 Loss-of-function mutants in the gene kin-2 result in an over expression of PKA, leading to the hyperactive phenotype. All worms were cultured and handled as described by Brenner.25 Worms were cultivated at 20 °C on NGM agar plates and fed the Escherichia coli (E. coli) strain OP50. To be consistent, all measurements were started with a one-day-old adult worm (AD1). To obtain young adult worms for measurements, L4 stage worms were picked and transferred to a new agar plate spread with a lawn of E. coli. The isolated worms were then allowed to grow for 8 h in an incubator until turned to the stage of one-day-old adult. For each condition, four worms were measured. During a measurement, the worms might be in an air-conditioned room at a temperature of 22–25 °C for up to 15 min.
Measurement system
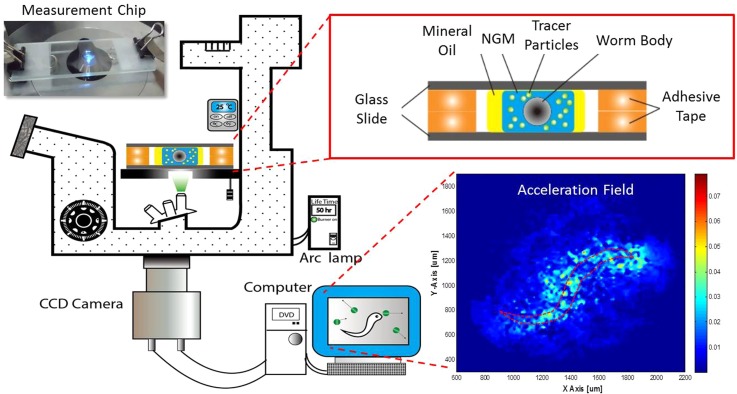
A self-developed μPIV system was used to measure the velocity field induced by a worm in the droplet as shown in Fig. 1. An inverted epi-fluorescent microscope (IX71, Olympus) was the main optical platform for visualizing the fluid motion. A colloidal suspension was prepared by mixing 40-μl polystyrene particles (dp = 3 μm, 540/610, Fisher Scientific) in a 1-ml NGM buffer. To measure the whole image of a 0.5-μl droplet, a 10× objective and a set of filters corresponding to the fluorescent particles were used. Under the fluorescent mode, a dim background light from the top condenser was required to identify the profile of the worm. A high speed camera (GX-3, NAC) was used to acquire consecutive particle images. A frame rate of 50 Hz was typically sufficient for capturing the locomotion of N2. However, a frame rate of 100 Hz was needed when the hyperactive mutant, kin-2, was the target. The total acquisition duration was typically 2 s to allow several swimming cycles included. The configuration and actual appearance of the measurement chip are illustrated in the insets of Fig. 1. A visualized acceleration field is generated to provide the distribution of the total energy in the droplet exerted by the worm. Accordingly, the information can be used to derive the power and propulsive force. A droplet of colloidal suspension was sandwiched between two parallel glass slides separated by two Scotch® tapes (110 μm). Mineral oil (Acros Organics) was used to cover the droplet to prevent evaporation. An AD1 worm was transferred to the droplet before covering it with another glass slide. To allow cleaning and reusing, the glass slides were clamped with two paper clips on both ends. Since the average waist diameter of an adult worm is around 80–90 μm, the gap is just sufficient for a worm to swim in plane. As a result, the out-of-plane movement can be neglected. To avoid serious particle sedimentation (∼1.7 min), the measurement process was always accomplished within 1 min. For a longer measurement, however, smaller polystyrene particles may be used to mitigate the sedimentation. For instance, a 0.2-μm particle will take nearly 6.3 h to migrate from the top to the bottom of the device. Considering that the curvature near the circumference of the droplet might distort the image, images were only acquired when the worm was located in the center of the droplet. The velocity fields were computed by a freeware, JPIV (http://www.jpiv.vennemann-online.de/index.html), with the settings of 16-by-16-pixel interrogation window and 50% overlap. More detailed information regarding the principle of μPIV can be referred to the relevant literature.26, 27, 28
Figure 1.
Schematic of the experimental setup. The insets show the configuration as well as actual appearance of the measurement chip (upper right), and the measured acceleration field (lower right). The area enclosed by the red dotted line is the outline of a N2 worm.
Determinations of kinetic power and propulsive force
In an isolated droplet, the movement of worm is the only source to perturb the liquid. Therefore, the kinetic energy of the liquid is equivalent to the energy exerted by the worm without frictional dissipation based on the law of conservation of energy. In real flow, however, the energy loss due to wall shear stresses from the top and bottom surfaces must be considered. Assume each liquid element (mi) is moved by a horizontal force (Fi) originated from the worm in the confined system, the force relation is given by
| (1) |
where Ri represents the wall frictions from the top and the bottom surfaces, and ai is the acceleration of each liquid element.
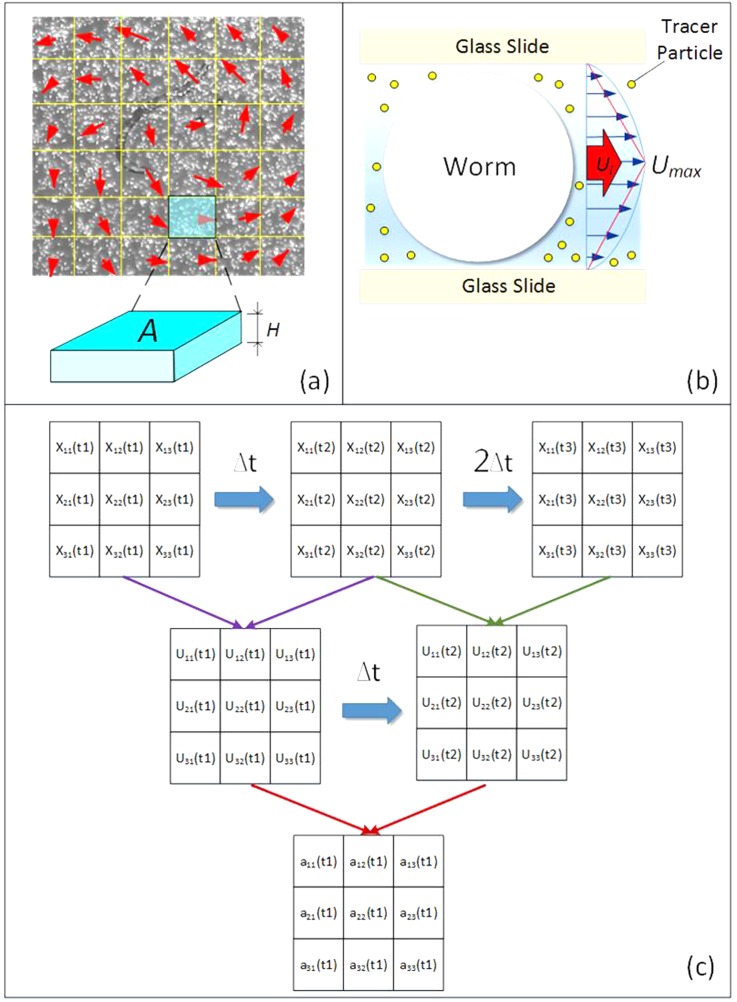
To facilitate the analysis, each captured particle image is divided into numerous interrogation windows (fluid segments) as shown in Fig. 2a. The area, height, and mass of the interrogation window are symbolized as Ai, H, and mi, respectively. Due to the same geometry for all windows, Ai and mi can be further simplified as A and m, respectively. The instantaneous velocity of each interrogation window can be derived from a pair of images based on the spatial cross-correlation algorithm.29 Eventually, an acceleration value is derived from two velocities. When the mass, acceleration, and displacement of each fluid segment are all obtained, the power and force can be determined. At low Reynolds number, the velocity profile reaches parabola in a very short distance and time. Although the nominal focal plane is in the middle depth of the chip, the velocity (ui) measured from the current imaging system remains an average of the parabolic velocity profile due to a thick depth of correlation (zcorr = 55 μm).27 Accordingly, the measured velocity is only equal to two thirds of the maximum velocity (umax). Since the boundary condition at this scale can be treated as no-slip, the shear flow rate is approximated as (umax-0)/(H/2) (Fig. 2b). By taking all the onward effects into consideration, the estimated wall shear stress is finally rewritten as
| (2) |
where μ is the viscosity of the fluid, ui is the velocity of each interrogation window (∼2umax/3), and k is an empirical coefficient derived from the numerical simulation, which is nearly 2.
Figure 2.
Image-based algorithm. (a) A particle image divided into interrogation windows for fluid motion analysis. (b) The parabolic velocity profile of the channel flow induced by a worm. (c) An illustrative flow chart of deriving an acceleration field from three particle images.
Fig. 2c shows a hierarchical structure of the algorithm from three particle images to a final acceleration field. Since a pair of particle images generate an instantaneous velocity field according to the spatial cross-correlation algorithm, three consecutive particle images can provide two velocity fields. According to the two consecutive velocity fields, an acceleration field, where a = (v − v0)/Δt, is finally obtained. The kinetic power of a worm can therefore be expressed as
| (3) |
where is the wall shear stress acting on the adjacent liquid, N is the number of interrogation window, and is the displacement of each interrogation window, which is expressed as
| (4) |
The propulsive force is defined as a component of the total force in parallel with the direction of the worm's forward movement. For simplicity, the centroid coordinate of a worm body is used to represent the worm's position (see supplementary material and Fig. S130). Contrary to , the worm's forward displacement () is a vector connecting from the beginning to the end within a swimming cycle. Consequently, the propulsive force at a particular time step is written as
| (5) |
Noted that the sign of effective forward propulsion is negative; whereas, the sign of backward propulsion is positive. To be able to compare with the prior research, unless mentioned otherwise, all the power and propulsive force shown in the article are time-averaged values over three swimming cycles. Similarly, the same approach can be further applied to analyze the force and power of different aqueous micro-organisms by simply measuring the velocity fields of where they are confined. This feature enables an automated measurement when incorporated with an appropriate control unit.
RESULTS AND DISCUSSION
Validation of the image-based algorithm
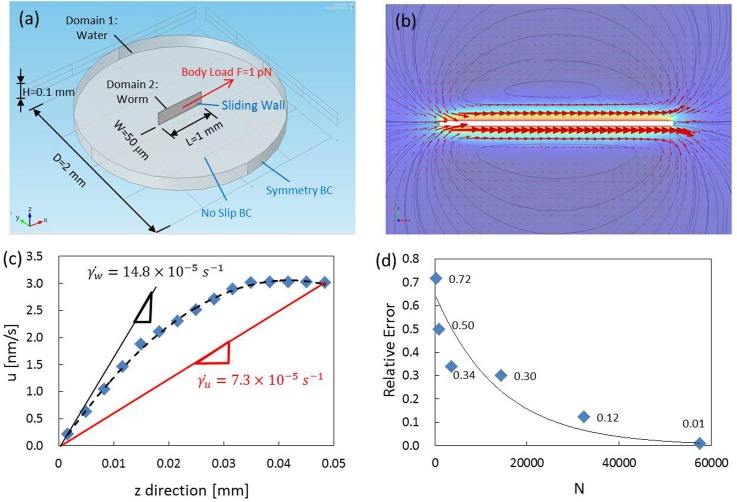
To validate the feasibility of the algorithm, a numerical simulation using a commercial software, Comsol Multiphysics®, was conducted. As shown in Fig. 3a, a 3D time-dependent model composed of a cylinder with dimensions of 2 mm in diameter and 100 μm in height, and a block with dimensions of 1 mm in length, 50 μm in width and 100 μm in height was created. The cylinder representing a water droplet and the block representing a worm were subjected to the incompressible Navier-Stokes equation and the solid mechanics module, respectively. A body load, F = 1 pN, representing a force exerted from a worm was applied to the block in the x direction. For simplicity, the block was treated as a rigid body and the boundary surfaces were free from constraints. Subsequently, the displacement of the block provided a sliding effect on the adjacent boundary walls of the cylinder. The circumferential and the top/bottom walls of the cylinder were set to be symmetry and no-slip boundary conditions. Eventually, a built-in free meshing method based on the tetrahedral structure was used to construct the grids of the entire model.
Figure 3.
Validation of the algorithm with a numerical simulation. (a) Boundary conditions and dimensions of the model. (b) Simulated results expressed in velocity vectors and surface contour in the vicinity of the block. (c) A velocity profile in the depthwise direction at t = 1 ms. (d) A relationship of the relative error and the number of fluid segment (N). The error is below 1% when N reaches 57 600.
A transient velocity field at t = 1 ms was selected for analysis. Equation 3 was employed to extract the power acting on the fluid out of the velocity field. The total fluid was equally divided into N = 15 × 15, 30 × 30, 60 × 60, 120 × 120, 180 × 180, and 240 × 240 segments in the x-y plane. Since the top and bottom walls of the water droplet were under no-slip boundary condition, the simulated velocity field in the x-z plane featured a parabolic profile as shown in Fig. 3c. When considering only the maximum velocity (umax) in the middle plane, the wall shear rate () was estimated to be 7.3 × 10⁻⁵ s−1. When considering the velocity profile, however, the wall shear rate () turned out to be 14.8 × 10⁻⁵ s−1. As a result, a factor of two must be multiplied in the wall shear stress in Eq. 2 when calculating with only the maximum velocity. The relative errors between the calculated power and the theoretical power corresponding to N = 15 × 15, 30 × 30, 60 × 60, 120 × 120, 180 × 180, and 240 × 240 segments were 72%, 50%, 34%, 30%, 12%, and 1%, respectively (Fig. 3d). The relative error decreases rapidly as the number of segment increases. When N exceeds 240 × 240, the relative error is less than 1%, suggesting that a reliable measurement can be achieved with the algorithm. In the study, the number of interrogation window used in the μPIV calculations was set to be 19 625. A higher number would usually cause plenty of void and spurious vectors due to a poor signal-to-noise ratio.
Measurements of power and propulsion of the wild-type worm
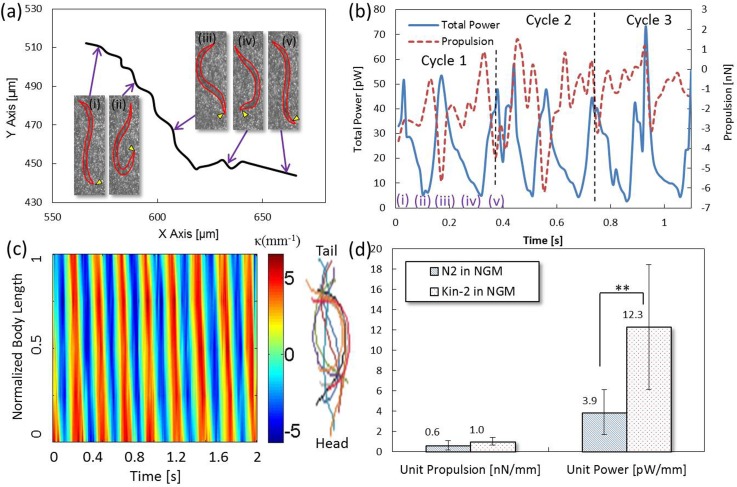
The algorithm was first applied to measure the motility of wild-type worms. Four synchronized AD1 worms were measured separately. The movements of the worms over three swimming cycles were analyzed (see supplementary material Movie S130). A representative trajectory delineated by the centroid of the worm is illustrated in Fig. 4a. Five postures of the worm in different time phases (i), (ii), (iii), (iv), and (v) over a cycle are shown in the insets. Instead of a straight line, the trajectory of the cyclic movement is typically a zig-zag shape due to the worm's sinusoidal gait. Therefore, the power and propulsive force are accordingly undulating with time. Basically, high power has the potential to generate more propulsion. However, the force is not always in favor of forward movement due to the worm's unique swimming gait. Backward movement may occasionally occur when the worm recoils its body in phases (ii) and (iv). The definition of centroid is one of the factors influencing the sign of propulsion since the worm is not fixed in shape. The measured power and propulsion are shown in Fig. 4b. We observed that the total power in a cycle exhibits a trend similar to a letter “W.” Among the four N2 worms measured, the averaged power and propulsion yielding the maximum variations over three swimming cycles were 9.4 ± 0.6 pW and 1.1 ± 1.0 nN, respectively. Noted that the standard deviations herein mean the variations of the averaged values between cycles. When the worm elongates its body in phases (i), (iii), and (v), the output power reaches the maximum; whereas, the power decreases to the minimum when the worm experiences a bending posture in phases (ii) and (iv). Compared with the power, the trend of the propulsion versus time displays a letter “M.” In correspondence to the total power, the propulsive force becomes significant at the maximal power but turns weak at the minimal power. The results suggests that C. elegans recoils its body to store energy and then releases the energy for locomotion by stretching its body. Noted that the negative propulsion herein means forward movement; whereas, the positive propulsion means backward movement. The kinematic degree of the worm was expressed in terms of spatiotemporal contour of body curvature. The contour (Fig. 4c) provides valuable information of body wavelength, bending frequency, and amplitude for biomechanical analysis. For the N2 worms, our measurement indicated that the averaged bending frequency in NGM was 1.9 ± 0.1 Hz. Fig. 4d shows comparisons of the measured motility and the data reported in the prior literature.31, 32, 33 The time-averaged power and propulsion over three swimming cycles were measured to be 5.2 ± 3.2 pW and 0.8 ± 0.5 nN, respectively (see the data in the supplementary material30). The reported time-averaged power and propulsion range from 1.3 pW to 3 pW and from 1.7 to 7.6 nN, respectively. Our measured values appear to be in good agreements with the prior data and on the same order of magnitude. The results imply the feasibility of the proposed algorithm for the motility measurement of micro-swimmers, such as C. elegans. However, the hardware limitation (i.e., a high resolution camera for small tracer particles is required) prohibited the number of interrogation window to be used (N = 19 625), accounting for the large standard deviations in the measurements. As compared with the suggested N = 57 600, a nearly 16% relative error was therefore produced. Moreover, the measurement uncertainties between worms and cycles increased the variability as well. Although the errors are inevitable, worm synchronization and careful operations can improve the uncertainties. The measured values lower than some of the prior data32, 33 are mainly because a perfect sinusoidal waveform was employed in those studies. Actually, our observations suggest that the assumption of a perfect sinusoidal waveform does not precisely reflect the real swimming gait. For instance, the worm tends to thrash its body for locomotion in low viscosity medium (i.e., water) but turns to snake-like swimming in high viscosity medium (i.e., agar). In addition, the swimming gait during the transitional phases (ii) and (iv) is more like a hook than a sinusoidal waveform. The imperfection hence results in the slightly low motility from the measurements.
Figure 4.
Motility of a N2 adult worm in the NGM buffer. (a) Trajectory of the worm's body centroid over a swimming cycle. The insets show postures in different time phases. The arrow indicates the head of the worm. (b) Variations of power and propulsion over three cycles. (c) A spatiotemporal contour of the worm's body curvature. The color lines are overlaps of the centerlines of the worm. (d) Comparisons of our measurements (n = 4) and some prior studies.
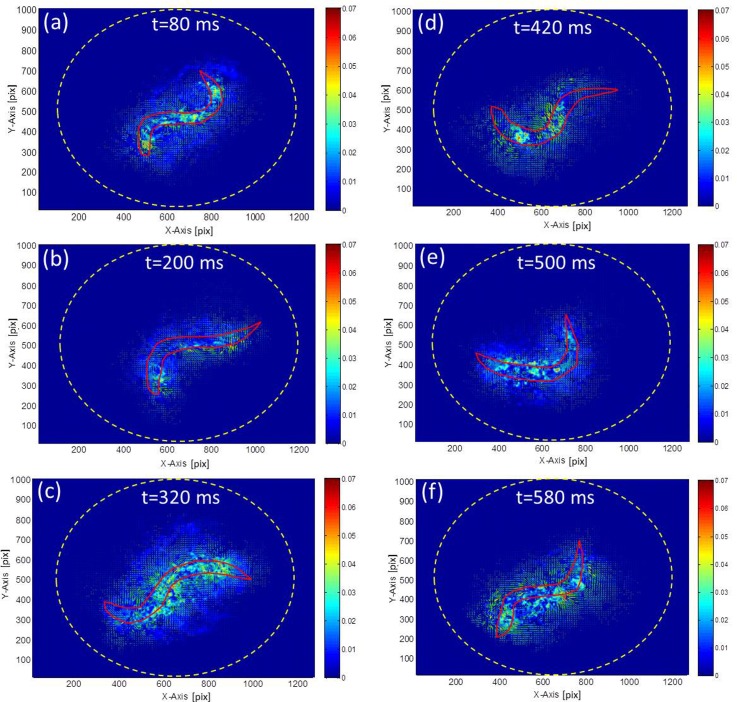
Acceleration fields were derived for the power and propulsion calculations. Fig. 5 shows a series of acceleration fields in a droplet corresponding to six time phases over a swimming cycle. The arrows indicate the velocities. The acceleration fields reveal that the power acting on the fluid decays rapidly as the distance from the worm increases. Therefore, the velocities in the vicinity of the worm dominate the measurement result. Compared with the results discussed in Fig. 4, Fig. 5 provides a visible evidence showing that the worm's kinetic power decreases during the transitional phases (Figs. 5b, 5e), i.e., bending postures in phases (ii) and (iv) in Fig. 4, but increases during the energy release by stretching its body (Figs. 5a, 5c, 5f), i.e., phases (i), (iii) and (v) in Fig. 4.
Figure 5.
Acceleration (filled contour) and velocity (arrows) fields generated by a N2 worm in the NGM buffer captured in different time phases (a)–(f) over a swimming cycle. The red line represents the profile of the worm. The yellow dotted circle represents the outline of the droplet.
Effects of strain and liquid viscosity to motility changes
To understand the motility changes in different conditions, the same system was also used to investigate the mutant, kin-2, in the NGM buffer (see supplementary material Movie S230) and the wild-type worms in a high viscosity medium (see supplementary material Movie S330). Four measurements were conducted for each condition. Fig. 6 shows the measurement result of the kin-2 mutant's motility. Since the mutant is defective in the kin-2 gene (loss of function), PKA will be higher than normal. As a result, the mutant features hyperactive motility and hyper-responses as an adult.34 A representative trajectory of movement over a cycle based on the worm's body centroid is shown in Fig. 6a. The worm's postures corresponding to different time phases are exhibited in the insets. To be consistent, the initial posture of the worm was arranged to be the same as the previous N2 in Fig. 4a. Fig. 6b shows variations of the power and propulsive force of the worm over three swimming cycles. Similarly, the power versus time displays a letter “W” in a cycle due to the same swimming gait as the N2 worm. In light of the propulsive force, it becomes strong when the output power escalates but turns weak when the output power decreases. The averaged power and propulsion yielding the maximum variations among the four kin2 worms measured were 25.4 ± 1.6 pW and 1.8 ± 0.5 nN, respectively. A spatiotemporal contour of the kin-2 worm's body curvature is shown in Fig. 6c. A higher bending frequency (2.4 ± 0.1 Hz) under the same amplitude as the N2 worm in the NGM buffer was observed, confirming the hyperactive feature of the mutative strain. Comparisons of the motility performances between the N2 and the kin-2 mutant are shown in Fig. 6d. To avoid size effect, the power and force are divided by each worm's body length. As expected, the kin-2 mutant exerts stronger unit power (12.3 ± 6.2 pW/mm) than the N2 worm (3.9 ± 2.2 pW/mm) (see the data in the supplementary material30). Similarly, the hyperactive characteristic can contribute to the propulsion, resulting in a fast swimming phenotype. However, sometimes our observations showed that a fraction of the total power may be also divided to useless movements which lower the propulsion when the worm's trajectory is seriously tangled. In spite of the occasionally inferior propulsive force, the measurement still proves that the kin-2 mutant intrinsically possesses more energy than its wild-type counterpart.
Figure 6.
Motility of a kin-2 adult mutant in the NGM buffer. (a) Trajectory of the worm's body centroid over a swimming cycle. The insets show postures in different time phases. The arrow indicates the head of the worm. (b) Variations of power and propulsion over three cycles. (c) A spatiotemporal contour of the worm's body curvature. The color lines are overlaps of the centerlines of the worm. (d) Comparisons of the N2 (n = 4) and the kin-2 worms (n = 4). ** denotes p < 0.1 based on the Mann-Whitney U test.
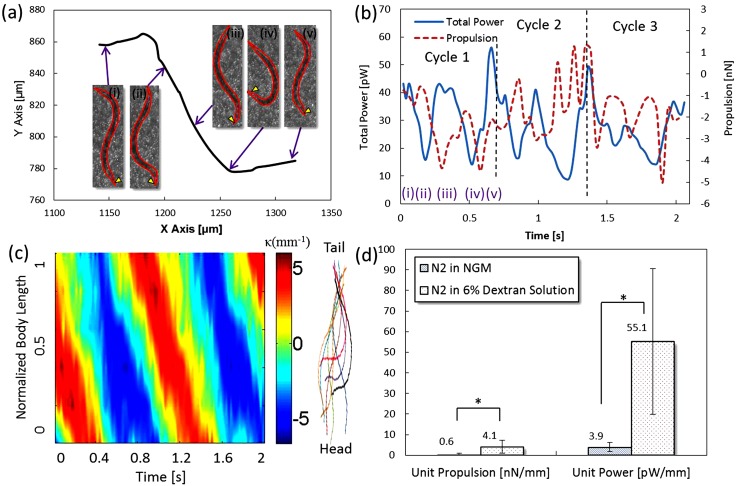
In addition to the comparisons of different strains, a condition of a higher viscosity environment was also investigated. A medium with viscosity of 10 mPa s was made by mixing dextran (FL-95771/MW = 2 000 000, Sigma) with the NGM buffer to achieve a 6% dextran solution. Numerous studies2, 8, 9, 31 have reported that C. elegans is able to sense the ambient viscosity change and make a behavioral response according to the coordination between sensory and motor neurons. A representative trajectory of movement and a relationship of power and propulsion similar to the previous N2 and kin-2 are depicted in Figs. 7a, 7b, respectively. The averaged power and propulsion yielding the maximum variations among the four worms measured were 32.1 ± 10.9 pW and 4.3 ± 1.5 nN, respectively. A spatiotemporal contour is shown in Fig. 7c. Under such a resistive environment, the N2 worm tends to have a low bending frequency (1.2 ± 0.1 Hz) and a low swimming speed (317 ± 87 μm/s). Despite the low frequency, the bending amplitude seems to remain the same. As a result, the unit power (55.1 ± 35.4 pW/mm) and unit propulsion (4.1 ± 3.2 nN/mm) outperform the same strain in the NGM buffer (∼1 mPa s) (see the data in the supplementary material30). Prior research31 stated that a low bending frequency allows the worm's muscle to fully contract and then release the stored energy. As a result, the power is positively proportional to the increased viscosity (Fig. 7d). Because the N2 worm's power is fully contributed to its forward movement, the propulsive force is stronger than the N2 in the NGM buffer.
Figure 7.
Motility of a N2 adult worm in the 6% dextran solution. (a) Trajectory of the worm's body centroid over a swimming cycle. The insets show postures in different time phases. The arrow indicates the head of the worm. (b) Variations of power and propulsion over three cycles. (c) A spatiotemporal contour of the worm's body curvature. The color lines are overlaps of the centerlines of the worm. (d) Comparisons of the N2 worms (n = 4) in the NGM buffer and 6% dextran solution (n = 4). * denotes p < 0.05 and based on the Mann-Whitney U test.
Kinematic effects
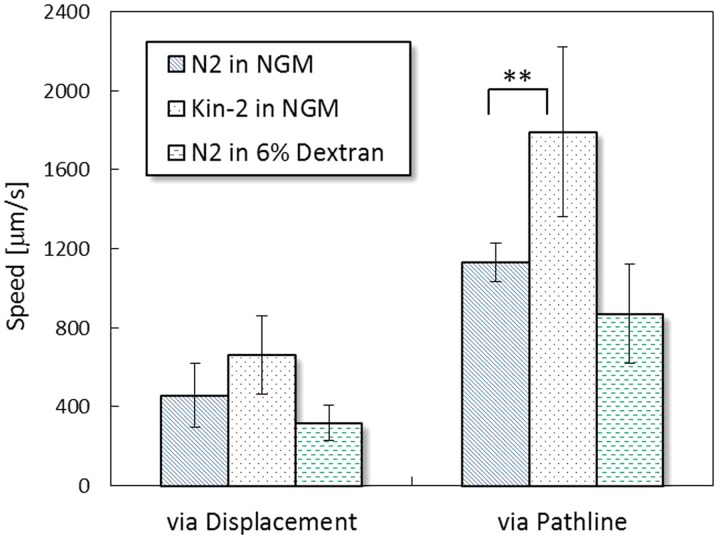
Fig. 8 shows comparisons of the swimming speeds of all the three conditions mentioned previously, including N2 in the NGM buffer, kin-2 in the NGM buffer, and N2 in the 6% dextran solution. A displacement is defined as the straight distance between the starting and the ending points produced by a worm's body centroid. A pathline is defined as the entire route rendered by a worm's body centroid. By treating the N2 worm's pathline and displacement speeds as references, we concluded that the kin-2 mutant is a fast swimmer because of the hyperactive nature. The high pathline and displacement speeds of the kin-2 coincide with the high power and high propulsion measured in Sec. 3C. Another interesting finding is the decreases in both pathline and displacement speeds of the N2 worm in the 6% dextran solution. Unlike the powerful motility shown in the previous measurements, the low values are kind of misleading at the first sight of them. The mismatch is due to the high viscosity (10 mPa s) and slightly change of density (1030 kg/m3). When both are considered in the calculations, the power and propulsive force of the N2 worm will significantly escalate. Overall, the speeds reveal the information matching our direct observations yet disguise the deeper truth. However, the image-based algorithm developed herein allows us to excavate the true biomechanical properties underneath the disguise. The comparisons prove that the algorithm should be feasible to provide a simple and automated measure for characterizing the motility of different micro-swimmers.
Figure 8.
Swimming speeds derived from the displacements and pathlines in the three experimental conditions (n = 4). ** denotes p < 0.1 based on the Mann-Whitney U test.
CONCLUSIONS
By incorporating the powerful tool, μPIV, into the microfluidic analysis with a self-developed image-based algorithm, the motility of C. elegans can be characterized in a simple way. By confining a worm in an aqueous droplet of 0.5 μl sandwiched by two glass slides, the worm is isolated in a control volume. The worm's motility is estimated from its interaction with the surrounding fluid. The fluid motion is visualized through seeded tracer particles. When velocity fields are obtained, an acceleration field is determined simultaneously. We proved that the kinetic power can be derived from the fluid power plus the dissipated power due to the wall frictions with a simulation. The result showed that the relative error is below 1% as the number of fluid segment exceeds 57 600. In order to show the algorithm feasible in various conditions, N2 in the NGM buffer, kin-2 in the NGM buffer, and N2 in the 6% dextran solution were investigated. The N2 worms in the NGM buffer yielded a time-averaged power of 5.2 ± 3.1 pW and a time-averaged propulsive force of 1.0 ± 0.8 nN. Compared with the prior literature,2, 9, 32, 33 our measurements and their data are on the same order of magnitude. In addition, the unit power and unit propulsion of the kin-2 in the NGM buffer were measured to be 8.2 ± 4.2 pW/mm and 1.1 ± 0.5 nN/mm, respectively. The escalated power and propulsion reflect the hyperactive nature of the strain. An increased medium viscosity (10 mPa s) was also conducted to investigate the motility change of the N2 worm. Despite decreased swimming speeds, both unit power (63.6 ± 37.9 pW/mm) and unit propulsion (4.3 ± 3.0 nN/mm) significantly increased as expected.2, 31 The large standard deviations can be attributed to the insufficient number of interrogation window (N = 19 625) as compared with the suggested N = 57 600 in the current study. An improvement can be achieved with smaller particles and a camera with finer pixel size. Overall the comparisons showed good agreements with the predictions, which also validated the feasibility of the algorithm. In general, the developed technique features simple and dynamic measurements as compared with the prior techniques. We expect the technique can provide a simple platform to characterize the motility of more micro-swimmers, such as bacteria and cells, in the near future.
ACKNOWLEDGMENTS
The authors are grateful to the support from the research grant NSC 102-2221-E-006-024- MY2. The authors would also like to thank Professor Chang-Shi Chen from the Institute of Biochemistry and Molecular Biology at NCKU for his generous support and technical advice for C. elegans.
References
- Sznitman J. et al. , Biophys. J. 98, 617 (2010). 10.1016/j.bpj.2009.11.010 [DOI] [PMC free article] [PubMed] [Google Scholar]
- Fang-Yen C. et al. , Proc. Natl. Acad. Sci. U. S. A. 107, 20323 (2010). 10.1073/pnas.1003016107 [DOI] [PMC free article] [PubMed] [Google Scholar]
- Park S.-J., Goodman M. B., and Pruitt B. L., Proc. Natl. Acad. Sci. U. S. A. 104, 17376 (2007). 10.1073/pnas.0702138104 [DOI] [PMC free article] [PubMed] [Google Scholar]
- Dimitriadi M. and Hart A. C., Neurobiol. Dis. 40, 4 (2010). 10.1016/j.nbd.2010.05.012 [DOI] [PMC free article] [PubMed] [Google Scholar]
- Liu Q., Hollopwter G., and Jorgensen E. M., Proc. Natl. Acad. Sci. U. S. A. 106, 10823 (2009). 10.1073/pnas.0903570106 [DOI] [PMC free article] [PubMed] [Google Scholar]
- Lakso M. et al. , J. Neurochem. 86, 165 (2003). 10.1046/j.1471-4159.2003.01809.x [DOI] [PubMed] [Google Scholar]
- Gray J. and Hancock G. J., J. Exp. Biol. 32, 802 (1955). [Google Scholar]
- Sie Y. S. and Chuang H. S., Microfluid. Nanofluid. 16, 65 (2014). 10.1007/s10404-013-1219-4 [DOI] [Google Scholar]
- Sznitman J. et al. , Phys. Fluids 22, 121901 (2010). 10.1063/1.3529236 [DOI] [Google Scholar]
- Lockery S. R. et al. , J. Neurophysiol. 99, 3136 (2008). 10.1152/jn.91327.2007 [DOI] [PMC free article] [PubMed] [Google Scholar]
- Chen B. et al. , Parasitology 138, 80 (2011). 10.1017/S0031182010001010 [DOI] [PMC free article] [PubMed] [Google Scholar]
- Jung S. H., Phys. Fluids 22, 031903 (2010). 10.1063/1.3359611 [DOI] [Google Scholar]
- Johari S. et al. , Lab Chip 13, 1699 (2013). 10.1039/c3lc41403e [DOI] [PubMed] [Google Scholar]
- Lycke R., Parashar A., and Pandey S., Biomicrofluidics 7, 064103 (2013). 10.1063/1.4829777 [DOI] [PMC free article] [PubMed] [Google Scholar]
- Aubry G. and Lu H., Biomicrofluidics 8, 011301 (2014). 10.1063/1.4865167 [DOI] [PMC free article] [PubMed] [Google Scholar]
- Belfer S. J. et al. , Sleep 36, 689 (2013). 10.5665/sleep.2628 [DOI] [PMC free article] [PubMed] [Google Scholar]
- Hulme S. E. et al. , Lab Chip 10, 589 (2010). 10.1039/b919265d [DOI] [PMC free article] [PubMed] [Google Scholar]
- Gray J. and Lissmann H. W., J. Exp. Biol. 41, 135 (1964). [DOI] [PubMed] [Google Scholar]
- Pierce-Shimomura J. T. et al. , Proc. Natl. Acad. Sci. U. S. A. 105, 20982 (2008). 10.1073/pnas.0810359105 [DOI] [PMC free article] [PubMed] [Google Scholar]
- Korta J. et al. , J. Exp. Biol. 210, 2383 (2007). 10.1242/jeb.004572 [DOI] [PubMed] [Google Scholar]
- Shi W. et al. , Lab Chip 8, 1432 (2008). 10.1039/B808753A [DOI] [PubMed] [Google Scholar]
- Joiner W. J. et al. , Nature 441, 757 (2006). 10.1038/nature04811 [DOI] [PubMed] [Google Scholar]
- Hendricks J. C. et al. , Nat. Neurosci. 4, 1108 (2001). 10.1038/nn743 [DOI] [PubMed] [Google Scholar]
- Graves L. A. et al. , J. Neurophysiol. 90, 1152 (2003). 10.1152/jn.00882.2002 [DOI] [PubMed] [Google Scholar]
- Brenner S., Genetics 77, 71 (1974). [DOI] [PMC free article] [PubMed] [Google Scholar]
- Chuang H. S., Gui L., and Wereley S. T., Microfluid. Nanofluid. 13, 49 (2012). 10.1007/s10404-012-0939-1 [DOI] [Google Scholar]
- Chuang H. S., Kumar A., and Wereley S. T., in Methods in Biology: Biomicrofabrication and Biomicrofluidics, edited by Zahn J. D. (Artech House, Boston/London, 2010), p. 281. [Google Scholar]
- Santiago J. G. et al. , Exp. Fluids 25, 316 (1998). 10.1007/s003480050235 [DOI] [Google Scholar]
- Keane R. D. and Adrian R. J., Appl. Sci. Res. 49, 191 (1992). 10.1007/BF00384623 [DOI] [Google Scholar]
- See supplementary material at http://dx.doi.org/10.1063/1.4872061 for the identification of the centroid of a worm in a particle suspension medium, the data of the measured propulsion and power and movies showing a N2 worm swimming in the NGM buffer, a kin-2 mutant swimming in the NGM buffer, and a N2 worm swimming in a 6% dextran solution.
- Krajacic P. et al. , Genetics 191, 1015 (2012). 10.1534/genetics.112.141176 [DOI] [PMC free article] [PubMed] [Google Scholar]
- Katz D. F., Blake J. R., and Paverifontana S. L., J. Fluid Mech. 72, 529 (1975). 10.1017/S0022112075003126 [DOI] [Google Scholar]
- Hancock G. J., Proc. R. Soc. London, Ser. A 217, 96 (1953). 10.1098/rspa.1953.0048 [DOI] [Google Scholar]
- Harris G. et al. , J. Neurosci. 30, 7889 (2010). 10.1523/JNEUROSCI.0497-10.2010 [DOI] [PMC free article] [PubMed] [Google Scholar]


