

Abstract
The development of an all-glass separation-based sensor using microdialysis coupled to microchip electrophoresis with amperometric detection is described. The system includes a flow-gated interface to inject discrete sample plugs from the microdialysis perfusate into the microchip electrophoresis system. Electrochemical detection was accomplished with a platinum electrode in an in-channel configuration using a wireless electrically isolated potentiostat. To facilitate bonding around the in-channel electrode, a fabrication process was employed that produced a working and a reference electrode flush with the glass surface. Both normal and reversed polarity separations were performed with this sensor. The system was evaluated in vitro for the continuous monitoring of the production of hydrogen peroxide from the reaction of glucose oxidase with glucose. Microdialysis experiments were performed using a BASi loop probe with an overall lag time of approximately five minutes and a rise time of less than 60 seconds.
Keywords: glass microchip, electrochemical detection, microchip electrophoresis, microdialysis, microfluidics
1. Introduction
Microdialysis is a well-established sampling technique that makes it possible to perform continuous monitoring of small molecules present in complex media both in vivo and in vitro. Sampling is accomplished by pumping a perfusate solution that is similar in composition to the sample being analyzed through a semipermeable probe. Small molecules then diffuse across the membrane based on the concentration gradient while larger compounds, such as proteins and other macromolecules, are excluded. Sampling is generally performed at flow rates of one microliter per minute or less in order to obtain good temporal resolution and high analyte recoveries. Since most analytical methods require several microliters of sample for analysis, this leads to temporal resolution of tens of minutes. For the best temporal resolution, techniques able to analyze submicroliter samples are desirable. Toward this end, capillary electrophoresis has been used extensively for the analysis of microdialysis samples due to its nanoliter-to-picoliter volume requirements.[1–5]
More recently, microchip electrophoresis (MCE) has been employed for the analysis of microdialysis samples.[3–14] Like capillary electrophoresis, it has several advantages for analysis of these samples. These include the ability to analyze submicroliter sample volumes and the potential to perform fast, highly efficient separations. In addition, MCE offers the possibility of integrating sample preparation and detection components directly into the chip. Huyhn et al. first reported the direct coupling of microdialysis with microchip electrophoresis (MD-MCE) in 2004.[12] This marriage of techniques leads to a separation-based sensor that is capable of monitoring in vivo concentrations of several analytes simultaneously for near real-time analysis.
Pre-, post-, and in-channel derivatization with fluorescence detection are the most common approaches employed for the detection of analytes by microdialysis-microchip electrophoresis systems.[8–14] Coupling MD-MCE with LIF detection is a popular method for obtaining high temporal resolution for near real-time analysis of primary amines. While this method is selective and sensitive, not all compounds of interest can be easily derivatized. In addition, derivatization adds complexity to the design and fabrication of the microchip device.
Applications of microdialysis-microchip electrophoresis with electrochemical detection (MD-MCE-EC) are less common. The most significant work has been performed by the Martin group using PDMS devices that are equipped with integrated, pneumatically actuated valves used to introduce sample plugs from the microdialysis stream into the separation channel. This approach has been employed for MD-MCE-EC monitoring of dopamine released from PC 12 cells in culture.[15] Electrochemical detection was accomplished using carbon ink microelectrodes printed on a glass plate with palladium contact pads overlaid with the PDMS microfluidic device.
A goal of our research group is to develop a separation-based sensor that can be placed on-animal for continuous monitoring of drug metabolism and neurotransmitters in freely roaming animals.[16] Since the entire system (chip and associated electronics) must be able to fit on the back of a large laboratory animal, using pneumatically actuated valves is not feasible. For these reasons, we have developed an all-glass microfluidic device with flow-gated injection for MD-MCE-EC. In this case, the injection process can be remotely controlled using a telemetry-enabled power supply mounted to a miniaturized portable device. An all-glass microfluidic device was chosen over one made of PDMS because it can withstand higher pressures without delamination. Additionally, the electroosmotic flow in glass MCE devices is more reproducible and stable over long periods of time.[17] There have been few reports in the literature concerning the fabrication of an all-glass chip with integrated electrochemical detection for microchip electrophoresis.[18–22] The main deterrent in producing such devices is the ability to completely seal the two pieces of glass in the vicinity of the electrode, especially in the cases where the electrode (or decoupler) is placed in the channel.
In this paper, we describe the fabrication and evaluation of an all-glass MD-MCE chip with integrated electrochemical detection. Electrochemical detection is accomplished in an in-channel configuration using an electrically isolated wireless potentiostat.[23] The device is evaluated for the in vitro monitoring of hydrogen peroxide generated by glucose oxidase, as well as for the separation and detection of biological analytes in both positive and negative polarity mode.
2. Materials and Methods
2.1. Reagents and Materials
Tetradecyltrimethyl ammonium bromide (TTAB), sodium nitrite, sodium chloride, ascorbic acid, and glucose were purchased from Sigma-Aldrich (St. Louis, MO). Boric acid, 49% hydrofluoric acid, hydrochloric acid, hydrogen peroxide, nitric acid, methanol, isopropyl alcohol and acetone were purchased from Fisher Scientific (Pittsburgh, PA). Glucose oxidase was purchased from BBI Enzymes (Madison, WI). Solutions were prepared in deionized water (18 MΩ) using a Millipore A10 system (Billerica, MA). Chrome and AZ1518 photoresist-coated soda-lime glass blanks were obtained from Nanofilm (Westlake Village, CA). AZ® 300 MIF was purchased from Capitol Scientific, Inc. (Austin, TX). Chrome etchant (CR-7S) was purchased from Cyantek Corp. (Freemont, CA). Platinum (Pt) and titanium (Ti) sputtering targets were purchased from the Kurt J. Lesker Company (Jefferson Hills, PA). Colloidal silver was purchased from Ted Pella, Inc. (Redding, CA). PEEK tubing was purchased from IDEX Health & Science (Oak Harbor, WA). DL-1 loop microdialysis probes were purchased from BAS, Inc. (West Lafayette, IN).
2.2. Microchip Fabrication
The all-glass microdialysis-microchip electrophoresis device with embedded platinum working and reference electrodes was fabricated in-house. The chip configuration is shown in Figure 1. The microfluidic channels and integrated electrode designs were drawn using AutoCAD software (Autodesk, San Rafael, CA) to produce a negative tone mask transparency (Infinite Graphics, Inc., Minneapolis, MN). The printed masks were overlaid on 4″ × 4″× 0.060″ chrome and AZ1518 photoresist coated soda-lime glass blanks. The plates were photolithographically patterned using an I-line UV flood source with an exposure dose of 86 mJ/cm2 (ABM, Inc., Scotts Valley, CA), developed in AZ® 300 MIF for 30 seconds and baked at 100°C for 10 minutes using a hot plate. Once the photoresist is developed and hardened, the exposed chrome layer is etched using chrome etchant.
Figure 1.
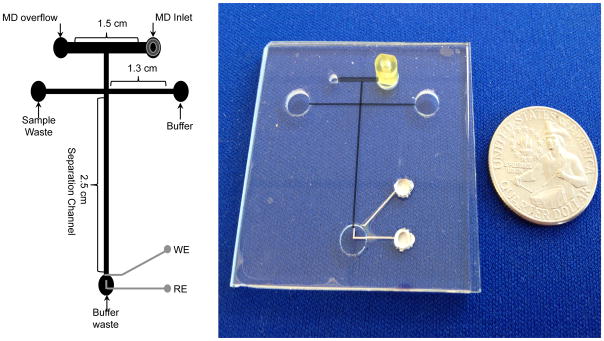
A schematic of the “double T” 2.5 cm microchip design and electrode placement for flow-through studies MD-MCE studies with channel dimensions. All microfludic channels were etched to 15 μm deep and 40 μm wide, except for the microdialysis inlet channel, which was 500 μm wide.
Fluid wells were drilled in the plate containing the microfluidic channels using a 1.55 mm diamond drill bit (TrueBite, Inc., Vestal, NY) mounted in a Dremel® drill press. The microfluidic wells and access holes were drilled before the glass was etched. This allows the etching process to smooth the splintering and roughness of the access holes caused during the drilling process, as well as to remove any debris from the drilling process. The plates were then etched at a rate of 5 μm/min in a 20:14:66 solution (49% hydrofluoric acid: concentrated nitric acid: water) to a depth of 15 microns for the microfluidic channels.[24] Etch depths were verified using an Alpha-Step 200 stylus profilometer (Tencor, Milpitas, CA). The patterned and etched glass blanks were then cut into individual chips using a tungsten carbide cutting wheel, resulting in four chips per plate. Following a thorough water rinse, the etched plates were placed in an acetone bath to dissolve the layer of AZ® 1518 photoresist. The remaining chromium was then removed from each piece using CR-7S etchant.
To produce the embedded platinum electrodes, recesses in a separate glass plate for electrode deposition were patterned and developed using the same photolithographic methods as described above. However, in this case, the patterned glass plates were etched in 10:1 buffered oxide etchant (JT Baker, Austin, TX) with an etch rate of 0.35 μm/min, to produce a trench with a depth of approximately 400 nm. Following a thorough water rinse, the plate was dried on a hotplate at 100°C for 10 minutes. It was then exposed to oxygen plasma (March Plasmod, Concord, CA) for 1 minute in order to promote adhesion of the metal to the etched glass surface.[25] Immediately following the oxygen plasma treatment, the glass plate was placed directly into the vacuum chamber of an AXXIS DC magnetron sputtering system (Kurt J. Lesker Co.) and pumped down to a base pressure of 5.0 × 10⁻⁷ Torr. Using argon as the process gas, a 20 nm adhesion layer of titanium was deposited, followed by a 400 nm layer of platinum metal. All deposition was done at a pressure of 2.4 × 10⁻³ Torr, with applied powers of 220 W and 200 W, respectively. The excess metal around the electrodes was lifted off in an acetone bath. The remaining chromium layer was removed from each piece using the aforementioned CR-7S etchant. This process resulted in glass plates with embedded Pt electrodes, as can be seen in Figure 1.
To complete the fabrication of the microfluidic device, the two halves were thoroughly scrubbed with an Aconox™ soaked sponge, and rinsed with DI water.[26] After drying with nitrogen, the two halves were then exposed to an oxygen plasma for 2 min. After plasma treatment, the two halves were brought together under a stream of deionized pure water, and then visually inspected for the presence of air bubbles between the glass plates. If bubbles were present, the plates were pried apart and the previous step repeated until none were present. The plates were then more-precisely aligned under a microscope so that the front of the working electrode was positioned no more than five microns into the end of the separation channel. Four assembled chips were then placed between two ceramic tiles in a programmable muffle furnace (750 Series, Fisher Scientific) for thermal bonding, with a 300 g weight being placed over each chip (11.6 g/cm2). The temperature ramping protocol that follows was adapted from previous publications.[27] The temperature was ramped from 25°C to 540°C at 3°C/min, then ramped to 630°C at a rate of 4°C/min. The temperature was held at 630°C for 3 hours, cooled at 3°C/min to 540°C, and then cooled at 1.5°C/min to the annealing temperature of 510°C and held there for 30 minutes. Following the annealing process, the furnace was cooled to 460°C at 0.5°C/min to minimize the induction of stress after annealing. After the kiln temperature was below the strain point of the glass, it was cooled to room temperature at 5°C/min.
Additionally, for some of the devices used in this study, a calcium-assisted bonding step, as described by Chiu et al., was used in conjunction with full thermal bonding.[28] For the calcium-assisted bonding step, the substrate surfaces were washed with a 5% Alconox™ solution by using a fiber wipe to gently scrub each plate with the solution. The substrates were then washed again in a 5% Alconox™/5% calcium acetate solution and then the etched sides of each plate were gently rubbed together for approximately 2 minutes. This wash step with 5% Alconox™/5% calcium acetate solution was repeated three times. The plates of glass were rinsed with water while the electrodes and the microfluidic channels were roughly aligned by hand. The chip was then visually inspected to ensure that no air bubbles were present between the glass plates. The plates were then more precisely aligned under a microscope so that the front of the working electrode was positioned no more than five microns into the end of the separation channel. The assembled chip was then clamped using binder clips to ensure that the electrode alignment did not shift during processing. The clamped chip was then placed in a low temperature oven (Lindberg/Blue-M, SPX Thermal Product Solutions, Riverside, MI) at 65°C for one hour after which time the temperature was increased to 110°C for a minimum of 2 hours. Longer curing times of up to 96 hours for the calcium-assisted bonding promote a significantly higher success rate for full thermal bonding of the substrates. The assembled chip was then inspected for proper electrode alignment and for areas of nonspecific binding identified by Newton rings. In the case of electrode misalignment or the formation of Newton rings, the chip can easily be pried apart and reassembled by repeating the procedure above until all requirements are met. This process, while more time intensive, allows for the elimination of weights used in the thermal bonding process.
After the glass plates were bonded together, bonded port connectors and fittings were attached to the chip using LS EPOXY two-part adhesive (Labsmith, Livermore, CA) over one of the access holes for the microdialysis sampling channel. Copper wires were also connected to the platinum reference and working electrodes through the access holes using colloidal silver.
2.3. Evaluation On-line
2.3.1. Direct infusion method
Direct infusion experiments were accomplished using a CMA 107 syringe pump (N. Chelmsford, MA) connected to the chip using 15cm of 1/32 × 0.005 PEEK tubing. The syringe was filled with either 50 mM boric acid buffer at pH 9.2, or 10 mM boric acid buffer containing 2 mM TTAB at pH 9.2, depending on the experiment. The experimental setup is shown in Figure 2A.
Figure 2.

A) Experimental setup for the direct perfusion of analyte into the device. B) Experimental setup for the microdialysis sampling, which includes the loop microdialysis probe inside the reaction well.
2.3.2. Microdialysis sampling
Microdialysis sampling was accomplished using a BASi loop microdialysis probe with a 1 cm membrane and 30 kDa molecular weight cut-off. Each side of the 1 cm semipermeable membrane has 16 cm of fluorinated ethylene propylene (FEP) tubing, which can be cut to desired lengths. The probe was placed in an open 2 mL sample vial, which was used as a reaction well. The reaction well was then placed in a sample holder and secured to a stage (Fig. 2B). The FEP tubing from the probe was connected to the syringe pump; all 16 cm of the attached tubing was used in this case. To connect the probe to the chip, 6 cm of the 1/32 × 0.005 FEP tubing was removed and replaced with 5 cm of PEEK tubing with similar dimensions using tubing connectors. The probe was connected to the chip using 1/32 LabSmith connectors and fittings (LabSmith, Livermore, CA). This setup results in having 16 cm of tubing going from the syringe to the probe and 15 cm of tubing going from the probe to the chip.
Before each experiment, a conditioning procedure was performed on the chip that consisted of a rinse with methanol for 5 minutes followed by deionized water for 5 minutes. The chip was then rinsed with 0.1 N HCl for 5 minutes, followed by deionized pure water for 5 minutes. The final conditioning step consisted of a 10-minute rinse with 0.1 N NaOH followed by an additional 10-minute rinse with the run buffer. Following the conditioning procedure, the chip was secured to a stage. A high voltage lead was placed into the buffer reservoir of the chip, and ground leads were placed into the buffer waste and sample waste reservoirs. The voltage applied to the buffer reservoir was set at ± 1600 V (positive/reverse polarity). Using Kirchoff’s rules for calculating field strength, as described by Seiler et al., a field strength of 254 V/cm for the 2.5 cm separation channel was calculated.[29] Prior to each injection, the charging current of the working electrode was allowed to dissipate, producing a stable baseline. The microdialysis flow rate was 1.0 μL/min. The injection time was set at 1 second. Analysis took between 40 and 60 seconds, depending on the analyte of interest.
2.3.3. Detection
A Pinnacle model 9051 electrically isolated wireless potentiostat (Pinnacle Technology, Lawrence, KS) was employed for detection in a two-electrode format at a 13 Hz sampling rate. Physical contact between the electrode and the potentiostat was accomplished using colloidal silver and copper wire. The 9051 single-channel isolated potentiostat maintains a set voltage bias of up to 4 V between the working and reference electrodes, and wirelessly transmits up to 2 digitized signals directly to a Bluetooth® module connected to a PC at a sample rate of 1 sample/sec. The Bluetooth® module directly imports the data to the PC with support from Serenia software suites.
The electrochemical cell consisted of platinum working (15 μm) and reference electrodes (300 μm) deposited into a 400 nm channel etched into the glass surface. The working electrode was aligned directly at the edge of the separation channel using in-channel alignment, with the electrode being no more than 5 μm inside the separation channel. Using the 9051 electrically isolated potentiostat makes it possible to place the working electrode directly in the separation channel without destroying the potentiostat. For in-channel alignment, the separation potential creates a positive bias shift in reverse polarity separations, and a negative bias shift in positive polarity separations. The bias applied to the electrode depends on its exact alignment in the separation channel, with compensation for the bias shift adjusted according to the mode of separation.[23]
3. Results and Discussion
3.1. Device Fabrication
The aim for the microchip fabrication processes was to develop a simple and reproducible method for integrating a metal electrode into an all-glass chip with a good success rate. Previous reports by Crain et al. describe a fabrication process for an all-glass microfluidic device using multiple acid-based cleaning steps and a final RCA base cleaning step.[30] Our group was able to eliminate the use of these potentially dangerous cleaning steps while maintaining a high success rate. This was achieved in three ways. First, by drilling the access holes prior to channel etching, small particles that remained from the drilling step were dissolved away in the hydrofluoric acid used to make the channels. Secondly, it was found that simply scrubbing the glass with soap and water prior to device assembly was sufficient to remove organic and particulate contamination from the surface. Lastly, by implementing a calcium-assisted bonding step as described by Allen et al.[28], bonding success was guaranteed before the assembled pieces were subjected to the irreversible, high-temperature thermal bonding process.
In the all-glass MCE-EC device described by the Baldwin group, the end-channel configuration, in which the electrode was placed just outside the separation channel in the detection reservoir, was used. To help mitigate some of the effects of band broadening induced by the end-channel alignment, a curved working and reference electrode design was used.[19–21, 30] In this work, in-channel alignment was used to eliminate the effects of band broadening that can be generated due to the end-channel alignment of the electrodes.
Some publications have reported the use of simple replaceable working electrodes for amperometric detection in microchip electrophoresis. This approach uses a fixed electrode holder at the outlet of the separation channel.[31–33] While this can decrease the overall production cost of the chip, it requires a supplementary detection cell along with the use of a three-dimensional micromanipulator, thus increasing the complexity of the analytical system. The use of micromanipulators also reduces the ability to miniaturize the system, while minimizing the potential for making this a truly portable device. Conversely, our chip design implements an integrated reference, thus simplifying fabrication and experimental setup.
3.2. Evaluation of Chip by Direct Infusion
The microfluidic device used in these studies employs a flow-through gated injection scheme. The approach was adapted from Lin et al.,[34] who used it in a direct injection scheme with fluorescence detection; it has been previously described by our group for microdialysis sampling.[7,12,14] In our system, a syringe pump was used to deliver the dialysate through the enlarged flow channel at the top of the device. This flow generates a hydrodynamic pressure inside the microfluidic channels. A gate is established by applying an electric field between the high voltage lead and the respective ground leads at the waste reservoirs (Fig. 1). This prevents the sample from prematurely entering to the separation channel. In order to introduce a discrete sample plug into the separation channel, the high voltage is floated, introducing the pressure-driven perfusate into the separation channel. The gate is then reestablished after a specified amount of time by reapplying the high voltage. Thus, injection time and flow rate define the sample plug size that is introduced into the separation channel.
3.3. Reverse Polarity Separations
The system was first evaluated in reverse polarity for the continuous monitoring of hydrogen peroxide and nitrite with direct infusion of the analyte. Using 10 mM boric acid containing 2 mM TTAB at pH 9.2 as a run buffer, 1 mM standard solutions of both nitrite and hydrogen peroxide were perfused into the chip at a flow rate of 1 μL/min (Fig. 2A). The electrophoretic separation was accomplished in 20 seconds (Fig. 3). Ten sequential injections resulted in an average peak heights of 4.7 nA for nitrite and 4.4 nA for hydrogen peroxide, with RSD values of 7.4% and 10.8%, respectively (n = 10). This separation demonstrated the ability to perform fast sampling and separations on chip, along with the ability of the system to perform these separations over repeated injections with a reasonably low relative standard deviation.
Figure 3.
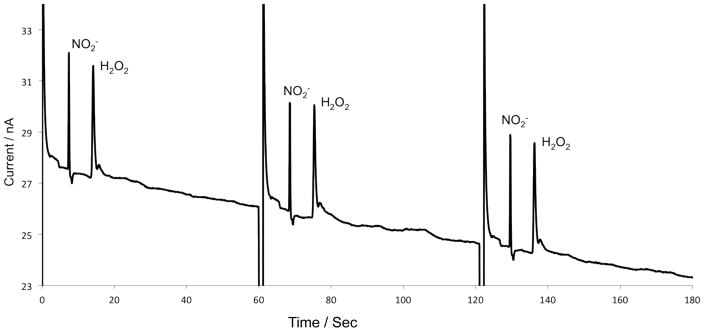
Separation of nitrite and hydrogen peroxide using direct infusion and reversed polarity. Perfusate buffer: 10 mM boric acid and 2 mM TTAB at pH 9.2, 1 mM nitrite and 1mM hydrogen peroxide, at a flow rate of 1 μL/min. Separation buffer: 10 mM boric acid and 2 mM TTAB at pH 9.2. The applied voltage was −1600 V, generating a field strength of 254 V/cm, with an injection time of 1 second. The working electrode was set to a 1.1 V bias to the Pt reference electrode.
In a separate experiment, a 1 mM standard solution of nitrite, ascorbic acid, and hydrogen peroxide in 10 mM boric acid and 2 mM TTAB at pH 9.2 was perfused through the chip at a flow rate of 1 μL/min (Fig. 4). This experiment was run to evaluate the ability of the chip to perform separations of multiple analytes with baseline resolution. The separation of the three analytes was accomplished in 20 seconds with an average peak height of 4.1 nA for nitrite, 8.2 nA for ascorbic acid, and 1.8 nA for H2O2, with RSD values of 7.5%, 6.52% and 4.3%, respectively (n = 10).
Figure 4.
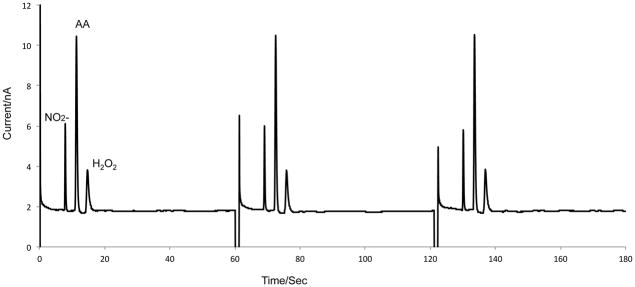
Separation of 1 mM nitrite, 1 mM ascorbic acid, and 1 mM hydrogen peroxide using direct infusion. Syringe pump buffer: 10 mM boric acid and 2 mM TTAB at pH 9.2, 1 mM nitrite, 1 mM ascorbic acid, and 1 mM hydrogen peroxide. All other conditions are identical to figure 3.
3.4. Positive Polarity Separation
The system was then evaluated in positive polarity with a 50 mM boric acid buffer at pH 9.2. A standard solution of 1 mM hydrogen peroxide was used with direct infusion to test the system’s versatility (Fig. 5). For this experiment, the separation time was allotted at 45 seconds, with an average peak height of 3.9 nA and an RSD value of 8.27% (n=10). Positive polarity along with simple boric acid buffer was used for these MD experiments to eliminate the use of a surfactant, which could interfere with the recovery of analyte at the probe and inhibit enzyme activity.
Figure 5.
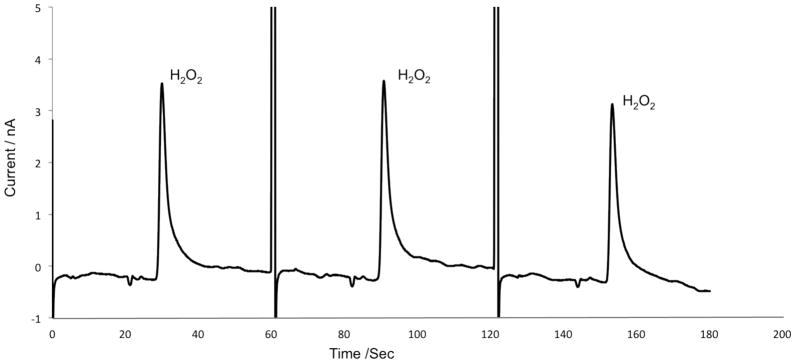
Detection of 1 mM hydrogen peroxide using direct infusion and normal polarity. Syringe pump buffer: 50 mM boric acid at pH 9.2. Separation buffer consisted of 50 mM boric acid at pH 9.2. The applied voltage was +1600 V. All other conditions are identical to figure 3.
3.5. Microdialysis-Microchip Electrophoresis with Electrochemical Detection
The system was evaluated for MD sampling. These experiments were conducted using positive polarity with the experimental setup shown in Figure 2B. A BASi loop probe was specifically chosen for its flexibility, size (1.2mm OD at thickest point), and biocompatibility; it will also be employed for future on-animal experiments using dermal sampling. The total length of tubing from the probe to the chip was 15 cm and the flow rate of the pump was 1 μL/min. Figure 6 shows the response obtained when 100 μL aliquots of 10 mM hydrogen peroxide standard were serially added at five minute intervals to the sample vial that contained the microdialysis probe immersed in 50 mM boric acid buffer. The lag time, defined as the period of time it takes for the analyte of interest to be transferred from the probe to the device for sample injection and subsequent detection, was 5 minutes. The rise time was also measured; this is defined as the period of time which is required for the probe to achieve 90% of the response to the change in concentration.[35] In this case, the rise time was less than the separation time (60 seconds), leading to an overall temporal resolution of one minute for these studies.
Figure 6.
On-line microdialysis sampling with serial additions of hydrogen peroxide standard to the vial containing the microdialysis probe. Microdialysis perfusate: 50 mM boric acid at pH 9.2. The 2 mL vial contained 50 mM boric acid at pH 9.2. 100 μL of 10mM hydrogen peroxide was serially added to the reaction well. Separation and detection conditions were identical to Figure 5. Syringe pump was set at a flow rate of 1 μL/min for microdialysis sampling.
3.6. Monitoring Enzymatic Generation of H2O2 by MD-MCE-ED
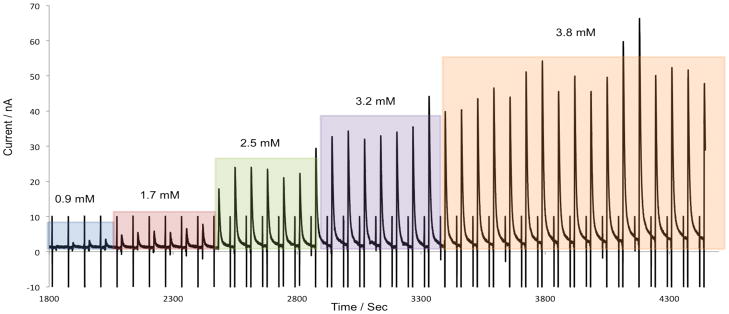
To demonstrate the ability of this system to continuously monitor an enzymatic reaction, the generation of hydrogen peroxide from glucose oxidase was measured. Glucose oxidase readily catalyzes glucose to gluconic acid, with simultaneous production of hydrogen peroxide. The BASi loop microdialysis probe was placed in a vial containing 50 mg of glucose oxidase (360 U/mg) in 1 mL of 50 mM boric acid buffer at pH 9.2. A large excess of enzyme was used due to its low activity at pH 9.2. The probe was perfused with 50 mM boric acid buffer at a flow rate of 1 μL/min. A baseline for the sample prior to the addition of glucose was measured for 30 minutes, resulting in no visible amperometric peak for peroxide (Fig. 7). 100 μL aliquots of 1 mM glucose were then added to the vial of glucose oxidase using passive mixing; a steady increase in hydrogen peroxide was observed. Figure 7 shows the electropherogram obtained for hydrogen peroxide as a function of time following the addition of glucose to the reaction vial.
Figure 7.

Enzymatic reaction-induced concentration change experiment with glucose oxidase to produce hydrogen peroxide. Syringe pump buffer: 50 mM boric acid at pH 9.2. The 2 mL reaction well contained 1 mL of 50 mM boric acid at pH 9.2 and 50 mg of glucose oxidase. 100 μL of 1 mM glucose was added to the reaction well to stimulate the production of hydrogen peroxide. All other conditions are identical to those in Figure 6.
4. Conclusions
In this paper, an on-line microdialysis-microchip electrophoresis system using integrated in-channel electrochemical detection with a platinum electrode is described. The device can be employed in either positive or negative polarity. The lag time, response time, and temporal resolution for the device were determined using hydrogen peroxide as a model analyte. Finally, the device was evaluated for continuous monitoring of hydrogen peroxide generated by glucose oxidase in the presence of glucose. The ultimate goal is to use this chip in conjunction with a portable analysis system for the continuous monitoring of drugs and neurotransmitters in awake, freely roaming animals.
Acknowledgments
The authors thankfully acknowledge financial support from NIH grants NINDS NS42929 and through an SBIR with Pinnacle Technologies (NINDS 64644). We want to thank Nancy Harmony for her editorial assistance in preparation of the manuscript. Lastly we would like to acknowledge technical assistance and helpful discussions with Dr. Matt Hulvey, Dr. David Johnson, Dr. Erik Naylor, Seth Gabbert, Hans Harmon, Rachel Saylor and Dulan Gunasekara.
References
- 1.Hogan BL, Lunte SM, Stobaugh JF, Lunte CE. Anal Chem. 1994;66:596–602. doi: 10.1021/ac00077a004. [DOI] [PubMed] [Google Scholar]
- 2.Lada MW, Vickeroy TW, Kennedy Anal Chem. 1997;69:4560–4565. doi: 10.1021/ac970518u. [DOI] [PubMed] [Google Scholar]
- 3.Schultz KN, Kennedy RT. Annu Rev Anal Chem. 2008;1:627–661. doi: 10.1146/annurev.anchem.1.031207.113047. [DOI] [PubMed] [Google Scholar]
- 4.Nandi P, Lunte SM. Anal Chim Acta. 2009;651:1–14. doi: 10.1016/j.aca.2009.07.064. [DOI] [PMC free article] [PubMed] [Google Scholar]
- 5.Guihen E, O’Connor WT. Electrophoresis. 2010;31:55–64. doi: 10.1002/elps.200900467. [DOI] [PubMed] [Google Scholar]
- 6.Nandi P, Kuhnline CD, Lunte SM. Analytical Considerations of Microdialysis Sampling. In: Tsai T-H, editor. Applications of Microdialysis in Pharmaceutical Science; John Wiley & Sons, Inc; Hoboken, NJ, USA: 2011. [Google Scholar]
- 7.Huynh BH, Fogarty BA, Martin RS, Lunte SM. Anal Chem. 2004;76:6440–6447. doi: 10.1021/ac049365i. [DOI] [PubMed] [Google Scholar]
- 8.Sandlin ZD, Shou M, Shackman JG, Kennedy RT. Anal Chem. 2005;77:7702–7708. doi: 10.1021/ac051044z. [DOI] [PubMed] [Google Scholar]
- 9.Wang M, Roman GT, Schultz K, Jennings C, Kennedy RT. Anal Chem. 2008;80:5607–5615. doi: 10.1021/ac800622s. [DOI] [PMC free article] [PubMed] [Google Scholar]
- 10.Nandi P, Desai DP, Lunte SM. Electrophoresis. 2010;31:1414–1422. doi: 10.1002/elps.200900612. [DOI] [PubMed] [Google Scholar]
- 11.Mecker LC, Martin RS. Journal of the Association for Laboratory Automation. 2007;12:296–302. [Google Scholar]
- 12.Huynh BH, Fogarty BA, Nandi P, Lunte SM. Journal of pharmaceutical and Biomedical Analysis. 2006;42:529–534. doi: 10.1016/j.jpba.2006.05.014. [DOI] [PubMed] [Google Scholar]
- 13.Wang M, Roman GT, Perry ML, Kennedy RT. Anal Chem. 2009;81:9072–9078. doi: 10.1021/ac901731v. [DOI] [PMC free article] [PubMed] [Google Scholar]
- 14.Nandi P, Scott DE, Desai D, Lunte SM. Electrophoresis. 2013;34:895–902. doi: 10.1002/elps.201200454. [DOI] [PMC free article] [PubMed] [Google Scholar]
- 15.Mecker LC, Martin RS. Anal Chem. 2008;80:9257–9264. doi: 10.1021/ac801614r. [DOI] [PMC free article] [PubMed] [Google Scholar]
- 16.Lunte SM, Scott DE, Grigsby R, Gunesekara D, Saylor R, Regel A, Naylor E, Gabbert S, Johnson D, Janle E. Monitoring Molecules in Neuroscience. 2012:1–3. [Google Scholar]
- 17.Coltro WKT, Lunte SM, Carrilho E. Electrophoresis. 2008;29:4928–4937. doi: 10.1002/elps.200700897. [DOI] [PMC free article] [PubMed] [Google Scholar]
- 18.Baldwin RP, Roussel TJ, Crain MM, Bathlagunda V, Jackson DJ, Gullapalli J, Conklin JA, Pai R, Naber JF, Walsh KM, Keynton RS. Anal Chem. 2002;74:3690–3697. doi: 10.1021/ac011188n. [DOI] [PubMed] [Google Scholar]
- 19.Keynton RS, Roussel TJ, Jr, Crain MM, Jackson DJ, Franco DB, Naber JF, Walsh KM, Baldwin RP. Anal Chim Acta. 2004;507:95–105. [Google Scholar]
- 20.Jackson DJ, Naber JF, Roussel TJ, Crain MM, Walsh KM, Keynton RS, Baldwin RP. Anal Chem. 2003;75:3643–3649. doi: 10.1021/ac0206622. [DOI] [PubMed] [Google Scholar]
- 21.Pai RS, Walsh KM, Crain MM, Roussel TJ, Jackson DJ, Baldwin RP, Keynton RS, Naber JF. Anal Chem. 2009;81:4762–4769. doi: 10.1021/ac9002529. [DOI] [PubMed] [Google Scholar]
- 22.Berthold A, Laugere F, Schellevis H, de Boer CR, Laros M, Guijt RM, Sarro PM, Vellekoop MJ. Electrophoresis. 2002;23:3511–3519. doi: 10.1002/1522-2683(200210)23:20<3511::AID-ELPS3511>3.0.CO;2-C. [DOI] [PubMed] [Google Scholar]
- 23.Gunasekara DB, Hulvey MK, Lunte SM. Electrophoresis. 2011;32:832–837. doi: 10.1002/elps.201000681. [DOI] [PMC free article] [PubMed] [Google Scholar]
- 24.Fan ZH, Harrison DJ. Anal Chem. 1994;66:177–184. [Google Scholar]
- 25.Benjamin P, Weaver C. Proc Roy Soc Lond Math Phys Sci. 1961;261:516–531. [Google Scholar]
- 26.Mattox DM. Thin Solid Films. 1978;53:81–96. [Google Scholar]
- 27.Holloway DG. The Physical Properties of Glass (Wykeham Science Series, No 24) Wykeham Publications, The University of Michigan; 1973. pp. 26–49. [Google Scholar]
- 28.Allen PB, Chiu DT. Anal Chem. 2008;80:7153–7157. doi: 10.1021/ac801059h. [DOI] [PMC free article] [PubMed] [Google Scholar]
- 29.Seiler K, Fan ZH, Fluri K, Harrison DJ. Anal Chem. 1994;66:3485–3491. [Google Scholar]
- 30.Crain MM, Keynton RS, Walsh KM, Roussel TJ, Baldwin RP, Naber JF, Jackson DJ. Methods Mol Biol. 2006;339:13–26. doi: 10.1385/1-59745-076-6:13. [DOI] [PubMed] [Google Scholar]
- 31.Zeng Y, Chen H, Pang DW, Wang ZL, Cheng JK. Anal Chem. 2002;74:2441–2445. doi: 10.1021/ac0110247. [DOI] [PubMed] [Google Scholar]
- 32.Wang J, Tian B, Sahlin E. Anal Chem. 1999;71:5436–5440. doi: 10.1021/ac990807d. [DOI] [PubMed] [Google Scholar]
- 33.Chen G, Bao H, Yang P. Electrophoresis. 2005;26:4632–4640. doi: 10.1002/elps.200500503. [DOI] [PubMed] [Google Scholar]
- 34.Lin YH, Lee GB, Li CW, Huang GR, Chen SH. Journal of Chromatography A. 2001;937:115–125. doi: 10.1016/s0021-9673(01)01326-7. [DOI] [PubMed] [Google Scholar]
- 35.Skoog DA, Holler FJ, Crouch SR. Principles of Instrumental Analysis. 6. Thomson – Brooks/Cole; 2007. p. 65. [Google Scholar]