Abstract
Myocardial metabolic and perfusion imaging is a vital tool for understanding the physiologic consequences of heart failure. We used PET imaging to examine the longitudinal kinetics of 18F-FDG and 14(R,S)-18F-fluoro-6-thia-heptadecanoic acid (18F-FTHA) as analogs of glucose and fatty acid (FA) to quantify metabolic substrate shifts with the spontaneously hypertensive rat (SHR) as a model of left ventricular hypertrophy (LVH) and failure. Myocardial perfusion and left ventricular function were also investigated using a newly developed radiotracer 18F-fluorodihydrorotenol (18F-FDHROL).
Methods
Longitudinal dynamic electrocardiogram-gated small-animal PET/CT studies were performed with 8 SHR and 8 normotensive Wistar-Kyoto (WKY) rats over their life cycle. We determined the myocardial influx rate constant for 18F-FDG and 18F-FTHA (KiFDG and KiFTHA, respectively) and the wash-in rate constant for 18F-FDHROL (K1FDHROL). 18F-FDHROL data were also used to quantify left ventricular ejection fraction (LVEF) and end-diastolic volume (EDV). Blood samples were drawn to independently measure plasma concentrations of glucose, insulin, and free fatty acids (FFAs).
Results
KiFDG and KiFTHA were higher in SHRs than WKY rats (P < 3 × 10⁻⁸ and 0.005, respectively) independent of age. A decrease in KiFDG with age was evident when models were combined (P = 0.034). The SHR exhibited higher K1FDHROL (P < 5 × 10⁻⁶) than the control, with no age-dependent trends in either model (P = 0.058). Glucose plasma concentrations were lower in SHRs than controls (P < 6 × 10⁻¹²), with an age-dependent rise for WKY rats (P < 2 × 10⁻⁵). Insulin plasma concentrations were higher in SHRs than controls (P < 3 × 10⁻³), with an age-dependent decrease when models were combined (P = 0.046). FFA levels were similar between models (P = 0.374), but an increase with age was evident only in SHR (P < 7 × 10⁻⁶).
Conclusion
The SHR exhibited alterations in myocardial substrate use at 8 mo characterized by increased glucose and FA utilizations. At 20 mo, the SHR had LVH characterized by decreased LVEF and increased EDV, while simultaneously sustaining higher glucose and similar FA utilizations (compared with WKY rats), which indicates maladaptation of energy substrates in the failing heart. Elevated K1FDHROL in the SHR may reflect elevated oxygen consumption and decreased capillary density in the hypertrophied heart. From our findings, metabolic changes appear to precede mechanical changes of LVH progression in the SHR model.
Keywords: spontaneously hypertensive rat, myocardial substrate metabolism, myocardial perfusion, 18F-fluorodihydrorotenol, 18F-fluoro-6-thia-heptadecanoic acid
Heart failure (HF) occurs when the heart no longer has the ability to provide sufficient blood flow to meet the metabolic needs of the body. Left ventricular hypertrophy (LVH), associated with the enlargement and thickening of the left ventricular (LV) muscle, is one cardiac dysfunction that can result in HF. Under healthy conditions, β-oxidation of free fatty acids (FFAs) provides 60%–80% of adenosine triphosphate in the heart (1,2). However, in the case of cardiac hypertrophy the heart exhibits an impaired substrate metabolism, which contributes to contractile dysfunction and continuous LV remodeling distinctive of HF (3). The metabolic remodeling of the heart precedes, activates, and sustains functional and structural remodeling (4).
Various in vivo noninvasive techniques are used to evaluate metabolic phenotype changes that occur in response to cardiac stress such as cardiac hypertrophy and HF (5–8). Specifically, molecular imaging with 14(R,S)-18F-fluoro-6-thia-heptadecanoic acid (18F-FTHA) and 18F-FDG PET is used to estimate fatty acid (FA) and glucose kinetics of the myocardial muscle (5,9,10). 18F-FTHA was synthesized by Degrado et al. (10) in 1991 and was demonstrated to transport into the myocardium, undergo initial steps of β-oxidation, and subsequently be trapped in the cell. Only a small fraction of 18F-FTHA has been identified to incorporate into triglycerides, thus the rate of 18F-FTHA retention by the myocardium is believed to reflect β-oxidation of the long-chain FA (10). Furthermore, 2-dimensional echocardiographic examinations and myocardial gating techniques are used to quantify LV function (11–15). These techniques help determine the development of LVH, evidenced by a decreased left ventricular ejection fraction (LVEF) and increased end diastolic volume (EDV). In addition, increased oxygen demands generated by the hypertrophied left ventricle increase myocardial oxygen consumption in the failing heart (12,16,17).
In summary, in vivo noninvasive molecular imaging has become a powerful tool to monitor myocardial metabolism phenotype, blood flow, and overall cardiac function. Thus, it is timely to develop technology to longitudinally evaluate the progression of HF in small animals, which can be translated to the clinic for the early stage identification and management of patients with cardiac hypertrophy.
The purpose of this study was to noninvasively examine the longitudinal alterations in myocardial metabolic phenotypes, blood flow, and function in the spontaneously hypertensive rat (SHR) and compare these alterations with Wistar-Kyoto (WKY) controls. The SHR was chosen as a model of hypertrophy and heart failure not as a model of hypertension or primarily pressure-induced hypertrophy. It is reported that the SHR model has a genetic deletion variant in the CD36 FA transporter (18), which results in defective FA metabolism, insulin resistance, and hypertension. Ultimately this genetic defect in the SHR results in spontaneous progression of myocardial hypertrophy with age without the requirement of a surgical procedure. The SHR has been well documented (13,19) as a model of the transition from hypertrophy to HF; however, to the best of our knowledge previously reported studies by others do not use longitudinal molecular imaging techniques.
Our group used small-animal PET/CT to assess myocardial metabolic phenotypes with 18F-FTHA and 18F-FDG in the SHR and WKY rat models. In addition, we measured the wash-in rate constant (K1FDHROL) and overall heart function using a newly developed perfusion imaging agent 18F-fluorodihydrorotenol (18F-FDHROL), an analog of the mitochondrial binding rotenone. We hypothesized that the hypertrophied myocardium of the SHR would exhibit an increased 18F-FDG influx rate constant (KiFDG) and suppressed 18F-FTHA influx rate constant (KiFTHA) relative to control, with an age-dependent decrease in the influx rate constant (Ki) of both tracers in the normal and failing heart. Lastly, we hypothesized that the SHR would show an initially elevated and subsequent age-dependent decrease in wash-in rate constant of 18F-FDHROL relative to control.
MATERIALS AND METHODS
Synthesis of 18F-FDG, 18F-FTHA, and 18F-FDHROL
18F-FDG was routinely synthesized in the University of California San Francisco (UCSF) radiochemistry laboratory using the TRACERlab MX synthesis module (GE Healthcare). 18F-FTHA and 18F-FDHROL were both synthesized at UCSF according to previously published methods (20) using an FxFN synthesis module (GE Healthcare).
Animal Study Design
All imaging studies were performed in accordance with Institutional Animal Care and Use Committee–approved protocols from both UCSF and Lawrence Berkeley National Laboratory. Eight male SHRs and 8 male WKY normotensive rats were purchased from Charles River Laboratories. Imaging began at approximately 8 mo of age, and the rats were imaged throughout their life cycle at separate times corresponding to 8–9, 13–14, 19–20, and 22–23 mo of age. All rats were freely fed standard Purina rat chow and water. The rats were nocturnal and mostly ate at night. During each time point, every living rat was imaged using all 3 radiotracers (18F-FDG, 18F-FTHA, and 18F-FDHROL) on separate days and thus separate anesthetic periods. Before 18F-FDG and 18F-FTHA imaging, food was taken away the evening before the studies. In comparison, the rats were not fasted for the 18F-FDHROL studies. Approximately 1 mL of blood was drawn from the tail vein of each rat once for each time point immediately after either the 18F-FDG or the 18F-FTHA study.
Imaging Protocol
All in vivo imaging was performed using a small-animal PET/CT scanner (Inveon dedicated PET docked with CT in the multimodality platform; Siemens Medical Solutions). Each rat was anesthetized with gas isoflurane at approximately 2% concentration and medical-grade oxygen. Electrocardiogram electrodes were attached to the 2 front limbs and left hind limb to acquire triggering signals used to subdivide datasets into 8 cardiac phases. Rats were positioned on the scanning bed with the heart centered in the field of view. Each radiotracer was administered via tail vein injection as a 0.5- to 1.5-mL bolus with activities of 54.8 ± 7.40, 50.7 ± 8.14, and 49.2 ± 8.88 MBq for 18F-FDG, 18F-FTHA, and 18F-FDHROL, respectively. Image acquisition began at the time of injection. The small-animal PET/CT system was used to acquire dynamic electrocardiogram-gated list mode PET data over 60 min. After the PET acquisition, a separate CT scan was acquired with 120 projections of continuous rotation to cover 220° with an x-ray tube operated at 80 kVp, 0.5 mA, and 160-ms exposure time.
Image Analysis
All PET data were reconstructed into 38 time frames (12 × 5, 6 × 10, 4 × 30, 6 × 60, and 10 × 300 s) using a gated sequence of 8 bins measured by a BioVet system (m2m Imaging Corp.) and output to the Inveon system hardware. The 2-dimensional ordered-subsets expectation maximization algorithm with Fourier rebinning provided by the manufacturer was used for PET reconstruction of 304 frames (i.e., 38 time frames each with 8 electrocardiogram bins) on a single node workstation. Reconstruction took roughly 7 h, resulting in 128 × 128 × 159 matrices with a corresponding voxel size of 0.776 × 0.776 × 0.796 mm. The CT images were reconstructed using a cone beam Feldkamp reconstruction algorithm supplied by Exxim Computing Corp. The matrix size of the reconstructed CT images was 512 × 512 × 662 with a voxel size of 0.190 × 0.190 × 0.190 mm. Photon attenuation correction was achieved for PET reconstruction using the coregistered CT-based attenuation map. No scatter correction was applied in this study.
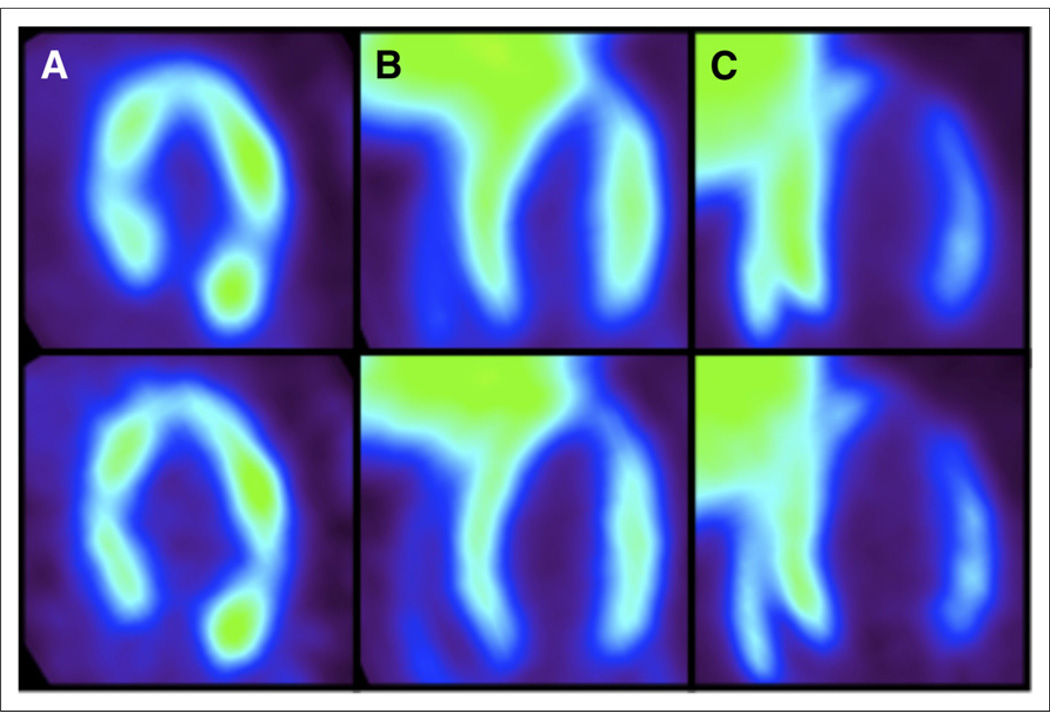
The fine binning in the electrocardiogram gating sequence was used to select the bins corresponding to the end diastolic phase of the cardiac cycle, thus minimizing cardiac motion, partial-volume effects, and spillover contamination. Once these gates were identified, a new dynamic series was formed by summing the counts in each identified diastolic bin. PET images with all 8 bins summed and just the diastolic bins summed are shown in Figure 1 (top and bottom, respectively). The images demonstrate the improvement in LV and myocardium boundary definition by implementation of gating techniques.
FIGURE 1.
(Top) PET images corresponding to all electrocardiogram bins summed. (Bottom) PET images corresponding to only diastolic electrocardiogram bins summed. (A) 18F-FDG images of SHR show almost no liver uptake. (B) 18F-FDHROL images of SHR show substantial liver uptake. (C) 18F-FTHA images of SHR again show substantial liver uptake.
The new dynamic series of diastolic bins were then uploaded into the Inveon Research Workplace (version 3.0; Siemens Molecular Solutions) for tracer kinetic analysis. Myocardial time–activity curves were generated by manually drawing a volume of interest (VOI) throughout the myocardium, with care taken to avoid the myocardial border. Compared with the 18F-FDG images, 18F-FTHA and 18F-FDHROL images displayed substantial liver uptake in both rat models (Fig. 1). To minimize spillover of radioactivity from the liver to the heart, the entire apex and mid-cavity septal wall were not included within the VOI for any 18F-FTHA or 18F-FDHROL images. Tissue VOIs were selected by placing voxels in 10 consecutive mid-ventricle slices. Only slices containing myocardium in 360° were selected. To generate blood time–activity curves for each tracer, small regions of interest (10–20 mm3) were placed within the LV blood pool with care taken to avoid the boundary of myocardium and LV cavity. Overall, the diastolic PET images allowed for clear definition of myocardium and blood-pool regions well within anatomic boundaries, alleviating the need for partial-volume correction over continuous slices.
Glucose, Insulin, and FFA Analyses
Blood samples obtained after either 18F-FTHA or 18F-FDG scans were spun in an Eppendorf 5415D microcentrifuge for 10 min at 10,000 rpm. The plasma was separated, immediately stored at −80°C, and then sent to Ani Lytics Inc. to measure the circulating plasma substrates. Glucose, insulin, and FFA concentrations were measured using a Roche Hitachi 717 Chemistry Analyzer. The calibration levels were 0–500 mg/dL, 0–4 ng/mL, and 0–1200 µmol/L for glucose, insulin, and FFA measurements, respectively. All measurements had an SD of 5% or less.
Determination of 18F-FTHA and 18F-FDG Influx
Rate Constant
The myocardial influx rate constants from the PET dynamic data were estimated using the multiple-time Patlak graphical analysis approach (5,21). The last 10 time frames (10–60 min) were used to determine KiFTHA and KiFDG via linear regression. Although the myocardial metabolic uptake rate can be calculated using Ki, plasma concentration, and the lumped constant, the lumped constant is not truly constant and varies with respect to preferential uptake of the tracer (22). Thus, for the scope of this study we quantified myocardial 18F-FTHA and 18F-FDG uptake (mainly, KiFTHA and KiFDG) and not myocardial glucose and FA metabolism.
Determination of Wash-in Rate Constant Using 18F-FDHROL
The myocardial wash-in rate constant of 18F-FDHROL was estimated using a single-tissue-compartment model, based on Kety’s theory for an inert freely diffusible tracer that originates from Fick’s law of diffusion (23). This model measures the exchange of radiotracer between the whole-blood compartment and a single-tissue compartment by 2 rate constants, K1 and k2. K1 is defined as the wash-in rate constant out of the LV blood into the extravascular and cellular spaces of the myocardium, and k2 is defined as the wash-out rate constant out of myocardium into the LV blood. A custom closed-form algorithm was used to fit the 18F-FDHROL time–activity curves to this single-tissue-compartment model, as described in the study by Zeng et al. (24). This algorithm alleviates the issues with convergence due to local minima when compared with classic nonlinear least-squares estimation.
Evaluation of Cardiac Function
The electrocardiogram-gated 18F-FDHROL images were used to evaluate the LVEF and EDV. These two parameters were measured using the clinical cardiac software Myovation designed for the Xeleris Workstation (GE Healthcare). The images were first scaled to the dimensions of a human heart for compatibility with the clinical software. The resulting images were reoriented into short-axis, horizontal long-axis, and vertical long-axis views for subsequent automatic segmentation using the Myovation segmentation algorithm. Visual assessment was used to ensure that the segmentation was accurate, and adjustments were made when necessary.
Statistical Analysis
All blood sampling and imaging results are presented as mean ± SD. Two-Way ANOVA was used to determine the main effect of contributions from each independent variable (i.e., rat model or time) and was also used to identify possible interaction effects between variables. For example, the main effect of the rat model was the difference between the means of the dependent variable (e.g., myocardial influx constant) for the two rat models when time was ignored. Furthermore, a significant interaction effect between rat model and age existed if there were age-dependent differences in the change of the dependent variable (e.g., wash-in rate constant) for each individual rat model. In addition, Welch’s unpaired t test was used to compare the mean of the two rat models with unequal variances at a given time point, in addition to the postmortem heart–to–body weight ratio. The use of Welch’s unpaired t test is indicated explicitly in this paper. P values of less than 0.05 were considered statistically significant for all tests.
RESULTS
Animal Characteristics
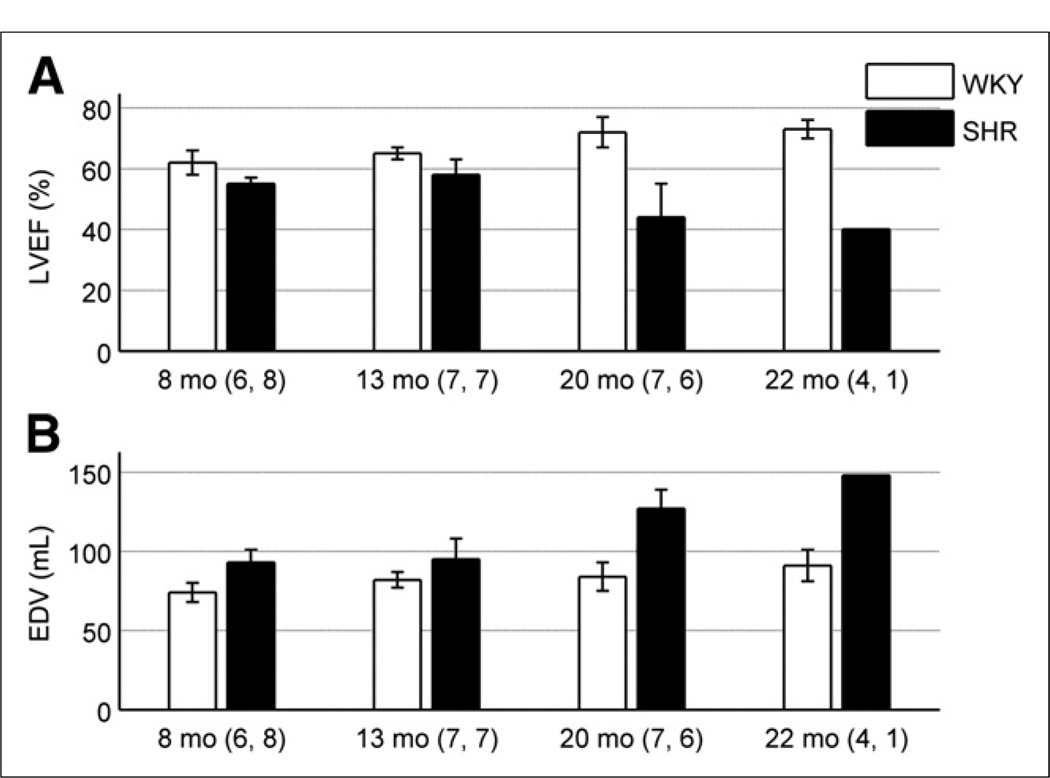
All 8 spontaneously hypertensive rats developed hypertrophy and the eventual onset of HF with a life span of 20 ± 3 mo. Ejection abnormalities associated with the development of hypertrophy were verified by an elevated EDV and subsequent drop of LVEF in the SHRs, compared with the controls, as shown in Figure 2. In particular, the SHR demonstrated a significant age-dependent increase in EDV (P < 9 × 10⁻⁵) whereas the control stayed constant with age. Furthermore, a significant interaction in LVEF between model and age was manifested as an age-dependent decrease in the SHR and an age-dependent increase in the control (P < 2 × 10⁻⁶). Lastly, autopsy reports revealed that the heart–to–body weight ratio was 0.0037 ± 0.0003 for the controls and 0.0068 ± 0.0012 for the SHRs (P < 0.0001), indicative of a hypertrophied heart in the SHR model.
FIGURE 2.
(A) LVEF is shown as function of rat age for both models. SHR demonstrated significantly lower LVEF than control when age was ignored (P < 4 × 10⁻¹²). In addition, significant interaction with model and age was evident as age-dependent decrease in LVEF for SHR and age-dependent increase in WKY rats (P < 2 × 10⁻⁶). (B) EDV is shown as function of rat age for both models. EDV was higher in SHR than control, independent of age (P < 3 × 10⁻¹⁰). In addition, EDV increased with age when all rats were combined (P < 2 × 10⁻⁷). More specifically, significant age-dependent increase in EDV in SHR model was evident, compared with constant value obtained for control (P < 9 × 10⁻⁵). Numbers adjacent to age labels correspond to number of samples measured for WKY rats and SHRs, respectively, at given age.
Measurements of Glucose, Insulin, and FFA Levels in Plasma
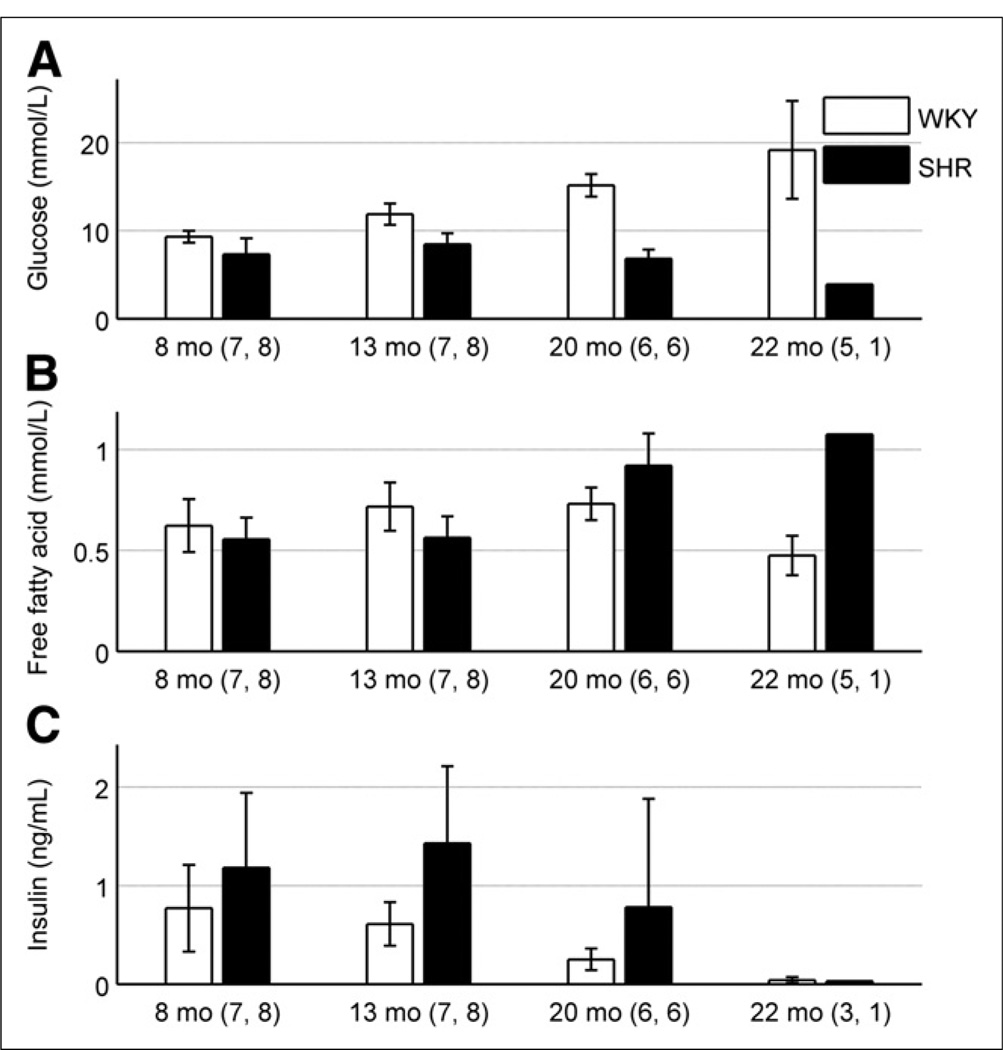
Figure 3 is a plot of the mean circulating glucose, insulin, and FFA plasma concentrations over the lifetime of the rats. The SHR showed lower glucose levels relative to the control (P < 6 × 10⁻¹²). Moreover, a significant age-dependent increase in glucose plasma concentration was apparent in the control (P < 2 × 10⁻⁵) but not in the SHR. In comparison, the insulin levels in the SHR were higher than in the control (P < 3 × 10⁻³), with an age-dependent decrease seen when both models were pooled together (P = 0.046). Although no significant difference was seen in FFA plasma concentrations between the two models (P = 0.374), a significant interaction between rat model and time was manifested as an age-dependent increase for the SHR (P < 7 × 10⁻⁶).
FIGURE 3.
(A) Glucose plasma concentration is shown as function of rat age in both models. SHR displayed lower glucose levels than control, independent of age (P < 6 × 10⁻¹²). Glucose levels in SHR demonstrated moderate age-dependent decrease whereas glucose levels in WKY rats increased with age (P < 2 × 10⁻⁵). (B) FFA plasma concentrations are shown. There was no significant difference between rat models independent of age (P = 0.374). SHR model indicated age-dependent increase in FFA levels, compared with fairly constant values for WKY rats with respect to age (P < 7 × 10⁻⁶). (C) Insulin-circulating plasma concentrations are shown as function of age. SHR showed higher insulin levels (P < 3 × 10⁻³), compared with control, and an age-dependent decrease was seen when both models were pooled together (P = 0.046). Numbers adjacent to age labels correspond to number of samples measured for WKY rats and SHRs, respectively, at given age.
18F-FTHA Kinetics in Myocardial Tissue
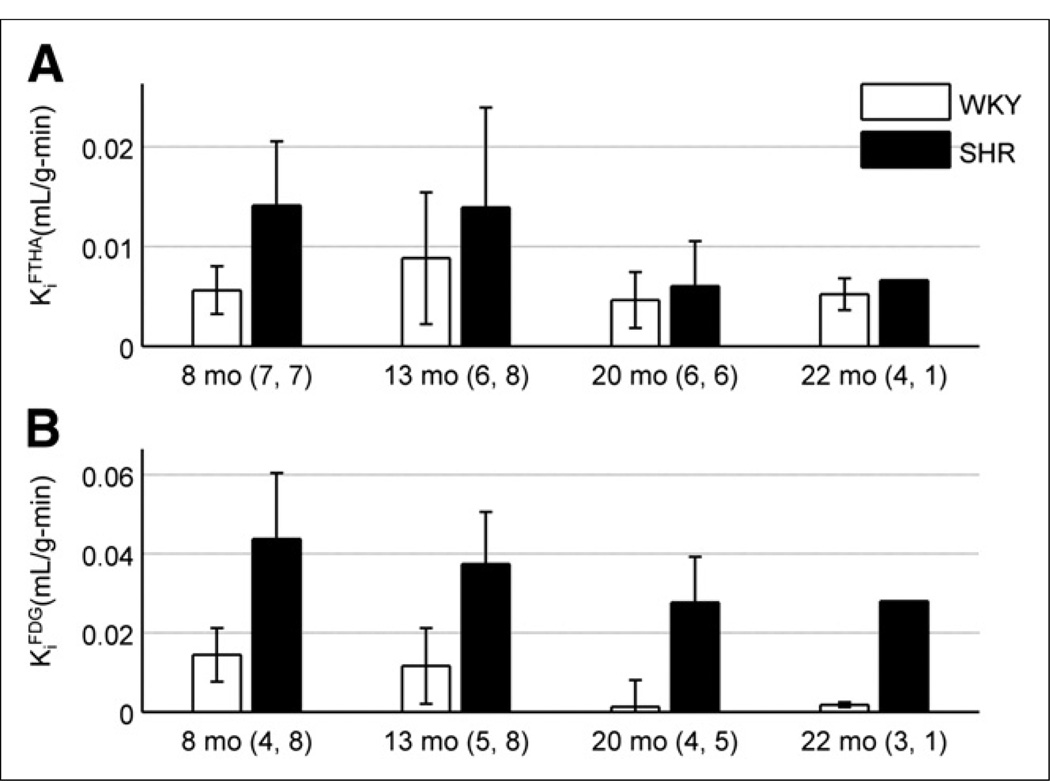
Roughly 2 min after bolus injection of 18F-FTHA, uptake in the heart was sufficient to provide clear distinction of myocardial borders. As mentioned in the image analysis section, substantial liver uptake was visible within both rat models as shown in Figure 1C. The time–activity curve generated from each myocardial VOI displayed increased activity followed by a plateau after roughly 4 min. There was no visible decline in myocardial activity throughout the remainder of the scan, implying significant trapping of 18F-FTHA in the tissue. The whole-blood time–activity curve showed an early sharp spike in radioactivity and a subsequent plateau, indicative of the injection followed by rapid wash-out from the blood. KiFTHA was determined using this image-derived input function from whole blood and the corresponding myocardial time–activity curve. For all rat models, the graphical analysis plots were linear, indicating radiotracer trapping in the myocardium. Figure 4A shows the mean KiFTHA for each model at 4 separate time points. Contrary to our hypothesis, the SHR demonstrated significantly higher KiFTHA than the control when age was ignored (P = 0.005). This elevated KiFTHA in the SHR was, however, primarily evident at 8 mo of age, and no significant difference was seen after 1 y. Furthermore, no effect was seen with respect to age (P = 0.087) or the interaction of rat model and age (P = 0.515).
FIGURE 4.
(A) 18F-FTHA influx rate constant is shown as function of rat age for both models. SHR displayed higher KiFTHA than control (P = 0.005), but no statistically significant trend was seen with time (P = 0.087). (B) 18F-FDG influx rate constant is shown as function of rat age for both models. SHR demonstrated higher KiFDG than control when age was ignored (P < 3 × 10⁻⁸), and decrease was seen when all rat models were combined (P = 0.034). Numbers adjacent to age labels correspond to number of samples measured for WKY rats and SHRs, respectively, at given age.
18F-FDG Kinetics in Myocardial Tissue
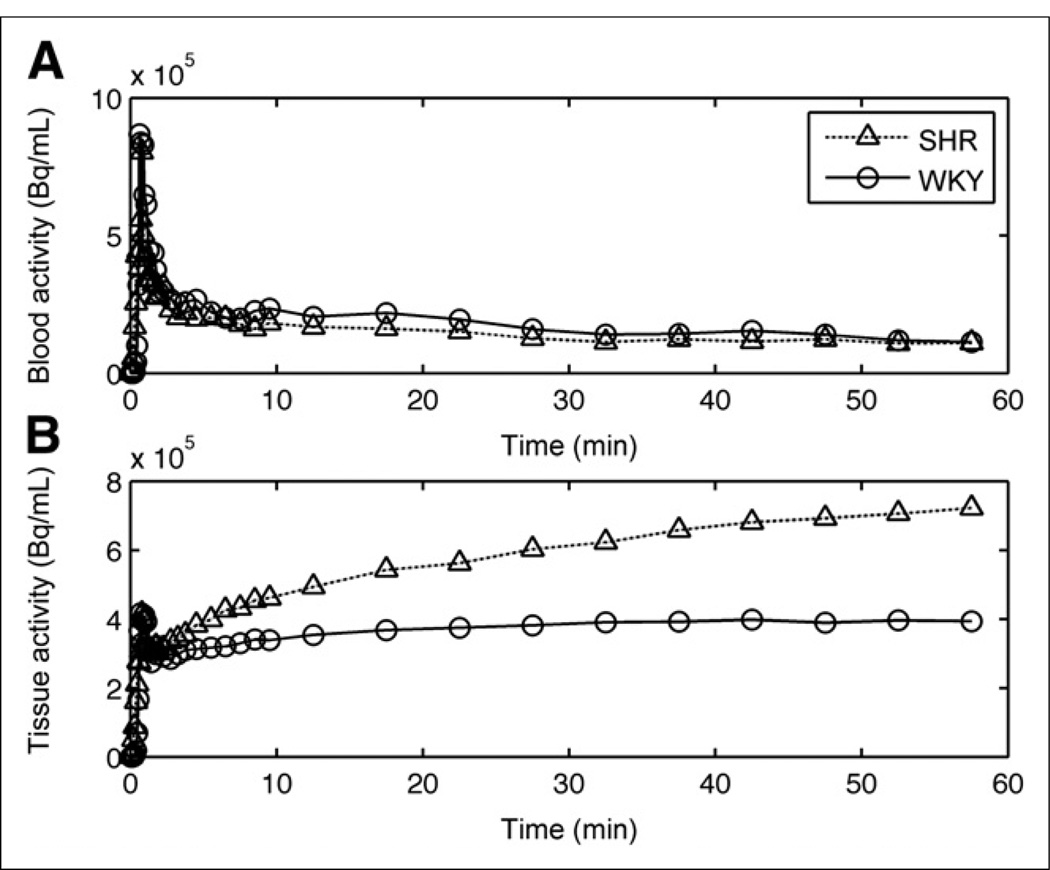
As expected, the fasted WKY rats showed little myocardial 18F-FDG uptake. In comparison, the fasted SHR showed significant uptake of 18F-FDG, providing excellent image quality and relatively no liver contamination, as seen in Figure 1A. Figure 5 compares the time–activity curves for 18F-FDG uptake generated from both rat models. Myocardial time–activity curves showed substantial uptake in the SHR relative to the WKY rats. The early peak seen in the myocardial time–activity curves for both models was due to spillover from the LV blood pool to tissue within the first 2 min of acquisition. Patlak graphical analysis plots were linear, indicating the trapping of radiotracer in the heart muscle. KiFDG in the SHR was higher than the control (P < 3 × 10⁻⁸) when all time points were combined (Fig. 4B). In addition, KiFDG decreased significantly with age when both models were pooled together (P = 0.034). These results support our hypothesis that the hypertrophied myocardium of the SHR will show an elevated KiFDG, compared with control, and an age-dependent decrease in both models.
FIGURE 5.
Comparison of 18F-FDG time–activity curves for (A) LV blood pool and (B) myocardial tissue in SHR and control model at approximately 8 mo of age.
18F-FDHROL Perfusion Evaluation
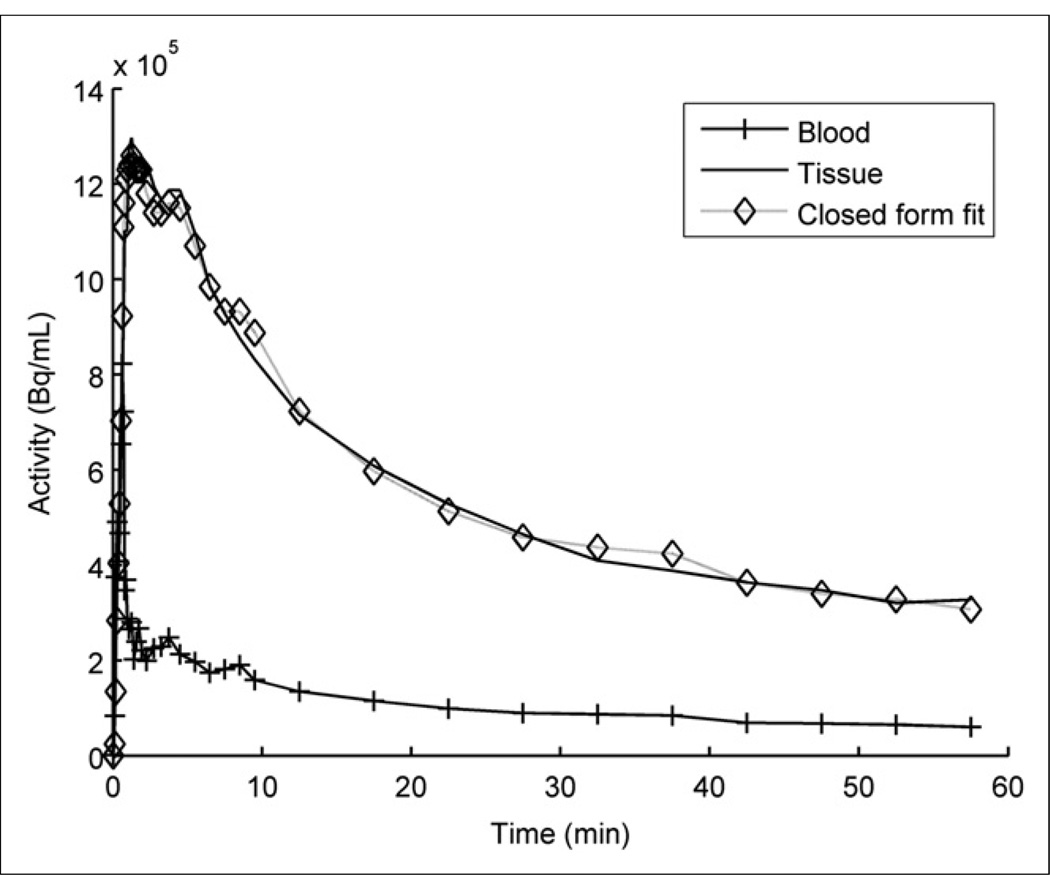
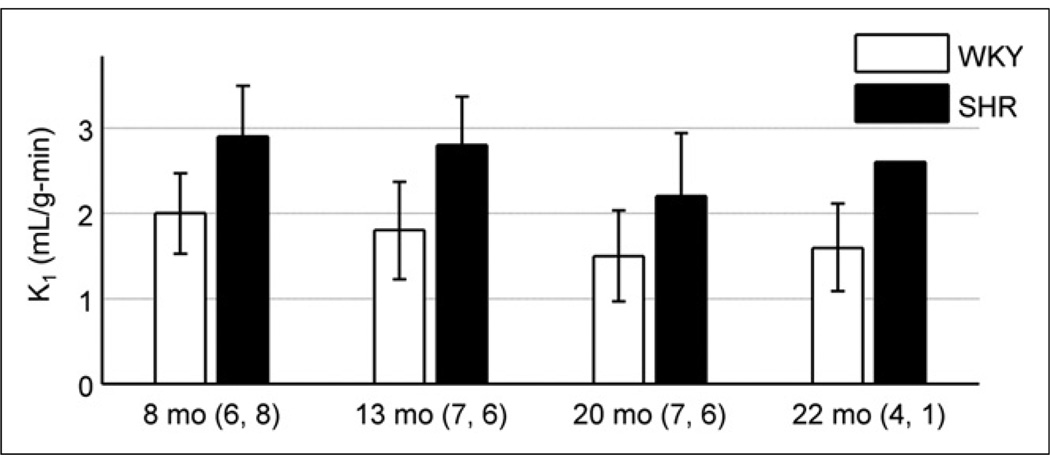
18F-FDHROL provided outstanding flow versus extraction characteristics, which allowed for clear separation of the LV blood pool and myocardium approximately 2 min after bolus injection. Figure 6 is an example of the myocardial and whole-blood time–activity curves seen in a 14-mo-old SHR. The plot depicts rapid uptake of the tracer in the myocardium and rapid extraction from the LV blood. Figure 6 also shows the curve fit based on our custom closed-form algorithm (24). Using this algorithm, we measured the wash-in rate constant (K1FDHROL) to be higher in the SHR than the control (P < 5 × 10⁻⁶), as shown in Figure 7, supporting our hypothesis. Contrary to our hypothesis, no significant effect was seen with age (P = 0.058) or the interaction of rat model and age (P = 0.898).
FIGURE 6.
Example of closed-form fitting algorithm implemented on time–activity curves from 14-mo-old SHR imaged using 18F-FDHROL.
FIGURE 7.
18F-FDHROL wash-in rate constant (K1FDHROL) is shown as function of age. SHR displayed higher K1FDHROL than control when age was ignored (P < 5 × 10⁻⁶), but no trend was seen with time (P = 0.058). Numbers adjacent to age labels correspond to number of samples measured for WKY rats and SHRs, respectively, at given age.
DISCUSSION
The goal of this study was to longitudinally monitor substrate shifts in myocardial FA and glucose metabolism as well as perfusion with in vivo imaging during the progression of HF in a rat model of LVH. Our results showed that in early stages of HF at 8 mo of age, both KiFDG and KiFTHA for the SHR model were greater than the control (P < 2 × 10⁻³ and P < 1 × 10⁻³, respectively, using Welch’s unpaired t test). After roughly 1 y of age, the SHR’s failing heart began to use glucose as a metabolic fuel, with no significant difference in KiFTHA between the two models. These radiotracer Ki differences are related to differences in circulating plasma substrates. At early time points, there was no clear difference between rat models, but elevated plasma FFA concentrations and lower glucose levels relative to controls were evident in the SHR at approximately 20 mo. In addition, insulin levels were higher in the SHR model independent of time. Furthermore, we found a higher wash-in rate constant of 18F-FDHROL in the SHR model than in the control. The onset of ejection abnormalities, evidenced by suppression of LVEF, further supports that the SHR exhibits hypertrophy at 20 mo of age (3,13,25). This hypertrophy was evidenced by reliance on glucose oxidation driven cardiac metabolism, elevated levels of circulating FFA and insulin plasma concentrations, lower levels of glucose plasma concentrations, and an increase in blood flow, which are needed to support the increased oxygen demands of the failing heart.
FA Substrate Use
Our previous longitudinal study using dynamic microSPECT imaging of β-methyl-p-123I-iodophenyl-pentadecanoic acid (123I-BMIPP) indicated a higher FA metabolic rate in two control rats, compared with two SHRs, at 14 mo and a general decrease with age in both models (26). Hajri et al. also found reduced FA oxidation in the heart of the fasted SHR by comparing the biodistribution of the slowly oxidized FA analog 125I-BMIPP in WKY controls and SHR (18). The suppressed FA uptake in this spontaneous hypertensive rat model of HF is expected due to the deficiency of CD36, a membrane FA transporter, which impairs transport of long-chain FAs across the cell membrane. These findings support the idea of a downregulation of FA oxidation as LVH progresses (3).
The inconsistency between the FA uptake rate differences observed in our previous 123I-BMIPP SPECT studies and our present 18F-FTHA PET study may be due to the fact that in the present study the SHRs were fasted and in the previous study they were fed. Initially for both rat models, fasting is expected to increase the circulating FFAs, which are preferentially oxidized by the heart. Thus, an elevated 18F-FTHA uptake is expected at early time points. The review by Stanley et al. also explained that a normal or slightly elevated rate of FA oxidation is observed at the early stage of HF (3). As LVH progressed in the SHR, we observed a hint of the expected downregulation of FA oxidation, but this trend was not significant with our measurement errors.
Although the measurement of circulating FFA plasma concentrations showed no significant difference between models when time was ignored, an age-dependent increase in the SHR FFA levels relative to the control was seen. Consequently, at 20 mo of age the SHR had higher FFA levels than the control (P = 0.035, as determined by Welch’s unpaired t test). A similar increase in plasma FFA concentrations has also been seen in HF patients in the late stages of the disease (27).
Glucose Uptake and Substrate Metabolism
The preference of metabolic fuel in the failing heart has been investigated to understand complex changes in substrate shifts between FFAs and glucose (5,8,25). Using hyperpolarized 13C in vivo imaging, Dodd et al. determined that by 15 wk of age the SHR experiences significant LVH and substrate metabolic transition away from FA β-oxidation–driven cardiac metabolism to an increase in glucose oxidation (25). This is consistent with our findings. Additionally, we observed increased KiFDG in the SHR at early ages, 8–9 mo, which is consistent with the findings of Hajri et al. (18) who found that at even earlier times (i.e., 9–10 wk) the SHR already showed increased myocardial glucose uptake.
18F-FDG uptake by the heart also relies on the rate of delivery to the myocardium, which is directly related to circulating glucose plasma concentrations (28). As previously discussed, the SHR model has a genetic defect that causes hyperinsulinemia and thus higher levels of insulin circulating in the blood than expected relative to glucose. Therefore our finding of higher insulin levels and lower glucose levels in the blood of the HF model relative to control is expected and has been previously determined using the SHR model (18) and with HF patients (3). The elevated insulin levels likely stimulate glucose uptake and oxidation by the heart as we have reported here (3).
18F-FDHROL Perfusion Imaging
18F-FDHROL proved to be an outstanding tracer for analyzing perfusion because of its characteristics of excellent extraction versus flow. This radiotracer provided an exemplary marker of flow, with improved contrast of myocardium to background and thus improved precision and bias of estimated perfusion parameters. Myocardial blood flow in the spontaneously hypertensive model has been quantitatively assessed using several different modalities (16,17,29); however, none of these studies has longitudinally evaluated the changes of myocardial blood flow in the hypertrophic onset of HF. We found that K1FDHROL was significantly higher in the SHR (P < 5 × 10⁻⁶) similar to results found previously (16,17). The elevated K1FDHROL in the SHR is likely due to increased needs of the hypertrophied myocytes. Enlarged muscle fibers inherently increase the diffusion distance of oxygen and make it a far less efficient process, thus requiring relatively more oxygen to meet the demands of the failing heart (30).
The Failing Heart
HF is by no means a highly specific disease. It is a complex process that is dependent on etiology, duration, endothelial dysfunction, and the simultaneous occurrence of complicating disorders such as diabetes, hypertension, obesity, and genetics (3). All of these factors produce a large heterogeneity among the available patient and animal models that one can study. In advanced stages of HF, there is a downregulation of FA oxidation, increased glycolysis and oxidation from the storage buffers, reduced respiratory chain activity, and impaired reserve for mitochondrial oxidative flux (3,31). Overall, the physiologic changes prevent the heart from effectively transferring chemical energy from metabolism to contractile work. What is not understood is the time course and molecular mechanisms for this switch in substrate oxidation. This lack of understanding regarding the time course characteristics of substrate oxidation motivated our present longitudinal study.
The SHR has been widely used as a model of the transition from compensated LV hypertrophy to systolic HF, exhibiting alterations in myocardial metabolism, perfusion, and overall cardiac function in the progression of HF (13,19). The drop in LVEF and increase in EDV for the SHR in this study distinguished the transition to systolic failure characterized by eccentric hypertrophy. Because the heart could no longer adequately pump through the arteries, the increased venous pressure began to build up behind the failing heart. This elevated upstream capillary hydrostatic pressure eventually led to the discharge of fluid across the capillary endothelium, producing edema in the lungs (30). All SHRs imaged in this experiment were found with fluid in their lungs on postmortem biopsy, and dilated cavity volumes were visually apparent, confirming the development of HF.
The main limitations of this study are small sample size, regional myocardial 18F-FTHA and 18F-FDG uptake related to regional variations in blood flow, and limited physiologic data (i.e., no blood pressure, no metabolite measurements). We began with 8 SHR and 8 WKY rats and ended with 1 SHR and 4 WKY rats during the last time point at approximately 2 y of age. Thus, the value determined for any given parameter, at the last time point, is not representative of the entire cohort of SHR. Moreover, because there is a heterogeneity in the time course of transition from compensated LVH to failure in the SHR, the average at a given time point may not represent the same stages in the development of LVH and onset of HF. Further work will use a larger cohort of SHRs and redefine the time points to ensure that most of the SHRs will be imaged several times before euthanasia is necessary due to progressive HF symptoms. Irreversible experimental circumstances also limited the sample size at a given time point (i.e., sample waking up and crawling out of the detector, inability to inject tracer in tail vein, and significant sample motion in multiple frames most likely due to inadequate levels of anesthesia).
The measurement of mean arterial pressure would have allowed for determination of the systemic vascular resistance in the animal models that could give insight into the dependence of preload and after-load on the determined LVEF and EDV. Given the inherent difficult and time-consuming task of noninvasively measuring mean arterial pressure in small animals, we decided not to perform these measurements in our study. In addition, metabolite corrections require rapid blood sampling immediately after intravenous injection. Obtaining blood samples is a difficult task that can lead to serious blood depletion; however, the ability to correct for metabolites offers more accurate kinetic modeling. Future work will use previously developed microsampling techniques to minimize blood loss while still providing sufficient sampling for substrate levels and metabolite analysis (32) and will investigate techniques for obtaining blood pressure measurements. Lastly, the hypertrophied heart involves thickening of myocardium walls that cause global perfusion abnormalities leading to heterogeneous myocardial perfusion. Regional myocardial metabolism and perfusion analysis could offer the possibility of locating the regional defects associated with the transition from LVH to HF in the SHR.
CONCLUSION
Our study has developed techniques to measure changes in glucose and FA substrate use during the progression of HF and has correlated these changes with alterations in perfusion and overall cardiac function. Longitudinal evaluation allowed us to study metabolic and mechanical changes during the progression of LV hypertrophy in the SHR. A significant elevation in the myocardial 18F-FDG influx rate constant was evident in the 8-mo-old SHR before development of a hypertrophied heart (i.e., no ejection abnormality). Thus, it is likely that metabolic alterations precede mechanical alterations in the onset of LVH. We believe that variations between rat and human physiology do not adversely affect our goals, because the presented results with the SHR model mimic much of the pathophysiology found with hypertensive LVH in humans (3,8). Currently, there is a need for novel metabolic therapies for HF that can improve cardiac performance and prevent or reverse the progression of LV dysfunction and remodeling (3). The optimization of cardiac substrate metabolism using metabolic agents, such as FA oxidation inhibitors, is an attractive approach because it could work in conjunction with current therapies without exerting negative hemodynamic effects (3). Thus, the presented study, which has developed the techniques to monitor substrate metabolism shifts in the progression of HF in this small-animal model, could be translated to humans to help evaluate and develop therapeutic protocols directed at preventing and managing LVH.
ACKNOWLEDGMENTS
We thank Rod Gullberg of Clearview Statistical Consulting for his assistance with the statistical analyses. We also thank Henry VanBrocklin, PhD, for his scientific consultation and administrative support.
This study was supported by the National Institutes of Health of the U.S. Department of Health and Human Services under grant R01-EB007219 and by the Director, Office of Science, Office of Biological and Environmental Research of the U.S. Department of Energy under contract DEAC02-05CH11231.
Footnotes
DISCLOSURE
No other potential conflict of interest relevant to this article was reported.
REFERENCES
- 1.Neely JR, Morgan HE. Relationship between carbohydrate and lipid metabolism and the energy balance of heart muscle. Annu Rev Physiol. 1974;36:413–459. doi: 10.1146/annurev.ph.36.030174.002213. [DOI] [PubMed] [Google Scholar]
- 2.Bing RJ, Siegel A, Ungar I, Gilbert M. Metabolism of the human heart. II. Studies on fat, ketone and amino acid metabolism. Am J Med. 1954;16:504–515. doi: 10.1016/0002-9343(54)90365-4. [DOI] [PubMed] [Google Scholar]
- 3.Stanley WC, Recchia FA, Lopaschuk GD. Myocardial substrate metabolism in the normal and failing heart. Physiol Rev. 2005;85:1093–1129. doi: 10.1152/physrev.00006.2004. [DOI] [PubMed] [Google Scholar]
- 4.Taegtmeyer H, Wilson CR, Razeghi P, Sharma S. Metabolic energetics and genetics in the heart. Ann N Y Acad Sci. 2005;1047:208–218. doi: 10.1196/annals.1341.019. [DOI] [PubMed] [Google Scholar]
- 5.Taylor M, Wallhaus TR, Degrado TR, et al. An evaluation of myocardial fatty acid and glucose uptake using PET with [18F]fluoro-6-thia-heptadecanoic acid and [18F]FDG in patients with congestive heart failure. J Nucl Med. 2001;42:55–62. [PubMed] [Google Scholar]
- 6.de las Fuentes L, Herrero P, Peterson LR, Kelly DP, Gropler RJ, Davila-Roman VG. Myocardial fatty acid metabolism: independent predictor of left ventricular mass in hypertensive heart disease. Hypertension. 2003;41:83–87. doi: 10.1161/01.hyp.0000047668.48494.39. [DOI] [PubMed] [Google Scholar]
- 7.Kudo T, Fukuchi K, Annala AJ, et al. Noninvasive measurement of myocardial activity concentrations and perfusion defect sizes in rats with a new small-animal positron emission tomograph. Circulation. 2002;106:118–123. doi: 10.1161/01.cir.0000020221.28996.78. [DOI] [PubMed] [Google Scholar]
- 8.Dávila-Román VG, Vedala G, Herrero P, et al. Altered myocardial fatty acid and glucose metabolism in idiopathic dilated cardiomyopathy. J Am Coll Cardiol. 2002;40:271–277. doi: 10.1016/s0735-1097(02)01967-8. [DOI] [PubMed] [Google Scholar]
- 9.Mäki MT, Haaparanta M, Nuutila P, et al. Free fatty acid uptake in the myocardium and skeletal muscle using fluorine-18-fluoro-6-thia-heptadecanoic acid. J Nucl Med. 1998;39:1320–1327. [PubMed] [Google Scholar]
- 10.DeGrado TR, Coenen HH, Stocklin G. 14(R,S)-[18F]fluoro-6-thia-heptadecanoic acid (FTHA): evaluation in mouse of a new probe of myocardial utilization of long chain fatty acids. J Nucl Med. 1991;32:1888–1896. [PubMed] [Google Scholar]
- 11.Szymanski MK, Kruizinga S, Tio RA, et al. Use of gated 13N-NH3 micro-PET to examine left ventricular function in rats. Nucl Med Biol. 2012;39:724–729. doi: 10.1016/j.nucmedbio.2011.12.009. [DOI] [PubMed] [Google Scholar]
- 12.Katz AM. Mechanisms and abnormalities of contractility and relaxation in the failing heart. Cardiologia. 1993;38:39–43. [PubMed] [Google Scholar]
- 13.Bing OH, Brooks WW, Robinson KG, et al. The spontaneously hypertensive rat as a model of the transition from compensated left ventricular hypertrophy to failure. J Mol Cell Cardiol. 1995;27:383–396. doi: 10.1016/s0022-2828(08)80035-1. [DOI] [PubMed] [Google Scholar]
- 14.de las Fuentes L, Soto PF, Cupps BP, et al. Hypertensive left ventricular hypertrophy is associated with abnormal myocardial fatty acid metabolism and myocardial efficiency. J Nucl Cardiol. 2006;13:369–377. doi: 10.1016/j.nuclcard.2006.01.021. [DOI] [PubMed] [Google Scholar]
- 15.Porenta G, Kuhle W, Sinha S, et al. Parameter estimation of cardiac geometry by ECG-gated PET imaging: validation using magnetic resonance imaging and echocardiography. J Nucl Med. 1995;36:1123–1129. [PubMed] [Google Scholar]
- 16.Granstam SO, Granstam E, Fellstrom B, Lind L. Regional haemodynamic differences between normotensive and spontaneously hypertensive rats: a microsphere study. Physiol Res. 1998;47:9–15. [PubMed] [Google Scholar]
- 17.Nishiyama K, Nishiyama A, Frohlich ED. Regional blood flow in normotensive and spontaneously hypertensive rats. Am J Physiol. 1976;230:691–698. doi: 10.1152/ajplegacy.1976.230.3.691. [DOI] [PubMed] [Google Scholar]
- 18.Hajri T, Ibrahimi A, Coburn CT, et al. Defective fatty acid uptake in the spontaneously hypertensive rat is a primary determinant of altered glucose metabolism, hyperinsulinemia, and myocardial hypertrophy. J Biol Chem. 2001;276:23661–23666. doi: 10.1074/jbc.M100942200. [DOI] [PubMed] [Google Scholar]
- 19.Brooks WW, Shen SS, Conrad CH, Goldstein RH, Bing OH. Transition from compensated hypertrophy to systolic heart failure in the spontaneously hypertensive rat: structure, function, and transcript analysis. Genomics. 2010;95:84–92. doi: 10.1016/j.ygeno.2009.12.002. [DOI] [PubMed] [Google Scholar]
- 20.Janabi M, Gullberg GT, O’Neil JP. The use of GE’s automated synthesis module (FxFN) for the production of [18F]fluorodihydrorotenol (FDHROL) and [18F]fluoro-thia-6-heptadecanoic acid [abstract] J Label Compd Radiopharm. 2011;54 [Google Scholar]
- 21.Patlak CS, Blasberg RG, Fenstermacher JD. Graphical evaluation of blood-to-brain transfer constants from multiple-time uptake data. J Cereb Blood Flow Metab. 1983;3:1–7. doi: 10.1038/jcbfm.1983.1. [DOI] [PubMed] [Google Scholar]
- 22.Hashimoto K, Nishimura T, Imahashi KI, Yamaguchi H, Hori M, Kusuoka H. Lumped constant for deoxyglucose is decreased when myocardial glucose uptake is enhanced. Am J Physiol. 1999;276:H129–H133. doi: 10.1152/ajpheart.1999.276.1.H129. [DOI] [PubMed] [Google Scholar]
- 23.Kety SS. The theory and applications of the exchange of inert gas at the lungs and tissues. Pharmacol Rev. 1951;3:1–41. [PubMed] [Google Scholar]
- 24.Zeng GL, Hernandez A, Kadrmas DJ, Gullberg GT. Kinetic parameter estimation using a closed-form expression via integration by parts. Phys Med Biol. 2012;57:5809–5821. doi: 10.1088/0031-9155/57/18/5809. [DOI] [PMC free article] [PubMed] [Google Scholar]
- 25.Dodd MS, Ball DR, Schroeder MA, et al. In vivo alterations in cardiac metabolism and function in the spontaneously hypertensive rat heart. Cardiovasc Res. 2012;95:69–76. doi: 10.1093/cvr/cvs164. [DOI] [PMC free article] [PubMed] [Google Scholar]
- 26.Reutter BW, Huesman RH, Brennan KM, Boutchko R, Hanrahan SM, Gullberg GT. Longitudinal evaluation of fatty acid metabolism in normal and spontaneously hypertensive rat hearts with dynamic microSPECT imaging. Int J Mol Imaging. 2011;2011:893129. doi: 10.1155/2011/893129. [DOI] [PMC free article] [PubMed] [Google Scholar]
- 27.Paolisso G, Gambardella A, Galzerano D, et al. Total-body and myocardial substrate oxidation in congestive heart failure. Metabolism. 1994;43:174–179. doi: 10.1016/0026-0495(94)90241-0. [DOI] [PubMed] [Google Scholar]
- 28.Taegtmeyer H. Tracing cardiac metabolism in vivo: one substrate at a time. J Nucl Med. 2010;51(suppl 1):80S–87S. doi: 10.2967/jnumed.109.068205. [DOI] [PMC free article] [PubMed] [Google Scholar]
- 29.Iltis I, Kober F, Dalmasso C, Cozzone PJ, Bernard M. Noninvasive characterization of myocardial blood flow in diabetic, hypertensive, and diabetic-hypertensive rats using spin-labeling MRI. Microcirculation. 2005;12:607–614. doi: 10.1080/10739680500301607. [DOI] [PubMed] [Google Scholar]
- 30.Katz AM. Physiology of the Heart. 5th ed. Philadelphia, PA: Wolters Kluwer Health/Lippincott Williams & Wilkins Health; 2011. [Google Scholar]
- 31.Remondino A, Rosenblatt-Velin N, Montessuit C, et al. Altered expression of proteins of metabolic regulation during remodeling of the left ventricle after myocardial infarction. J Mol Cell Cardiol. 2000;32:2025–2034. doi: 10.1006/jmcc.2000.1234. [DOI] [PubMed] [Google Scholar]
- 32.Sharp TL, Dence CS, Engelbach JA, Herrero P, Gropler RJ, Welch MJ. Techniques necessary for multiple tracer quantitative small-animal imaging studies. Nucl Med Biol. 2005;32:875–884. doi: 10.1016/j.nucmedbio.2005.05.010. [DOI] [PubMed] [Google Scholar]


