

Abstract
AIM: To explore mitochondrial dysfunction in nonalcoholic steatohepatitis (NASH) by analyzing the proteome of liver mitochondria from a NASH model.
METHODS: The NASH rat model was established by feeding rats a fat-rich diet for 24 wk and was confirmed using hematoxylin and eosin staining of liver tissue and by changes in the levels of serum alanine transaminase, aspartate aminotransferase, triglyceride, total cholesterol and other markers. Liver mitochondria from each group were isolated using differential centrifugation. The mitochondrial samples were lyzed, purified and further analyzed using two-dimensional electrophoresis combined with matrix-assisted laser desorption/ionization tandem time-of-flight mass spectrometry. Bioinformatic analyses of assigned gene ontology and biological pathway was used to study functional enrichments in the abundant proteomic data.
RESULTS: Eight up-regulated and sixteen down-regulated proteins were identified that showed greater than 1.5-fold differences between the controls and the NASH group. These dysregulated proteins were predicted to be involved in different metabolic processes including fatty acid β-oxidation processes, lipid metabolic processes, cell-cycle arrest, cell polarity maintenance, and adenosine triphosphate/sex hormone metabolic processes. Novel proteins that may be involved in NASH pathogenesis including the trifunctional enzyme Hadha, thyroxine, prohibitin, aldehyde dehydrogenase ALDH1L2, UDP-glucuronosyltransferase 2B31, and carbamoyl-phosphate synthase were identified using bioinformatics tools. The decreased expression of Hadha in NASH liver was verified by Western blotting, which was used as a complementary technique to confirm the proteomic results.
CONCLUSION: This novel report on the liver mitochondrial proteome of a NASH model may provide a reservoir of information on the pathogenesis and treatment of NASH.
Keywords: Nonalcoholic steatohepatitis, Hadha, Proteomics, Rat model
Core tip: Nonalcoholic fatty liver disease (NAFLD) is a major worldwide cause of chronic liver diseases, and nonalcoholic steatohepatitis (NASH) plays a critical role as a “turning point” in the development of NAFLD. Nevertheless, the pathogenesis of NASH remains unclear, and mitochondrial dysfunction is known to be actively involved. To date, no study has reported on specific protein expression patterns in NASH mitochondria. We have, for the first time, performed a proteomic analysis of mitochondria from NASH rats, aiming to provide a protein reservoir for in-depth analyses of NASH mechanisms and for the exploration of potential therapeutics.
INTRODUCTION
Nonalcoholic fatty liver disease (NAFLD) is a major cause of chronic liver disease in North America, and its prevalence has been estimated to be as high as 35% in some populations[1]. Currently, NAFLD is considered to be a hepatic manifestation of the metabolic syndrome that develops progressively from simple steatosis to nonalcoholic steatohepatitis (NASH), fibrosis and cirrhosis[2]. Of these stages, NASH is a vital stage due to its role as the “turning point” in NAFLD development. Hepatic steatosis is known to be reversible; however, NASH is typically irreversible and the rate of progression to liver cirrhosis accelerates when NASH occurs. A recent study showed that 41% and 5.4% of NASH patients progress to liver fibrosis and end-stage liver disease, respectively[3]. NASH is therefore a major risk factor for cryptogenic liver cirrhosis[4] and requires more in-depth investigation.
Although Day and James[5] previously outlined a “two-hit hypothesis” for NAFLD, the general mechanisms underlying the pathogenesis of NASH remain unclear. Currently, oxidative and endoplasmic reticulum stress, inflammatory factor release, and in particular, hepatic mitochondrial dysfunction are considered to be actively involved in NASH[6]. Mitochondria play a major role in cell energy-generating processes and integrate several signaling pathways to control cellular life and death. Accumulating evidence has shown that NAFLD is characterized by mitochondrial alterations that depend on the activation of intracellular stress cascades or receptor-mediated pathways[7]. Furthermore, NASH is considered a mitochondrial disease[8], which reinforces the importance of mitochondrial dysfunction in its pathogenesis.
How mitochondrial dysfunction affects the initiation and progression of NASH remains unclear. Previous studies have shown that impaired adenosine triphosphate (ATP) formation and augmented generation of reactive oxygen species by the damaged respiratory chain may underlie the deterioration in mitochondrial dysfunction in NASH[9]. Technological advancements have gradually uncovered the complex mechanism of mitochondrial dysfunction in NASH. For example, proteomic techniques have provided a novel and high-throughput method for elucidating the complex pathogenesis of NAFLD[10]. Using two-dimensional electrophoresis (2-DE) and matrix-assisted laser desorption/ionization tandem time-of-flight (MALDI-TOF-TOF) mass spectrometry (MS), our group reported unique protein expression patterns in a rat model of different stages of NAFLD[11] and in a mouse model of ischemia/reperfusion injury and ischemic preconditioning[12]. Recently, we also identified serum biomarkers enabling NAFLD diagnosis using a combination of surface-enhanced laser desorption/ionization (SELDI)-TOF-MS and bioinformatics[13].
However, the specific protein expression pattern in NASH liver mitochondria has rarely been reported. Considering the importance of NASH in the clinical progression of NAFLD and the complexity of mitochondrial dysfunction in disease initiation and progression, we report the first proteomic analysis of liver mitochondria from the NASH rat model. We aimed to provide a protein reservoir for future in-depth analyses of NASH pathogenesis and progression.
MATERIALS AND METHODS
Ethics statement
This study was approved by the Review Board of the First Affiliated Hospital, School of Medicine, Zhejiang University, China. All animal studies were conducted according to the regulations and guidelines for the use and care of experimental animals of the Department of Gastroenterology, the First Affiliated Hospital, School of Medicine, Zhejiang University, China.
Establishment of the NASH rat model
Twenty four Sprague-Dawley rats (Rattus norvegicus) weighing 160-170 g were purchased from the Medical Science Institution of Zhejiang Province (Hangzhou, China) and were randomly divided into NASH (n = 12) and control (n = 12) groups, as reported previously[14]. All rats received food and water ad libitum and were maintained on a 12/12-h light/dark cycle. The control group was provided with a basic diet, whereas the NASH group was fed a fat-rich diet, as described previously[15]. After 24 wk, the rats were euthanized by femoral exsanguination, and alanine transaminase (ALT), aspartate aminotransferase (AST), triglyceride (TG), total cholesterol (TCh), and hepatic TG levels were measured. The hepatic index, which was used to describe the lipid overload in the liver, was calculated as the ratio between liver wet weight and body weight. Liver sections were stained using hematoxylin and eosin (HE) and observed for hepatic steatosis and inflammation using an Olympus microscope. The severity of hepatic injury was estimated according to the histological activation index (HAI) as described previously[16].
Isolation of mitochondria and sample preparation
Liver mitochondria from each group were isolated using differential centrifugation. First, liver sections were excised from the euthanized rats, washed with 0.25 mol/L sucrose and homogenized (1/10, w/v, 600 μg) in a JA-17 rotor using MSHE (0.22 mol/L mannitol, 0.07 mol/L sucrose, 0.5 mmol/L EGTA, 0.1% bovine serum albumin, and 2 mmol/L Hepes/KOH, pH 7.4) at 4 °C for 5 min. The supernatant was then centrifuged at 10300 g for 10 min. Next, intact purified mitochondria were isolated using Percoll (Sigma, CA, United States) to remove contaminating organelles and broken mitochondria. The pellet (mainly the mitochondrial fraction) was then re-suspended in 5 mL of MSHE (225 mmol/L mannitol, 1 mmol/L EGTA, 25 mmol/L Hepes, and 0.1% bovine serum albumin) supplemented with 20 mL of 30% Percoll. This solution was spun at 95000 g in a Hitachi RP50T rotor for 30 min. The fraction with a density of 1.052-1.075 g/mL was then collected and washed twice with MSHE at 6300 g for 10 min to remove the Percoll. Finally, the purified mitochondria were washed twice using 150 mmol/L KCl and MSHE sequentially.
The mitochondrial samples were then processed for the experiment. First, lysis buffer containing 30 mmol Tris, 8 mol Urea, and 4% CHAPS 3-[(3-cholamidopropyl)-dimethyammonio]-1-propane sulfate) was added to the microfuge tubes to re-suspend the purified mitochondria and the suspension was stored at 4 °C for at least 2 h. The mitochondrial suspension, while on ice, was sonicated intermittently for 10 s bursts followed by 10-s cooling periods. This process was repeated 15 times. After sonication, the samples were centrifuged at 12000 g at 4 °C for 30 min. The supernatant was transferred to a new tube and any pellet was discarded. Contaminants were further removed using a 2-D Clean Up Kit (GE Healthcare, United States), and the protein concentrations were calculated using a 2-D Quant Kit (GE Healthcare, CT, United States).
2-DE and image analysis
Three-hundred micrograms of protein was diluted with rehydration solution comprising 8 mol urea, 2% CHAPS, 13 mmol/L DTT, 0.5% IPG buffer, and 0.002% bromophenol blue (pH = 3-10) to a total volume of 450 mL. The protein solution was loaded onto six 24-cm Immobiline dry strips pH = 3-10 (GE Healthcare), which were used for isoelectric focusing on an Ettan IPGphor 3 IEF system (GE Healthcare) for a total of 66000 volt-hours. 2-D SDS-PAGE was performed on all six polyacrylamide gels simultaneously using an Ettan DALT Six electrophoresis unit at 5 W/strip for 45 min and then at 15 W/strip until the bromophenol blue reached the bottom of the gels. Protein spots on the gels were visualized using routine methods, and the 2-D images were scanned using a high-resolution image scanner at 300 pixels per inch. Image Master 2D Platinum 6.0 (GE Healthcare) software was used to match and analyze the protein spots. Triplicate gels for each sample were used to reduce experimental errors. An average increase or decrease greater than 1.5-fold between the NASH and control groups was used to identify the differentially expressed proteins.
In-gel digestion and MALDI-TOF-TOF/MS identification
The differentially expressed proteins were excised from silver stained gels. Each spot was destained by washing with a 1:1 solution of 30 mmol potassium ferricyanide and 100 mmol sodium thiosulfate followed by equilibration in 200 mmol ammonium bicarbonate for 20 min. After washing twice with Milli-Q water, the gel spots were dehydrated by adding acetonitrile and dried in a SpeedVac (Thermo Savant, United States) for 15 min. Subsequently, the gel spots were rehydrated in 5 μL trypsin solution (20 ng/μl in 200 mmol NH4HCO3) and incubated at 37 °C overnight. After eluting twice with 30 μL 50% acetonitrile and 5% trifluoroacetic acid, 1 μL peptide mixture was mixed with 1 μL cyano-4-hydroxycinnamic acid (10 mg/mL, Sigma, United States) and then saturated with 50% acetonitrile in 0.05% trifluoroacetic acid.
The mixture was analyzed using a MALDI-TOF-TOF mass spectrometer (4800 Proteomics Analyzer; Applied Biosystems, United States). Data were acquired in a positive MS reflector mode at a scan range of 800-4000 Da. Five monoisotopic precursors (S/N > 200) were selected for tandem mass analysis. To interpret the mass spectra, a combination of peptide mass fingerprints and peptide fragmentation patterns were used for protein identification against the National Center for Biotechnology Information (NCBI) non-redundant protein database using the Mascot search engine (www.matrixscience.com). All mass values were considered monoisotopic, and the mass tolerance was set to 150 ppm.
Western blotting and bioinformatics analyses
Hadha protein levels in liver from the NASH and control groups were examined using Western blotting with a primary mouse polyclonal antibody raised against Hadha (1:500; Abcam, United Kingdom) and an ECL chemiluminescence kit (Santa Cruz, Texas, United States). Bands were normalized by comparing to a western blot of the same samples, but probed with a mouse anti-GAPDH antibody. The sequences of Hadha and all uncoupling proteins (UCPs) were obtained from the NCBI gene and protein databases and aligned using CLUSTAL X version 2.08 using the SLIM substitution matrix and other default parameters, as described previously[17]. For more information, the gene ontology (GO) database was used to complete functional enrichment analyses of the proteomic data we obtained.
Statistical analysis
Each experiment was performed in triplicate, and the data were expressed as the mean ± SE. Student’s t-tests were used to compare two unpaired groups and were executed by SPSS 17.0. Differences were considered statistically significant at P < 0.05.
RESULTS
Establishment of the NASH rat model
The NASH rat model was established successfully as confirmed by both serological and pathological changes. After feeding the rats a 24-wk high-fat diet, HE staining of NASH liver revealed varying degrees of fat deposition and mild to moderate chronic portal and intra-acinar inflammation (Figure 1). When compared with the control group, serum ALT, AST, TG and TCh levels, hepatic TG, hepatic index, and the HAI were all significantly increased in the NASH group (Table 1).
Figure 1.
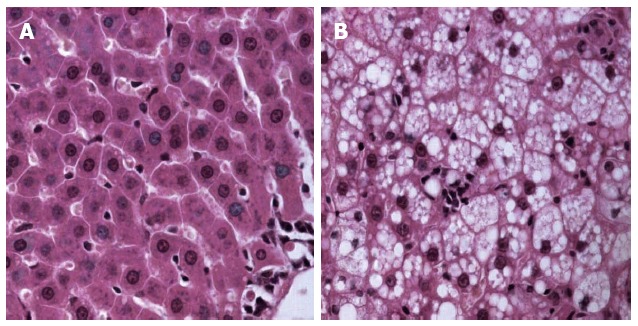
Pathology of nonalcoholic steatohepatitis and control group liver after hematoxylin and eosin staining. A: Control group; B: Nonalcoholic steatohepatitis group.
Table 1.
Comparison of hepatic and serological markers in nonalcoholic steatohepatitis liver
| Marker |
Group |
|
| NASH | Control | |
| Hepatic index (%) | 3.79 ± 0.25a | 2.51 ± 0.19 |
| ALT (IU/L) | 153.51 ± 16.39a | 47.44 ± 14.06 |
| AST (IU/L) | 221.63 ± 37.28a | 104.31 ± 16.07 |
| TG (mmol/L) | 0.93 ± 0.12a | 0.55 ± 0.11 |
| Tch (mmol/L) | 2.95 ± 0.41a | 1.41 ± 0.23 |
| Hepatic TG (mmol/L) | 5.66 ± 0.71a | 1.43 ± 0.14 |
| HAI | 3.69 ± 0.51a | 1.31 ± 0.16 |
Values are expressed as the mean ± SE,
P < 0.05. NASH: Nonalcoholic steatohepatitis; ALT: Alanine transaminase; AST: Aspartate aminotransferase; TG: Triglyceride; TCh: Total cholesterol; HAI: Histological activation index.
Quantitative proteomic analysis
The liver mitochondrial protein profiles of NASH and control rats were determined using a 2-DE approach. Briefly, 800-1000 protein spots per gel were detected using the Image Master 2D Platinum 6.0 software for image analysis. Differentially expressed spots were detected using a 2-D pattern comparison between the NASH and control groups. Using Student’s t-tests, 34 protein spots showed changes of more than 1.5-fold between the NASH and control groups at a statistical significance of P < 0.05 (Figure 2). These differentially expressed protein spots were picked from the preparative gels and subjected to in-gel digestion and MALDI-TOF-TOF mass analysis. A total of eight up-regulated and sixteen down-regulated proteins were matched and identified, as displayed in Table 2. These dysregulated proteins were predicted to be involved in different metabolic processes including fatty acid β-oxidation processes, lipid metabolic processes, cell-cycle arrest, cell polarity maintenance, ATP metabolic processes, and sex hormone metabolic processes.
Figure 2.
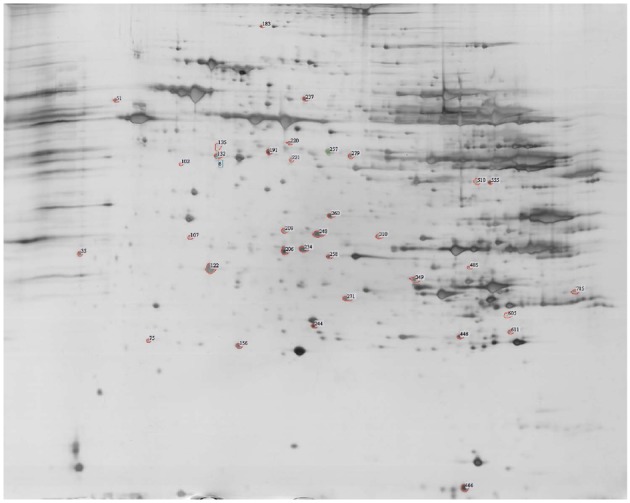
Representative two-dimensional electrophoresis image of proteins from the control and nonalcoholic steatohepatitis rat livers. The numbered spots denote proteins that exhibited modified expression levels in nonalcoholic steatohepatitis (NASH) liver.
Table 2.
Dysregulated proteins in liver mitochondria of nonalcoholic steatohepatitis rats
| Spot no. | Protein GI | Protein name | Fold change | GO molecular function | |
| Up-regulated | 611 | 157822175 | dehydrogenase 1 β subcomplex 10 (Ndufb10) | 3.05 | metabolic process/electron transport/ATP synthesis |
| 605 | 257467641 | Suppressor of glucose by autophagy (SOGA) | 2.97 | suppressing glucogenesis | |
| 510 | 29436756 | Nuclear mitotic apparatus protein 1 | 2.68 | microtubule binding/tubulin binding | |
| 220 | 76779273 | Hspd1 protein | 2.54 | ATP binding/insulin binding | |
| 349 | 149029483 | Mitochondrial F1 complex, alpha subunit, isoform 1 | 2.49 | ATP synthesis/ADP binding | |
| 51 | 202549 | Iodothyronine 5' monodeiodinase | 2.37 | deiodination of thyroxine to T3 | |
| 135 | 148676986 | Phosphoglucomutase 5 | 1.81 | carbohydrate metabolism/Ca2+ homeostasis | |
| 35 | 344244087 | UDP-glucuronosyl-transferase 2B31 | 1.65 | transferase activity/transferring hexosyl groups | |
| Down-regulated | 310 | 158631196 | Peptidyl-prolyl cis-trans isomerase H isoform 2 | -106 | isomerase activity/ribonucleoprotein complex binding |
| 208 | 225690572 | Leucine-rich repeat- containing protein 49 isoform 3 | -106 | protein-protein interaction/component of immune system | |
| 183 | 300796253 | Mitochondrial 10-formyltetrahydrofolate dehydrogenase (ALDH1L2) | -106 | folate metabolism/CO production | |
| 221 | 123244269 | Microtubule-actin crosslinking factor 1 | -106 | ATPase activity/calcium ion binding/microtubule binding | |
| 132 | 148687612 | DEAH (Asp-Glu-Ala-His) box polypeptide 37, isoform CRA_b | -3.88 | ATP binding/helicase and hydrolase activity | |
| 248 | 60688189 | Agmat protein | -2.85 | agmatinase activity/hydrolase activity/metal ion binding | |
| 244 | 351700869 | Zinc finger protein 613 | -2.52 | nucleic acid binding/zinc ion binding | |
| 258 | 47087119 | Estradiol 17-β-dehydrogenase 8 | -2.24 | 3-hydroxyacyl-CoA dehydrogenase activity/estradiol 17-β-dehydrogenase activity/oxidoreductase activity/testosterone 17-β-dehydrogenase (NAD+) activity | |
| 122 | 6679299 | Prohibitin | -2.14 | histone deacetylase binding/transcription regulatory region DNA binding | |
| 237 | 8393186 | carbamoyl-phosphate synthase | -1.88 | ATP binding/calcium ion binding/carbamoyl-phosphate synthase (ammonia) activity | |
| 234 | 20304123 | 3-mercaptopyruvate sulfurtransferase | -1.87 | 3-mercaptopyruvate sulfurtransferase activity/thiosulfate sulfurtransferase activity/transferase activity | |
| 179 | 149027156 | Mitochondrial 3-oxoacyl-coenzyme A thiolase, isoform CRA_f | -1.85 | acetyl-CoA C-acyltransferase activity/transferase activity | |
| 260 | 148747393 | Trifunctional enzyme subunit, alpha, mitochondrial precursor (Hadha) | -1.76 | 3-hydroxyacyl-CoA dehydrogenase activity | |
| NAD binding/enoyl-CoA hydratase activity/fatty-acyl-CoA binding/long-chain-3-hydroxyacyl-CoA dehydrogenase activity | |||||
| 156 | 347800699 | T-complex protein 1 subunit theta | -1.74 | ATP binding/nucleotide binding/unfolded protein binding | |
| 257 | 11968102 | Ornithine aminotransferase, mitochondrial precursor | -1.60 | 2-oxoglutarate 5-5-aminotransferase activity/ornithine-oxo-acid transaminase activity/pyridoxal phosphate binding | |
| 206 | 351715881 | GRIP and coiled-coil domain | -1.55 | protein binding-containing protein 2 |
The -106-fold change denotes very low expression in the NASH group compared with the control group. GIs in bold italics are proteins that are known to be located exclusively in mitochondria. Underlined proteins are known to be located in the inner mitochondrial membrane. ATP: Adenosine triphosphate (ATP); GO: Gene ontology.
The 24 identified proteins were selected using a peptide matching method. Therefore, it is not surprising that over half were similar to proteins from other Rodentia species, such as Mus musculus, Cavia porcellus, Heterocephalus glaber, and Cricetulus griseus. Because we used R. norvegicus as the NASH rat model in this study and to increase the reliability of our results, we selected seven proteins that matched proteins from R. norvegicus from the UniProt database (Table 3). Interestingly, only protein Ndufb10 (UniProt ID: D4A0T0) was up-regulated, whereas the other six proteins were down-regulated in the NASH group compared with the control group. Moreover, the GO cellular component analysis showed that only Agmatinase (UniProt ID: Q0D2L3) was located exclusively in the mitochondrion, whereas the other proteins were expressed in both the cytoplasm and mitochondria. In addition, with the exception of estradiol 17-β-dehydrogenase 8 (UniProt ID: Q6MGB5), which is hydrophobic, the other six proteins are hydrophilic. The proteomics data has provided basic information that may serve as a protein reservoir, although further functional studies on specific proteins are urgently required.
Table 3.
Dysregulated proteins that match uniprot proteins from Rattus norvegicus
| UniProt ID | Gravity1 | Fold change | GO biological process | |
| Up-regulated | D4A0T0 | -0.937 | 3.05 | Biological process |
| Down-regulated | Q0D2L3 | -0.033 | -2.85 | Putrescine biosynthetic process/spermidine biosynthetic process |
| Q6MGB5 | 0.137 | -2.24 | Androgen metabolic process/estrogen and fatty acid biosynthetic process/oxidation- reduction process | |
| P07756 | -0.177 | -1.88 | Anion homeostasis/carbamoyl phosphate biosynthetic process/cellular response to cAMP and fibroblast growth factor stimulus/hepatocyte differentiation and liver development/metabolic process | |
| P97532 | -0.292 | -1.87 | 3-Mercaptopyruvate sulfurtransferase activity | |
| Q64428 | -0.081 | -1.76 | Fatty acid β-oxidation/fatty acid and lipid metabolic process/oxidation-reduction process/response to insulin stimulus | |
| P04182 | -0.113 | -1.60 | Ornithine metabolic process |
Gravity values < 0 indicate hydrophilicity, whereas values > 0 indicate hydrophobicity.
Validation and bioinformatics analyses of Hadha
Among the dysregulated proteins from R. norvegicus, Hadha (UniProt ID: Q64428) was annotated as a mitochondrial inner membrane protein. Bioinformatics analyses revealed that the sequence of rat Hadha was similar to known UCPs. Because UCP2 is known to be actively involved in NAFLD due to its uncoupling activity[18], we tested Hadha expression levels in our samples using Western blotting. As shown in Figure 3, the steady-state level of hepatic Hadha was almost 50% less in the NASH group compared with the control group. This expression pattern is consistent with the 2-DE results and the peptide mass fingerprinting for Hadha, as shown in Figure 4.
Figure 3.
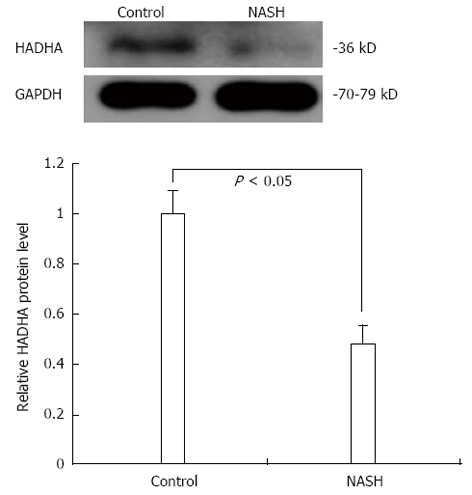
Significantly decreased hadha levels in nonalcoholic steatohepatitis rat mitochondria using Western blotting. NASH: Nonalcoholic steatohepatitis.
Figure 4.
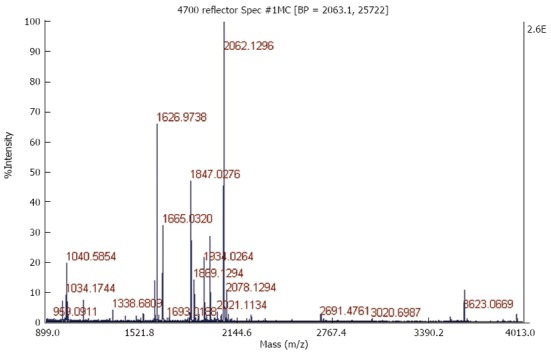
Peptide mass fingerprinting of an in-gel tryptic digest of the Hadha protein.
DISCUSSION
NASH is considered a vital stage in NAFLD development because of its propensity to progress to advanced disease stages. Although NASH has been investigated intensively and mitochondrial dysfunction is known to be actively involved, the underlying mechanism remains unclear. Mitochondria play a major role in cellular life and death by controlling cell energy-generating processes. More importantly, the mitochondrion has its own genome, which produces organ-specific proteins and exerts vital biological functions[19]. A previous study by our group revealed the protein profiles during different stages of NAFLD[11]; however, the global mitochondrial protein expression in NASH remains unknown. In the current study, we systematically analyzed the liver mitochondrial proteome in a high-fat diet-induced NASH rat model and produced a novel protein reservoir that may help to elucidate the mechanism underlying NASH progression.
Of the 24 significantly dysregulated proteins, some have already been reported to participate in NASH progression. For example, of the up-regulated proteins, SOGA was identified as the target of adiponectin in reducing glucose production[20] and thus, may be involved in the development of NASH. Intriguingly, iodothyronine 5' monodeiodinase, which functions in the deiodination of thyroxine to T3, was significantly increased in liver mitochondria from NASH rats. A previous study also showed its potential association with lipid peroxidation, which is vital to NASH progression[21]. Taken together, these results reveal the potential involvement of thyroxine in NASH, although further investigations are needed. Furthermore, Nomura et al[22] showed enhanced ADP-ribosylation of phosphoglucomutase in patients with excess alcohol intake. Considering the similarity in pathology between alcoholic liver disease and NAFLD, its effect in NASH is also worth investigating. Finally, the increased UDP-glucuronosyltransferase 2B31 level in NASH liver was partially in line with a previous finding that UDP-glucuronosyltransferase levels in mouse liver increased in obesity and in fasting-induced steatosis[23].
Similarly, among down-regulated proteins, ALDH1L2 has been identified as the mitochondrial homolog of 10-formyltetrahydrofolate dehydrogenase, an abundant enzyme involved in folate metabolism[24]. A previous study showed that ALDH1L2 was a likely source of CO production from 10-formyltetrahydrololate in mitochondria[25]. Therefore, by influencing folate metabolism, ALDH1L2 may also be involved in NASH progression. Moreover, increased and decreased expression of prohibitin was found in cells expressing hepatitis C virus core protein[26] and in regenerating the liver[27], respectively. We observed decreased prohibitin levels in NASH liver, which may act by blocking cell proliferation and inducing apoptosis, as reported previously in human hepatoma cells[28]. In addition, depletion of carbamoyl-phosphate synthase was reported in liver during sepsis and was found to act as a marker of mitochondrial damage[29]. We also observed decreased carbamoyl-phosphate synthase in NASH rat liver, which indicated the involvement of mitochondrial damage in NASH progression. Nevertheless, many other proteins that may play a potential role in NASH are reported here for the first time, providing a novel protein reservoir for disease development that requires further confirmation.
As potentially redundant information may be produced from the study of a single protein and the potential interaction between different proteins, it is vital to enrich protein function using pathway analyses. Because we used a NASH rat model, we focused our analyses on protein information from R. norvegicus. Based on these two criteria, we selected seven of the dysregulated proteins and examined common biological pathways that they shared. Several NASH-related pathways have been reported previously including insulin binding, fatty acid and lipid metabolic processes, and oxidation reduction processes, as shown in Table 3. We also discovered several pathways that are novel including androgen/estrogen metabolic processes, cellular response to cAMP and fibroblast growth factor stimulus, and 3-mercaptopyruvate sulfurtransferase activity. These pathways may indicate that novel mechanisms are involved in the progression of NASH and require further investigation.
Hadha was among the significantly dysregulated proteins and has been previously reported to be a candidate gene for NAFLD identification[30]. UCPs are known for their role in oxidative phosphorylation and their participation in NAFLD pathogenesis[18,31]. In this study, we confirmed the significant decrease in Hadha using Western blotting, but the detailed mechanism is, as yet, unknown. Several explanations are possible: Firstly, Hadha may influence the metabolism of fatty acid via its role in dehydrating 3-hydroxyacyl-CoA. Secondly, each protein in the mitochondrial inner membrane may possess uncoupling activity, as was previously proposed by several researchers[32]. Because Hadha is located in the mitochondrial inner membrane and shares sequence similarity with UCPs, it may participate in NASH progression by influencing ATP synthesis and levels of oxidative stress.
This study has several limitations that should be acknowledged. Firstly, only 12 of the 24 selected proteins were found to be located exclusively in mitochondria (Table 2). The other 12 proteins are also found in the cytoplasm. A possible explanation may be the multi-function characteristics of these proteins. For instance, microtubule-actin crosslinking factor 1 may exert its ATPase activity in mitochondria, but its calcium ion binding function in the cytoplasm. Secondly, although the high-fat diet-induced rat model developed steatohepatitis that was morphologically similar to human NASH, it would be more convincing if the dysregulation of these proteins was verified in human patients. Thirdly, of the 24 identified proteins, only Hadha was verified, and future studies will confirm the other 23 proteins and their functions. Fourthly, the data on Hadha level is preliminary. Our result contrasted with the increase in Hadha mRNA in NAFLD human subjects as described by Kohjima et al[33]. Nevertheless, our result is at the protein level, whereas their result is at the mRNA level, which suggests the potential for post transcriptional regulation, such as miRNA regulation and methylation. Our next step will be to investigate both gene and protein expression of Hadha in larger animals and in patient samples. Finally, the 2-DE method itself has shortcomings as it does not generally detect proteins with high (> 150 kD) or low (< 10 kD) molecular masses, or very basic or hydrophobic proteins, thus limiting the proteomic coverage of most biological samples.
In summary, the differential proteomic approach that we employed enabled the identification of important changes in mitochondrial protein expression in a NASH rat model, which provides a protein reservoir for future investigation of the mechanism of NASH development. In addition, the down-regulation of Hadha in NASH liver and its sequence similarity to known UCPs implies its potential role in NASH via uncoupling activity. Nevertheless, the underlying molecular mechanism and the regulatory network involved require further investigation.
COMMENTS
Background
Nonalcoholic fatty liver disease (NAFLD) is a major cause of chronic liver disease in North America, and its prevalence has been estimated to be as high as 35% in some populations. The spectrum of NAFLD includes simple steatosis, nonalcoholic steatohepatitis (NASH), fibrosis and cirrhosis. Of these stages, NASH is critical due to its role as the “turning point” in NAFLD development, with a greater percentage of patients with NASH progressing to end-stage liver diseases of unknown etiology.
Research frontiers
Currently, oxidative and endoplasmic reticulum stress, inflammatory factor release, and in particular, hepatic mitochondrial dysfunction are considered to be actively involved in NASH. Nevertheless, how mitochondrial dysfunction affects the initiation and progression of NASH remains unclear. Previous studies have shown that impaired adenosine triphosphate formation and increased generation of reactive oxygen species by a damaged respiratory chain may underlie the deterioration of mitochondrial dysfunction in NASH. With the development of proteomics, novel protein candidates have been revealed to participate in the pathogenesis and progression of NASH. Our group has reported unique protein expression patterns in a rat model of different stages of NAFLD and in a mouse model of ischemia/reperfusion injury and ischemic preconditioning. Recently, we also identified serum biomarkers enabling NAFLD diagnosis using a combination of surface-enhanced laser desorption/ionization-TOF-MS and bioinformatics.
Innovations and breakthroughs
The authors provide, for the first time, the liver mitochondrial proteome of the NASH rat model. Furthermore, Western blotting verified a decrease in Hadha and indicates its potential involvement in the progression of NASH.
Applications
This model proteome provides a protein reservoir for further investigation of the pathogenesis and progression of NASH.
Terminology
Hadha is the official acronym for “hydroxyacyl-CoA dehydrogenase/3-ketoacyl-CoA thiolase/enoyl-CoA hydratase, alpha subunit”. This gene provides instructions for making part of an enzyme complex called mitochondrial trifunctional protein, which is essential for fatty acid oxidation.
Peer review
This study provided a protein reservoir for in-depth investigation of the mechanism of NASH. Moreover, the down-regulation of Hadha in NASH liver and its sequence similarity to known uncoupling proteins implies its potential role in NASH via uncoupling activity. All of these results were encouraging but putative; more verification of the other proteins is required and the application of this study to humans is anticipated.
Footnotes
Supported by National Natural Science Foundation of China No. 81000169, No. 81100277, No. 81370008, and No. 81200284; the Excellent Young Investigator Foundation of the Health Bureau of Zhejiang Province No. 2010QNA011; the Excellent Young Investigator Natural Science Foundation of Zhejiang Province No. R2110159; the Project of Zhejiang Traditional Chinese Medicine Administration Bureau No. 2010ZA065; and the Fundamental Research Funds for the Central Universities No. 2013QNA702
P- Reviewers: Czaja MJ, Gallego-Duran R, Locatelli I S- Editor: Qi Y L- Editor: Webster JR E- Editor: Zhang DN
References
- 1.Cheung O, Sanyal AJ. Recent advances in nonalcoholic fatty liver disease. Curr Opin Gastroenterol. 2010;26:202–208. doi: 10.1097/MOG.0b013e328337b0c4. [DOI] [PubMed] [Google Scholar]
- 2.Kopec KL, Burns D. Nonalcoholic fatty liver disease: a review of the spectrum of disease, diagnosis, and therapy. Nutr Clin Pract. 2011;26:565–576. doi: 10.1177/0884533611419668. [DOI] [PubMed] [Google Scholar]
- 3.Ekstedt M, Franzén LE, Mathiesen UL, Thorelius L, Holmqvist M, Bodemar G, Kechagias S. Long-term follow-up of patients with NAFLD and elevated liver enzymes. Hepatology. 2006;44:865–873. doi: 10.1002/hep.21327. [DOI] [PubMed] [Google Scholar]
- 4.Bugianesi E, Leone N, Vanni E, Marchesini G, Brunello F, Carucci P, Musso A, De Paolis P, Capussotti L, Salizzoni M, et al. Expanding the natural history of nonalcoholic steatohepatitis: from cryptogenic cirrhosis to hepatocellular carcinoma. Gastroenterology. 2002;123:134–140. doi: 10.1053/gast.2002.34168. [DOI] [PubMed] [Google Scholar]
- 5.Day CP, James OF. Steatohepatitis: a tale of two “hits”? Gastroenterology. 1998;114:842–845. doi: 10.1016/s0016-5085(98)70599-2. [DOI] [PubMed] [Google Scholar]
- 6.Bohinc BN, Diehl AM. Mechanisms of disease progression in NASH: new paradigms. Clin Liver Dis. 2012;16:549–565. doi: 10.1016/j.cld.2012.05.002. [DOI] [PubMed] [Google Scholar]
- 7.Grattagliano I, de Bari O, Bernardo TC, Oliveira PJ, Wang DQ, Portincasa P. Role of mitochondria in nonalcoholic fatty liver disease--from origin to propagation. Clin Biochem. 2012;45:610–618. doi: 10.1016/j.clinbiochem.2012.03.024. [DOI] [PubMed] [Google Scholar]
- 8.Pessayre D, Fromenty B. NASH: a mitochondrial disease. J Hepatol. 2005;42:928–940. doi: 10.1016/j.jhep.2005.03.004. [DOI] [PubMed] [Google Scholar]
- 9.Begriche K, Igoudjil A, Pessayre D, Fromenty B. Mitochondrial dysfunction in NASH: causes, consequences and possible means to prevent it. Mitochondrion. 2006;6:1–28. doi: 10.1016/j.mito.2005.10.004. [DOI] [PubMed] [Google Scholar]
- 10.Hanash S. Disease proteomics. Nature. 2003;422:226–232. doi: 10.1038/nature01514. [DOI] [PubMed] [Google Scholar]
- 11.Zhang X, Yang J, Guo Y, Ye H, Yu C, Xu C, Xu L, Wu S, Sun W, Wei H, et al. Functional proteomic analysis of nonalcoholic fatty liver disease in rat models: enoyl-coenzyme a hydratase down-regulation exacerbates hepatic steatosis. Hepatology. 2010;51:1190–1199. doi: 10.1002/hep.23486. [DOI] [PubMed] [Google Scholar]
- 12.Xu C, Zhang X, Yu C, Lu G, Chen S, Xu L, Ding W, Shi Q, Li Y. Proteomic analysis of hepatic ischemia/reperfusion injury and ischemic preconditioning in mice revealed the protective role of ATP5β. Proteomics. 2009;9:409–419. doi: 10.1002/pmic.200800393. [DOI] [PubMed] [Google Scholar]
- 13.Yu C, Xu C, Xu L, Yu J, Miao M, Li Y. Serum proteomic analysis revealed diagnostic value of hemoglobin for nonalcoholic fatty liver disease. J Hepatol. 2012;56:241–247. doi: 10.1016/j.jhep.2011.05.027. [DOI] [PubMed] [Google Scholar]
- 14.Chen YP, Jin X, Xiang Z, Chen SH, Li YM. Circulating MicroRNAs as potential biomarkers for alcoholic steatohepatitis. Liver Int. 2013;33:1257–1265. doi: 10.1111/liv.12196. [DOI] [PubMed] [Google Scholar]
- 15.Jin X, Chen YP, Kong M, Zheng L, Yang YD, Li YM. Transition from hepatic steatosis to steatohepatitis: unique microRNA patterns and potential downstream functions and pathways. J Gastroenterol Hepatol. 2012;27:331–340. doi: 10.1111/j.1440-1746.2011.06864.x. [DOI] [PubMed] [Google Scholar]
- 16.Jin X, Ye YF, Chen SH, Yu CH, Liu J, Li YM. MicroRNA expression pattern in different stages of nonalcoholic fatty liver disease. Dig Liver Dis. 2009;41:289–297. doi: 10.1016/j.dld.2008.08.008. [DOI] [PubMed] [Google Scholar]
- 17.Larkin MA, Blackshields G, Brown NP, Chenna R, McGettigan PA, McWilliam H, Valentin F, Wallace IM, Wilm A, Lopez R, et al. Clustal W and Clustal X version 2.0. Bioinformatics. 2007;23:2947–2948. doi: 10.1093/bioinformatics/btm404. [DOI] [PubMed] [Google Scholar]
- 18.Baffy G. Uncoupling protein-2 and non-alcoholic fatty liver disease. Front Biosci. 2005;10:2082–2096. doi: 10.2741/1683. [DOI] [PubMed] [Google Scholar]
- 19.Christian BE, Spremulli LL. Mechanism of protein biosynthesis in mammalian mitochondria. Biochim Biophys Acta. 2012;1819:1035–1054. doi: 10.1016/j.bbagrm.2011.11.009. [DOI] [PMC free article] [PubMed] [Google Scholar]
- 20.Cowherd RB, Asmar MM, Alderman JM, Alderman EA, Garland AL, Busby WH, Bodnar WM, Rusyn I, Medoff BD, Tisch R, et al. Adiponectin lowers glucose production by increasing SOGA. Am J Pathol. 2010;177:1936–1945. doi: 10.2353/ajpath.2010.100363. [DOI] [PMC free article] [PubMed] [Google Scholar]
- 21.Chaurasia SS, Gupta P, Maiti PK, Kar A. Possible involvement of lipid peroxidation in the inhibition of type I iodothyronine 5’-monodeiodinase activity by lead in chicken liver. J Appl Toxicol. 2012;18:299–300. doi: 10.1002/(sici)1099-1263(199807/08)18:4<299::aid-jat493>3.0.co;2-j. [DOI] [PubMed] [Google Scholar]
- 22.Nomura F, Noda M, Miyake M, Nakai T. Long-term alcohol intake enhances ADP-ribosylation of the multifunctional enzyme, phosphoglucomutase, in rat liver. Hepatology. 1996;24:1246–1249. doi: 10.1053/jhep.1996.v24.pm0008903405. [DOI] [PubMed] [Google Scholar]
- 23.Xu J, Kulkarni SR, Li L, Slitt AL. UDP-glucuronosyltransferase expression in mouse liver is increased in obesity- and fasting-induced steatosis. Drug Metab Dispos. 2012;40:259–266. doi: 10.1124/dmd.111.039925. [DOI] [PMC free article] [PubMed] [Google Scholar]
- 24.Strickland KC, Krupenko NI, Dubard ME, Hu CJ, Tsybovsky Y, Krupenko SA. Enzymatic properties of ALDH1L2, a mitochondrial 10-formyltetrahydrofolate dehydrogenase. Chem Biol Interact. 2011;191:129–136. doi: 10.1016/j.cbi.2011.01.008. [DOI] [PMC free article] [PubMed] [Google Scholar]
- 25.Krupenko NI, Dubard ME, Strickland KC, Moxley KM, Oleinik NV, Krupenko SA. ALDH1L2 is the mitochondrial homolog of 10-formyltetrahydrofolate dehydrogenase. J Biol Chem. 2010;285:23056–23063. doi: 10.1074/jbc.M110.128843. [DOI] [PMC free article] [PubMed] [Google Scholar]
- 26.Tsutsumi T, Matsuda M, Aizaki H, Moriya K, Miyoshi H, Fujie H, Shintani Y, Yotsuyanagi H, Miyamura T, Suzuki T, et al. Proteomics analysis of mitochondrial proteins reveals overexpression of a mitochondrial protein chaperon, prohibitin, in cells expressing hepatitis C virus core protein. Hepatology. 2009;50:378–386. doi: 10.1002/hep.22998. [DOI] [PubMed] [Google Scholar]
- 27.Tanno S, Fukuda I, Saito Y, Ogawa K. Prohibitin expression is decreased in the regenerating liver but not in chemically induced hepatic tumors in rats. Jpn J Cancer Res. 1997;88:1155–1164. doi: 10.1111/j.1349-7006.1997.tb00344.x. [DOI] [PMC free article] [PubMed] [Google Scholar]
- 28.Sánchez-Quiles V, Santamaría E, Segura V, Sesma L, Prieto J, Corrales FJ. Prohibitin deficiency blocks proliferation and induces apoptosis in human hepatoma cells: molecular mechanisms and functional implications. Proteomics. 2010;10:1609–1620. doi: 10.1002/pmic.200900757. [DOI] [PubMed] [Google Scholar]
- 29.Crouser ED, Julian MW, Huff JE, Struck J, Cook CH. Carbamoyl phosphate synthase-1: a marker of mitochondrial damage and depletion in the liver during sepsis. Crit Care Med. 2006;34:2439–2446. doi: 10.1097/01.CCM.0000230240.02216.21. [DOI] [PubMed] [Google Scholar]
- 30.Banasik K, Justesen JM, Hornbak M, Krarup NT, Gjesing AP, Sandholt CH, Jensen TS, Grarup N, Andersson A, Jørgensen T, et al. Bioinformatics-driven identification and examination of candidate genes for non-alcoholic fatty liver disease. PLoS One. 2011;6:e16542. doi: 10.1371/journal.pone.0016542. [DOI] [PMC free article] [PubMed] [Google Scholar]
- 31.Jin X, Yang YD, Chen K, Lv ZY, Zheng L, Liu YP, Chen SH, Yu CH, Jiang XY, Zhang CY, et al. HDMCP uncouples yeast mitochondrial respiration and alleviates steatosis in L02 and hepG2 cells by decreasing ATP and H2O2 levels: a novel mechanism for NAFLD. J Hepatol. 2009;50:1019–1028. doi: 10.1016/j.jhep.2008.10.034. [DOI] [PubMed] [Google Scholar]
- 32.Cioffi F, Senese R, de Lange P, Goglia F, Lanni A, Lombardi A. Uncoupling proteins: a complex journey to function discovery. Biofactors. 2009;35:417–428. doi: 10.1002/biof.54. [DOI] [PubMed] [Google Scholar]
- 33.Kohjima M, Enjoji M, Higuchi N, Kato M, Kotoh K, Yoshimoto T, Fujino T, Yada M, Yada R, Harada N, et al. Re-evaluation of fatty acid metabolism-related gene expression in nonalcoholic fatty liver disease. Int J Mol Med. 2007;20:351–358. [PubMed] [Google Scholar]