Abstract
Sustained hypertension induces renovascular remodeling by altering extracellular matrix (ECM) components. Matrix metalloproteinases (MMPs) are Zn-dependent enzymes that regulate ECM turnover in concert with their inhibitors, tissue inhibitors of metalloproteinases, TIMPs. Increased MMP-2 & -9 have been implicated in hypertensive complications; however, the contribution of individual MMPs/TIMPs in renal remodeling has not been fully elucidated. The purpose of this study was to determine the effect of TIMP2 deficiency and thus MMP-2 on Ang-II induced renal remodeling. C57BL/6J (WT) and TIMP2 knockout mice were infused with Angiotensin-II (Ang-II) at 250 ng. kg-1. min-1 for 4 weeks. Blood pressure was measured weekly and end-point laser Doppler flowmetry was done to assess cortical blood flow. Immunohistochemical staining was performed for collagen and elastin analyses. The activity of MMP-9, and -2 was determined by Gelatin zymography. Ang-II induced similar elevation in mean blood pressure in TIMP2-/- and WT mice. In TIMP2-/- mice, Ang-II treatment was associated with a greater reduction in renal cortical blood flow and barium angiography demonstrated decreased vascular density compared to Ang-II treated WT mice. Peri-glomerular and vascular collagen deposition was increased and elastin content was decreased causing increased wall-to-lumen ratio in TIMP2-/- mice compared to WT mice receiving Ang-II. Ang-II increased the expression and activity of MMP-9 predominantly in TIMP2-/- mice than in WT mice. These results suggest that TIMP2 deficiency exacerbates renovascular remodeling in agonist induced hypertension by a mechanism which may, in part, be attributed to increased activity of MMP-9.
Keywords: Hypertension, Angiotensin-II, renovascular remodeling, TIMP2-/-, matrix metalloproteinases
INTRODUCTION
Hypertension is a recognized cause of chronic kidney disease and end-stage renal failure. Sustained hypertension induces vascular remodeling in both intra- and extrarenal vasculature characterized by hypertrophy, narrowing of the lumen and extensive modification of the extracellular matrix (ECM) components including collagens and elastin [1, 2].The renal resistance arteries in particular are vulnerable to inward remodeling and capillary rarefaction both of which contribute to altered vascular haemodynamics and impair renal function leading to target organ damage [3].
Angiotensin-II (Ang-II) is an active hormone of the renin-angiotensin system known to play an important role in the development of hypertension and contribute to the pathogenesis of renovascular and cardiac diseases in humans [4, 5].Ang-II mediates its action primarily through AT1 receptors which are widely expressed in the kidneys especially in the smooth muscle cells of the afferent and efferent arterioles [6]. In the vascular smooth muscle cells (VSMCs), Ang-II stimulates cellular hypertrophy [7], protein synthesis and activation of NADPH oxidase system to generate ROS [8]. In addition, a low dose combination of aldosterone with Ang-II has been reported to have synergistic effect on VSMCs proliferation [9].A major result of the vascular remodeling process is the development of vascular fibrosis, characterized by the accumulation of extra-cellular matrix material. Increased accumulation of collagen types I, III and IV have been reported in humans and spontaneously hypertensive rats in the resistance vessels, glomeruli and renal interstitium [10-12]. In addition, Ang-II alone has been shown to stimulate vascular smooth muscle cells to synthesize collagen via AT1 receptors [13].
Under normal conditions, ECM homeostasis is achieved by a balance between the enzymes matrix metalloproteinases (MMPs) which degrade ECM and their endogenous inhibitors known as tissue inhibitors of metalloproteinases (TIMPs). During hypertension, increased neurohumoral/hormonal activity produces excess reactive oxygen species which together with the activation of MMPs causes pronounced vasoconstriction of small resistance arteries which in turn may promote alterations in the ECM metabolism and migration of VSMCs leading to vascular remodeling [14].
MMP-2 and MMP-9 exhibit strong proteolytic activity against collagen in the vessel wall, basement membrane of glomeruli and interstitial tissues and also mediate elastin degradation [15, 16]. TIMP1 and TIMP2 are the main inhibitors of MMP-9 and MMP-2 respectively and increased expression of both TIMPs have been associated with glomerulosclerosis [17, 18]. Although TIMP2 inhibits MMP-2, it is also required for the activation of pro-MMP-2 which is mediated by membrane type 1 MMP, MT1-MMP [19]. In animals treated with Ang-II, increased gene expression of TIMP1 and TIMP2 in the kidney was associated with an increase in oxidative stress which in turn promoted collagen synthesis and decreased its breakdown thus favoring fibrosis [20]. Further, Ang-II treatment has been reported to cause dysregulation of MMP-2/TIMP2 resulting in overactivity of TIMP2 thereby, contributing to fibrosis in diabetic nephropathy [21]. Similar pro-fibrotic response was observed in human mesangial cells treated with Ang-II due to an imbalance of MMP-2/TIMP2 [22]. Taken together, these studies highlight the role of altered MMP/TIMP ratio in the pathogenesis of renal fibrosis.
Although there is mounting evidence for the role of MMP-2 and MMP-9 in several disease states involving various organs, the exact role of individual MMPs in renovascular remodeling is still far from clear. In a previous study, our lab demonstrated that increased activity of MMP-2 & -9 contributed significantly to renal cortical and medullary injury in spontaneously hypertensive rats [23]. Similarly, human studies have also reported positive correlation of elevated MMP-9 with systolic blood pressure and elevated MMP-2 and -10 in end stage renal disease [24]. Several studies show elevated levels of MMP-2, -9 and TIMP-1 in hypertension and cardiac remodeling [25]. A transgenic mouse model known to express MMP-2 specifically by the proximal tubular cells was shown to be sufficient enough to cause transition of tubular epithelium to mesenchyme resulting in atrophy, fibrosis and renal dysfunction [26, 27].
In this study, we sought to determine whether the suppression of MMP-2 would reduce renal fibrosis in angiotensin-II induced hypertension. We used TIMP2 knockout genetic mice which would confer no activation of pro-MMP-2. We report that, despite the lack of active MMP-2, Ang-II induces extensive renovascular remodeling which appears to be mediated by MMP-9 activation.
MATERIALS AND METHODS
Animals and groups
Male C57BL/6J (wild type, WT) and TIMP2-/- mice were purchased from Jackson Laboratory (Bar Harbor, ME) and used at age 70-110 days and weighed between 25-30 g. Animals were housed in separate cages in rooms regulated in temperature (24°C), light (12 h/d), and airflow. They were fed standard mice chow and given water ad libitum. Animal handling was performed in accordance with the guidelines of the animal care and use committee of the University of Louisville, School of Medicine and the Guide for the Care and Use of Laboratory Animals (Department of Health and Human Services, Publication No. NIH 86-23). The animals (n = 6/group) were allocated into 4 groups: Group I and II, WT mice receiving saline and Ang-II treatments respectively; and III and IV, TIMP2-/- mice receiving saline and Ang-II pumps.
Reagents
Angiotensin II, was purchased from Sigma-Aldrich (St. Louis, MO), alzet mini-osmotic pumps (model 1004) were purchased from Durect Corp. (Cupertino, CA). Rabbit polyclonal antibodies to MMP-2, -9 and GAPDH were from Millipore (Billerica, MA). Horseradish peroxidase-conjugated (HRP) anti-rabbit IgG antibody was from Santa Cruz Biotechnology (Santa Cruz, CA).
Osmotic pump insertion
Under intraperitoneal tribromoethanol anesthesia and sterile conditions, a dorsal midline incision was made and a subcutaneous pocket created in the right flank area. Miniosmotic pumps loaded with saline or Ang-II (75 uL) were inserted to deliver Ang-II at 250 ng . kg . -1 . min -1 for a period of 4 weeks.
Blood pressure measurement
Mean blood pressure was measured by non-invasive tail-cuff method in conscious animals using Coda High-throughput acquisition system (Kent Scientific, Torrington, CT). Animals were placed on a warming platform and allowed to acclimatize for 10 minutes before readings were obtained.
Measurement of renal cortical blood flow
After 4 weeks of Ang-II treatment, cortical blood flow was measured in the left kidney using Speckle Contrast Imager (Moor FLPI, Wilmington, DE) at room temperature. The camera was positioned approximately 15 cms from the dorsal surface of left kidney; settings for low-resolution/high-speed images included a display rate of 25 Hz, time constant of 1.0 s, and camera exposure time of 20 ms. The contrast images were processed to produce a color-coded live flux image and a flux units trace was also recorded for 2 min in all animals.
Barium angiography
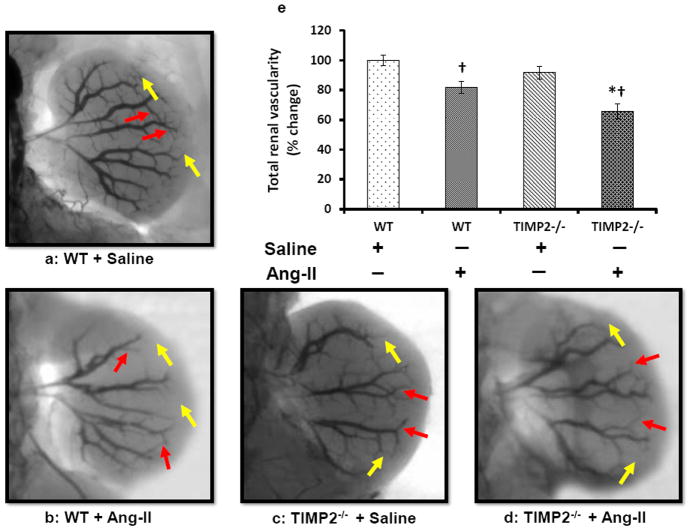
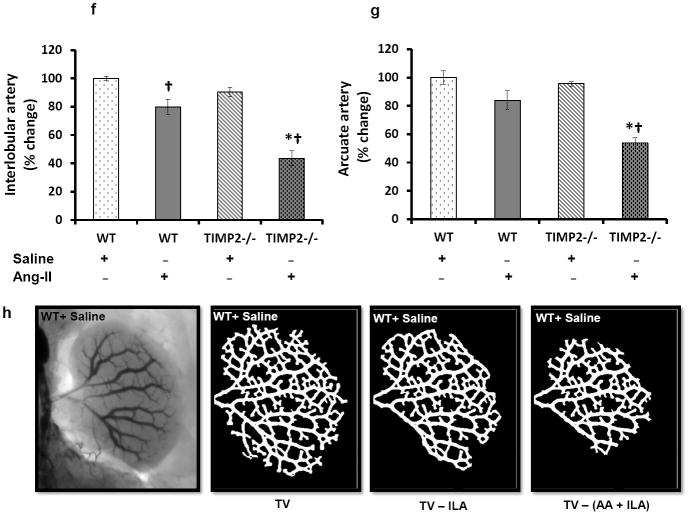
Renal vascular density was quantified by barium angiography. Infra-renal aorta was cannulated with PE10 (ID - 0.28mm, Franklin Lakes, NJ) and barium sulfate (0.1g/mL) was injected in retrograde fashion into the left kidney. Images were taken using Carestream Molecular Imaging In-vivo Multispectral system (Rochester, NY). Vascular density was quantified using Vessel Segmentation and Analysis (VesSeg) software tool (http://www.isip.uni-luebeck.de/index.php?id=150). First, the barium image was enhanced by conversion to gray scale and inverted to show vessels against a distinct background. This was followed by automatic segmentation avoiding any false positive errors. The percentage of white pixels (vessels) was calculated against the no. of pixels in the background by the program automatically to give the vascular percentage. First, the total vascularity (TV) was determined. The interlobular and arcuate artery percentages were determined by selective subtraction from the total vascularity. A representative illustration of the method is presented in figure 3h.
Figure 3. Ang-II treatment decreases vascular density.
(a-d) Around 0.6 mL of barium sulfate (0.1mg/mL) was infused in the infra renal aorta through a PE10 tube to visualize renal vascular architecture. The yellow arrows represent interlobular arteries and red arrows represent arcuate arteries. Bar diagram (e) represents the mean percent change ± SEM (n=6/group). Values were obtained after background subtraction and plotted using WT + saline as control. Bar diagram (f) represents the mean percentage change of interlobular artery against the background ± SEM. Bar diagram (g) represents mean percent change of arcuate artery against the background ± SEM. An example of image analysis technique (VesSeg software) using WT+ Saline image is shown in ‘(h)’. TV: Total vascularity; ILA: Interlobular artery; AA: Arcuate artery. *p < 0.05, vs. WT + Ang-II; †P < 0.05 vs. WT and TIMP2-/- given saline treatment.
Western Blotting
The kidney tissue homogenates were prepared using RIPA buffer (Boston BioProducts, Worcester, MA) which included 1 mM phenylmethanesulfonyl fluoride (PMSF), and 1% protease inhibitor cocktail (Sigma, St. Louis, MO). Lysates were sonicated, centrifuged at 12,000 g for 10 min at 4°C and the supernatant collected. Following protein estimation using Bradford protein assay kit (Bio-Rad, Hercules, CA), equal amounts of protein were separated on 10% Tris-base gels by electrophoresis and transferred onto polyvinylidene fluoride (PVDF) membrane. The membranes were blocked for 1 h with 5% nonfat dry milk and probed with appropriate antibodies overnight. After washing, they were incubated with respective HRP conjugated antibodies for two hours at room temperature and developed using chemiluminescence [Pierce ECL western blotting substrate (Thermo Scientific, Rockford, IL).
Gelatin Zymography
Kidney samples were minced in ice-cold extraction buffer (1:3 w/v) containing 10 mM/L cacodylic acid, 20 ZnCl, 1.5 NaN3, and 0.01% Triton X-100 (pH 5.0) and incubated overnight at 4°C with gentle agitation. The homogenate was centrifuged for 15 min at 1500 g and the supernatant collected. Protein concentration in the sample was measured using Bradford method, and 50 μg of the protein was electrophoretically resolved for each sample in 10% SDS-PAGE containing 0.1% gelatin as MMP substrate. Gels were washed in renaturing buffer with one change in between to remove SDS, rinsed in water, and incubated for at least 48 h in developing buffer at 37°C in a water bath with gentle shaking. Gels were stained with 0.5% Coomassie brilliant blue for 1 h at room temperature. MMP activity in the gel was detected as white bands against a dark blue background.
Collagen staining
Interstitial collagen deposition was measured using Picrosirius red stain kit (Polysciences, Warrington, PA) following manufacturer’s instructions. In brief, tissue sections 5 μm thick were deparaffinized, hydrated and incubated in picrosirius red solution (0.4% Direct Red 80 in saturated picric acid) for 110 min, followed by 0.01N HCl treatment for 2 min and dehydration. Three to five high power field (HPFs, X 200) images were captured and the collagen deposition was quantified using Image-Pro Plus 5 software (Media Cyberntetics, Rockville, MD) of the red-stained area in the renal cortex.
Elastin staining
Elastin fibers were stained using a commercially available kit (Chromaview® Elastic Stain Kit, Richard-Allan Scientific, Kalamazoo, MI) following manufacturer’s directions. Total elastin area was analyzed as described above for collagen, and data are expressed as total percent area of elastin fibers/area of vessel wall.
Histology of wall-to-lumen ratio
To calculate wall-to-lumen ratio, 5 μm thick sections stained with picrosirius red and elastin were used. Three to five high power field images (× 200) were captured using Olympus light microscope (Tokyo, Japan) equipped with a camera. The images were then analyzed using ImageJ software (National Institute of Health (NIH)). First, the images were converted to 8-bit format. Then the number of pixels which correspond to a known length was determined using ImageJ tool. This scale was set for all further measurements. Using the straight line selection tool we measured the internal diameter (lumen) in five different diameter planes transecting at the center of each vessel and the average value was taken. The outer diameter (wall thickness) was similarly measured at 5 different points and the average value was recorded.
Statistical Analysis
Values are given as means ± SEM for each group. Two-way ANOVA was performed to identify difference between the groups followed by pairwise comparisons using student’s‘t’ test. Mann-Whitney rank sum test was performed for ordinal data. A p value < 0.05 was considered significant.
RESULTS
Angiotensin-II induced higher mean blood pressure in TIMP2-/- mice
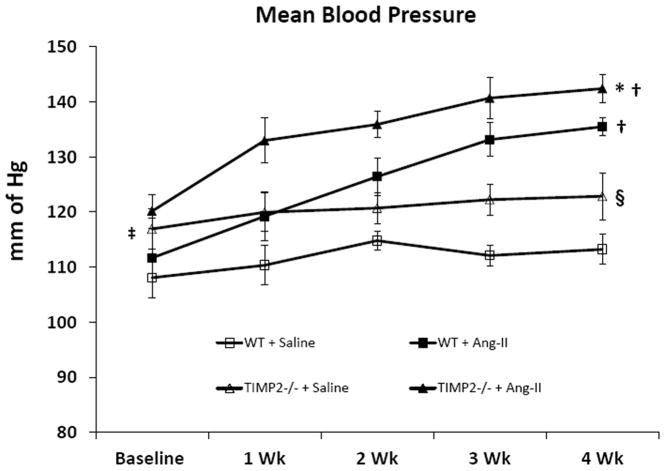
The baseline mean blood pressure in saline treated WT mice was lower than TIMP2-/- mice receiving similar treatment (Figure 1); however, there was no difference in the baseline blood pressure in WT and TIMP2-/- mice receiving Ang-II treatment. After 4 weeks of Ang-II treatment, mean blood pressure increased significantly and was of similar magnitude in WT and TIMP2-/- mice compared to their respective saline treated controls (Figure 1). Interestingly, the mean blood pressure difference between Ang-II treated WT and TIMP2-/- mice was also significant (Figure 1).
Figure 1. TIMP2-/- mice are more susceptible to Ang-II-induced hypertension than WT.
Mean arterial blood pressure was measured by using the tail cuff method as described in Materials and Methods section. Values are presented as mean ± SEM (n=6/group). *p < 0.05 vs. WT + Ang-II; †p < 0.05 vs. WT + saline and TIMP2-/- + saline at 4 weeks; ‡p < 0.05 vs. WT + saline at baseline; § p<0.05 vs. WT + saline at 4 weeks.
Renal cortical blood flow is decreased in Ang-II induced hypertension
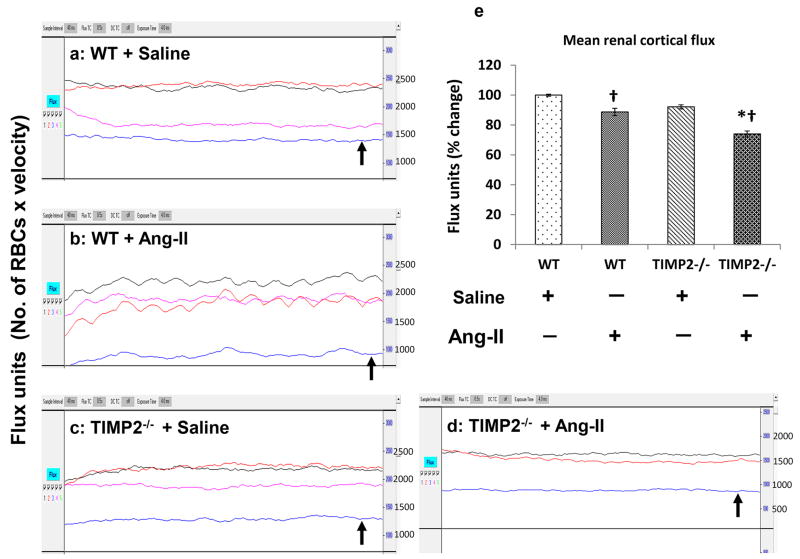
The laser probe was focused midway between the hilum and outer edge of the kidney and blood flow was recorded for a period of 2 minutes. Figure 2 represents the flux traces and mean renal cortical flux units as percent change. There was no difference in the renal cortical flux (No. of RBCs × velocity) between the saline treated WT and TIMP2-/- mice. Ang-II treatment significantly reduced the cortical flux in WT and TIMP2-/- mice compared to their respective saline treated controls (Figure 2e). However, the effect of Ang-II on TIMP2-/- mice caused a greater reduction in the flux units than in WT mice (Figure 2e) receiving similar treatment.
Figure 2. Renal cortical blood flow decreases in TIMP2-/- mice in Ang-II-induced hypertension.
Figure shows Laser Doppler flowmetry (flux units: No. of RBCs × velocity) in aorta (Black trace), renal artery (Red trace), renal vein (purple trace) and renal cortex (blue trace). (a) & (c) represent WT and TIMP2-/- mice respectively treated with saline, and (b) & (d) represent Ang-II treated WT and TIMP2-/- mice respectively. Bar graph (e) represent the mean flux units (No. of RBC × velocity) as percentage change in the renal cortex ± SEM (n=6/group). Values were plotted using WT + saline as control. *p < 0.05 vs. WT + Ang-II; †p < 0.05 vs. WT and TIMP2-/- with saline treatment.
Ang-II induced hypertension reduces renal vascular density
Barium sulfate angiography was performed to evaluate renal vasculature. WT mice treated with saline had well preserved renal architecture (Figures 3a & e) whereas, TIMP2-/- mice receiving similar treatment showed a non-significant decrease in interlobular branches (yellow arrows, Figure 3c & e). Following Ang-II treatment, in the WT mice, there was a significant reduction in the interlobular branches (Figure 3b and f, yellow arrows) and a non-significant decrease of arcuate arteries (Figure 3g) compared to its saline control, whereas, the segmental and interlobar branches were preserved (Figure 3a, b and e). A similar but greater reduction in the cortical branches ((interlobular and arcuate), yellow and red arrows respectively) was observed in the TIMP2-/- mice after Ang-II treatment compared to its saline treated control (Figure 3f and g). The effect of Ang-II infusion on TIMP2-/- mice resulted in greater reduction of arcuate (red arrows) and interlobular branches (yellows arrows) than that observed in WT mice infused with Ang-II (Figure 3b & d).
Collagen deposition is increased in TIMP2-/- mice
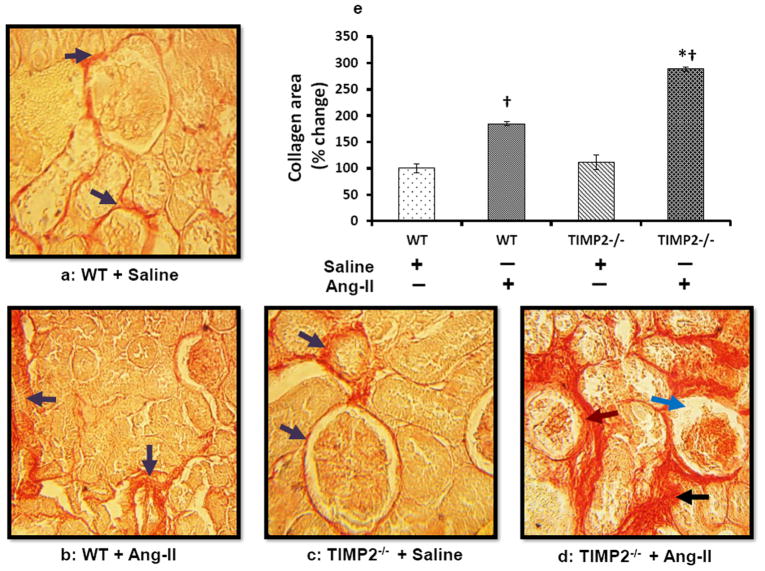
Picrosirius red stain was performed to quantify collagen as a measure of renovascular fibrosis. WT and TIMP2-/- mice treated with saline showed a thin layer of collagen surrounding the glomerulus and in the interstitium and there was no difference between these groups (Figure 4a and c, purple arrows). Ang-II treatment increased collagen accumulation in WT and TIMP2-/- mice compared to their saline controls but to a greater degree in TIMP2-/- mice than in WT (Figure 4d and b). In the TIMP2-/- mice receiving Ang-II, collagen was more pronounced in the interstitium and perivascular region than in the glomeruli (Figure 4d, black arrow) whereas, in WT mice receiving Ang-II, collagen deposition occurred more in the perivascular region followed by the glomeruli than in the interstitium (Figure 4b, purple arrows). In addition, TIMP2-/- pathology showed capillary tuft retraction (blue arrow) and Bowman’s space occupied by collagenous material (Figure 4d, brown arrow). A comparison of collagen in the kidney tissue of all the groups is depicted in figure 4e.
Figure 4. TIMP2 deficiency (TIMP2-/-) increases collagen deposition in Ang-II-induced hypertension renal vasculature.
Representative photomicrographs of collagen staining with picrosirius red. (a) Baseline collagen in the renal cortical tissue (purple arrows). (b) Ang-II increased collagen deposition in the interstitium and basement membrane of WT mice (WT + Ang-II); in addition, some of the glomeruli show atrophy. (c) TIMP2-/- mice with saline (TIMP2-/- + Saline) showing baseline collagen (purple arrows). (d) Ang-II treated TIMP2-/- mice show extensive deposition of collagen in the interstitium, basement membrane and both the glomeruli and tubules show atrophy compared to its saline control (c). Bar diagram (e) shows total collagen area against the background presented as mean percent change ± SEM (n=6/group) using WT + Saline as control. *p = 0.008 vs. WT + Ang-II; †p =0.01 vs. WT + saline; †p = 0.001 vs. TIMP2-/- + saline. Original image, × 25 magnification.
TIMP2-/- mice undergo greater elastin degradation in resistance arteries than WT mice
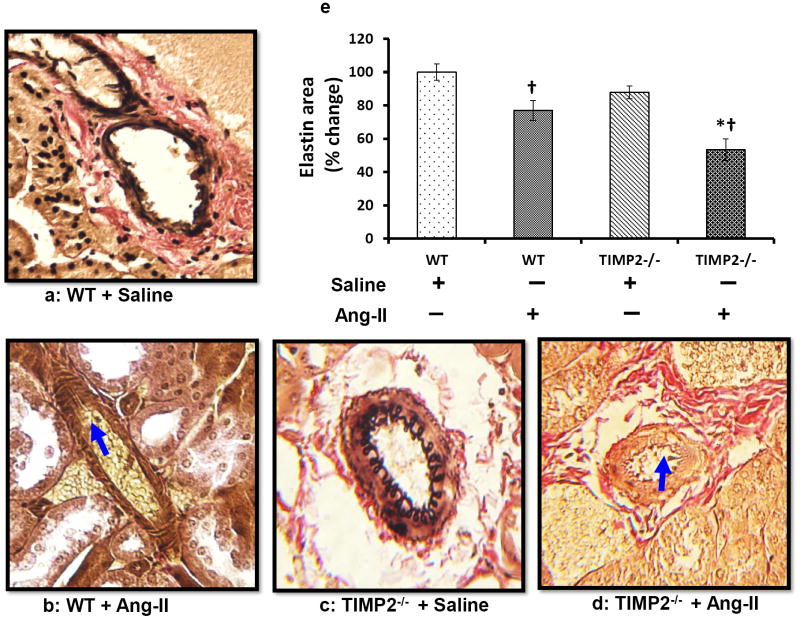
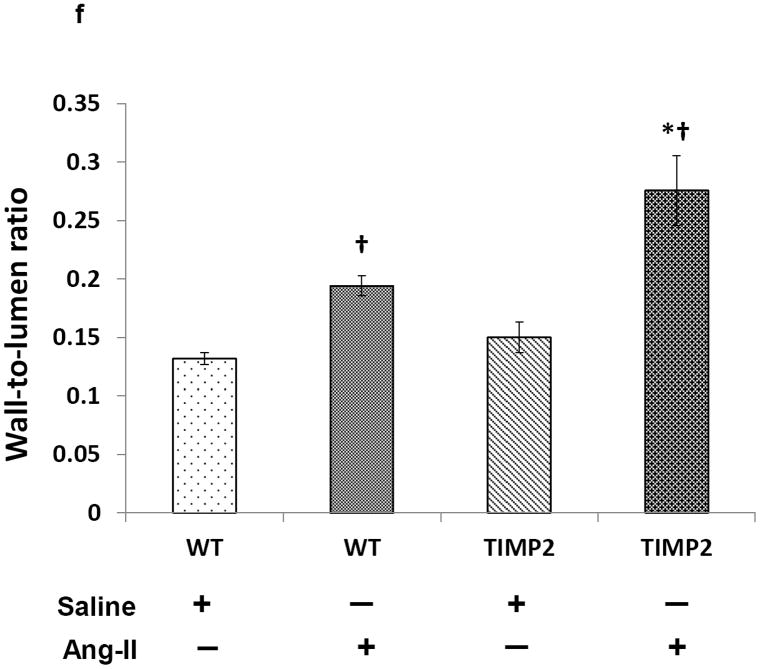
To visualize elastin changes in the renal resistance arteries following Ang-II treatment, we stained kidney sections with Verhoeff’s Van Gieson stain. Saline treated WT and TIMP2-/- mice exhibited similar elastin content (Figure 5a, c & e). Following Ang-II infusion, although elastin content decreased significantly in both WT (Figure 5b) and TIMP2-/- mice (Figure 5d) compared to their respective saline treated controls (Figure 5a & c), the decrease was greater in TIMP2-/- mice compared to WT mice.This reduction was characterized by thinning of the internal elastic lamellae along with rupture and disorganization in the media (Figure 5d, blue arrow) accompanied by luminal narrowing. The wall thickness-to-lumen ratio was also greater in both TIMP2-/- and WT mice after Ang-II compared to their respective saline controls (Figure 5f). This ratio was higher in TIMP2-/- mice treated with Ang-II compared to WT mice receiving similar treatment (Figure 5d & b).
Figure 5. In Ang-II-induced renal remodeling, elastin degradation and wall-to-lumen ratio is increased in TIMP2-/- mice.
Kidney sections were stained with Van Gieson’s stain and dark grey/black color depicts elastin (a-d). Bar diagram (e) represents the total elastin area against the background presented as mean percent change ± SEM (n=6/group) using WT + Saline as control. Ang-II, angiotensin; TIMP, tissue inhibitor of metalloproteinase; WT, wild-type. *p < 0.05 vs. WT + Ang-II; †p < 0.05 vs. WT + saline; and †p < 0.009 vs. TIMP2-/- + saline. Bar diagram (f) represents the wall- to-lumen ratio of interlobular arteries in the cortex, *p < 0.05 vs. WT + Ang-II; †p = 0.004 vs. WT + saline, †p = 0.01 vs.TIMP2-/- + saline. Original image, × 20 magnification.
Western blot analysis of matrix metalloproteinase-2 and matrix metalloproteinase-9 in kidney
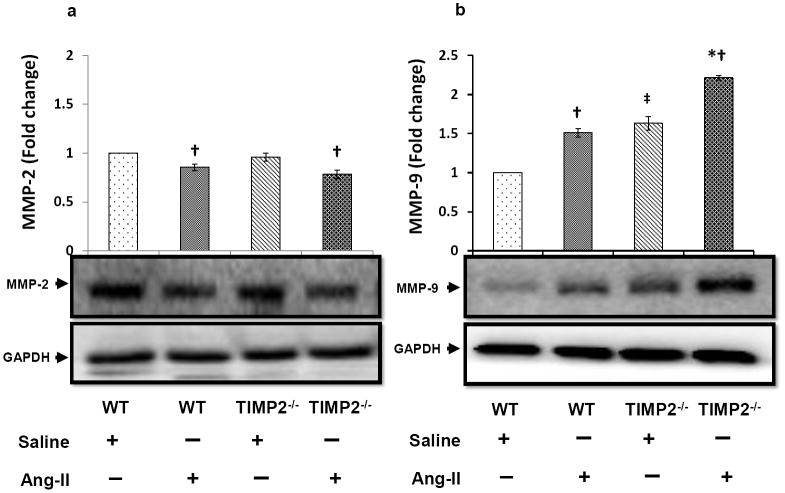
There was no significant difference in the expression of MMP-2 between WT and TIMP2-/- mice treated with saline (Figure 6a). This similarity in TIMP2-/- mice may reflect the pro-form of MMP-2. Upon Ang-II infusion, MMP-2 expression decreased similarly in WT and TIMP2-/- mice compared to their respective saline control groups, however, there was no difference in its expression in WT and TIMP2-/- mice treated with Ang-II (Figure 6a).
Figure 6. MMP-2 is down regulated, whereas MMP-9 is up regulated in Ang-II induced hypertension.
Tissue extracts were prepared and analyzed for immunoblotting to determine expression of matrix metalloproteinase-2 and -9 (MMP-2 and -9) in the kidney as described in the Materials and Methods. Fifty microgram of protein from each group was separated by SDS-PAGE and immunoblotted using rabbit anti-MMP-2 (a) and anti-MMP-9 (b) antibody. GAPDH was used as a loading control. The pixel densities of the bands were quantified using ImageJ software (National Institute of Health (NIH)) and presented as fold change in the bar diagrams. Data represents normalized mean expression ± SEM (n=6/group); *p < 0.05 vs. WT + Ang-II; †p < 0.05 vs. WT and TIMP2-/- given saline treatment; ‡p < 0.05 vs. WT + Saline.
In saline treated mice, baseline MMP-9 expression was lower in WT group than in TIMP2-/- mice (Figure 6b). The expression was significantly elevated following Ang-II treatment compared to saline treatment in WT and TIMP2-/- mice. The observed increase in MMP-9 expression in the Ang-II treated TIMP2-/- mice were higher than the levels in WT mice receiving similar treatment (Figure 6b).
In Ang-II-induced hypertension, MMP-9 but not MMP-2 activity is increased in TIMP2-/- mice
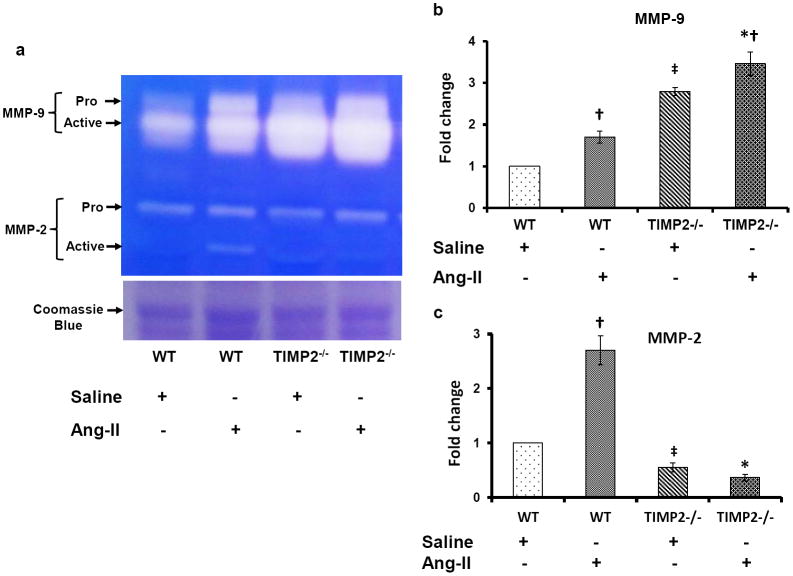
We measured both MMP-2 and MMP-9 activities in renal tissue samples using gelatin zymography technique as described in the Materials and Methods. Results as shown in figure 7 indicated that pro- and active forms of MMP-9 were significantly higher in TIMP2-/- mice compared to WT mice infused with saline alone (Figure 7a & b). The activity of MMP-9 further increased following Ang-II treatment in WT and TIMP2-/- mice compared to its saline controls (Figure 7a & b). There was greater increase in its activity in TIMP2-/- mice than in WT mice treated with Ang-II (Figures 7a & b).
Figure 7. Differential activity of MMP-2 and -9 in renal tissue.
(a) In gel gelatin zymography showing MMP-2 and -9 activities in the protein extracted from the kidney tissue. Zymography was performed using 0.1% gelatin gel as described in the Materials and Methods (n=6/group). Protein ran in an identical gel without gelatin and stained with Coomassie blue to serve as loading control. Bar diagram (b) represent fold changes of MMP-9; *p < 0.05 vs. WT + Ang-II; †p < 0.05 vs. TIMP2-/- and WT with saline treatment; ‡p < 0.05 vs. WT + Saline treatment. Bar diagram (c) represents fold changes for MMP-2. *p < 0.05 vs. WT + Ang-II; †, ‡ p < 0.05 vs. WT with saline treatment.
The activity of MMP-2 was low in saline treated WT and even lower in TIMP2-/- mice (Figure 7a). In Ang-II treated WT mice, although pro-MMP-2 did not change, the active form of MMP-2 was significantly increased suggesting increased activity (Figures (7a & c). No change was observed in TIMP2-/- mice treated with Ang-II compared to saline alone.
DISCUSSION
In this report, we demonstrate that renovascular remodeling in Ang-II induced hypertension is worsened with TIMP2 deficiency. In the absence of Ang-II, mice deficient in TIMP2 have an altered phenotype in baseline blood pressure and MMP-9 activity compared to WT mice and following Ang-II treatment these changes are exacerbated. Although MMP-2 activation is suppressed in the absence of TIMP2, ECM in the renal vasculature and interstitium undergo maladaptive changes. The prominent findings were, increased deposition of collagen with extensive disruption of elastin in the arcuate and interlobular branches resulting in increased wall-to-lumen ratio and thus reduction in the regional blood flow. The adverse effects appear to be mediated by increased activity of MMP-9.
Renovascular fibrosis is central to the pathogenesis of hypertensive nephrosclerosis. Increasing evidence points to abnormal ECM turnover in this process due to an imbalance in MMPs/TIMPs [1, 28]. In this regard, MMP-2 & -9 are two Zn-dependent endopeptidases that have been extensively studied. MMPs are synthesized as pre-proenzymes and secreted as proenzymes. MMP-2 possesses a hemopexin domain which binds to the non-inhibitory C-terminal domain of TIMP-2. In the presence of MT1-MMP (MMP-14) which is located on the cell surface, a ternary complex (proMMP-2, TIMP-2 and MT1-MMP) is formed leading to the activation of MMP-2. [17, 29] The presence of MT1-MMP is vital to this activation. The mechanism of TIMP mediated inhibition involves the N-terminal domain which binds to the catalytic-site of the MMPs where a cysteine residue chelates the active zinc site in the MMP with a N-terminal amino and carbonyl group. [30, 31] In general, the requirement for MMP activation or inhibition is aimed at maintaining homeostasis in the matrix. However, studies have shown conflicting data from both human and animal studies regarding the levels and activities of these enzymes in hypertension [32] and renal diseases [33]. Elevated levels of MMP-9 were reported in the majority [34-37] and decreased levels in some [38, 39]. Similar variations were observed with either high levels of MMP-2 [40, 41] or low levels in others [39]. The exact mechanisms and the interplay of factors in these pathologies are still unclear and remain to be elucidated. In this study, we used a TIMP2-/- genetic model because the lack of TIMP-2 will suppress or prevent MMP-2 activation.
Our results demonstrated that Ang-II at low dose produced significant elevation of mean blood pressure in WT and TIMP2-/- mice with similar magnitude. However, TIMP2-/- mice underwent greater renovascular remodeling than WT mice in the other parameters studied (Fig. 2 - 5). This is an important finding because it suggests 1) that TIMP2-/- mice are more susceptible to modest changes in mean blood pressure, 2) the change in the level of hypertension may not reflect the degree of renal pathology which may show phenotypic variations across strains.
It is known that infusion of Ang-II while increasing blood pressure reduces local blood flow [42]. To investigate whether chronic Ang-II infusion altered regional blood flow to the kidney, we used laser Doppler flowmetry to measure the flow across renal cortex. An advantage of this technique is that it allows the measurement of twodimensional real-time changes in tissue perfusion. In the animals treated with saline alone, there was a non-significant decrease in the flux trace in TIMP2-/- mice. After 4 weeks of Ang-II treatment, the flux decrease was greater in TIMP2-/- receiving Ang-II mice compared WT mice receiving similar treatment. This suggested a significant difference in the vascular sensitivity between WT and TIMP2-/- mice to Ang-II treatment.
To further determine whether this was associated with anatomical changes in the renal vasculature, we performed barium angiography. Ang-II is a powerful vasoconstrictor which has been shown to selectively reduce cortical blood flow without affecting the papillary perfusion [43]. In the Ang-II treated groups, we found a significant reduction in the distal branches of the vascular tree especially the arcuate and interlobular arteries in TIMP2-/- mice. It is possible that this may in part be due to increased resistance in the pre-terminal branches resulting in decreased flow to the distal end causing these vessels to collapse.
Some studies have examined the role of ECM remodeling in renal vessels [20, 44, 45]. In one study, chronic infusion of Ang-II resulted in increased media to lumen ratio in the arcuate and interlobular branches indicating structural changes [46]. In another report, Tanus-Santos et al measured MMPs over time in two-kidney, one-clip model of hypertension [47]. They found that increased levels and activity of MMP-2 & -14 was associated with increased collagen and elastin deposition in early phases of hypertension. When Ang-II was infused at 200 ng/kg/min to young rats, it increased the levels, expression and activity of MMP-2 along with excess deposition of collagen [48]. In the face of these reports which indicate an important role of MMP-2 in ECM remodeling, one would expect a reduction in adverse effects in the absence or decrease of MMP-2. However, we found that in TIMP2-/- mice collagen content was increased significantly following Ang-II treatment which was also associated with elevated elastin disruption and loss when compared to WT mice suggesting vascular rigidity. This could possibly be due to discrepancy in collagen and elastin turnover between MMP-2 & -9 where MMP-9 may be more elastinolytic.
Previously, we demonstrated that increased levels of MMP-2 & -9 in the renal cortex and increased MMP-9 & -7 in the medulla contributed to glomerular injury and medullary fibrosis in spontaneously hypertensive rats [23]. Although MMP-2 & -9 are proteolytic, their substrate specificity is distinct. MMP-2 degrades type IV collagen in the basement membrane [26] and MMP-9 is more active against type IV and V collagens [49]. In addition, both MMPs are known to possess elastolytic properties [15, 16]. Since collagen and elastin are the major components of the vessel wall, a decrease in the MMP-2 due to TIMP2 deficiency may contribute to renal pathology. In the present study, a lack of active MMP-2 in TIMP2-/- mice was associated with a robust elevation of MMP-9 which was sufficient to increase collagen accumulation and elastin breakdown to induce adverse renovascular remodeling in agonist induced hypertension. We think this could be a compensatory response where MMP-9 becomes predominant in the absence of MMP-2. Corresponding to increase of MMP-9 expression, the activity of MMP-9 was also greater in TIMP2-/- mice. This may have contributed to the loss of elastic compliance in the vascular bed in our study resulting in vascular resistance and hypertension. This is not surprising. Indeed, earlier studies have demonstrated that increased MMP-9, -2 and other serum elastases are involved in arterial remodeling associated with vessel stiffness and development of isolated systolic hypertension [36]. In the same study, although MMP-2 was also increased, MMP-9 correlated more significantly to the vascular changes. This supports our findings further strengthening the involvement of MMP-9 in remodeling.
Limitations of the study
The study design focused on gelatinases, MMP-2 & -9 as they are the main enzymes involved in ECM turnover and without the use of their inhibitors/antagonists it is difficult to rule out the involvement of other MMPs/TIMPs in renal remodeling. Second, although the tail cuff method for blood pressure measurement was reliable and consistent a better method would have been to use radio telemetry.
Conclusion
In conclusion, this study demonstrates an important role of TIMP2 in Ang-II induced renovascular remodeling. Deficiency of TIMP2 and thus MMP-2 appears to worsen the injury which, in part, appears to be due to a compensatory increase in MMP-9 activation. Hence, TIMP2 therapy could potentially protect the kidney from MMP-9 induced damage by preventing the structural derangements associated with hypertension.
Acknowledgments
This study was supported, in part, by NIH grant HL-104103 (to Dr. U Sen) and HL-74185 (to Dr. SC Tyagi)
Footnotes
Conflict of interest
The authors acknowledge that they do not have financial conflict of interest.
References
- 1.Intengan HD, Schiffrin EL. Vascular remodeling in hypertension: roles of apoptosis, inflammation, and fibrosis. Hypertension. 2001;38(3 Pt 2):581–7. doi: 10.1161/hy09t1.096249. [DOI] [PubMed] [Google Scholar]
- 2.Galis ZS, Khatri JJ. Matrix metalloproteinases in vascular remodeling and atherogenesis: the good, the bad, and the ugly. Circulation research. 2002;90(3):251–62. [PubMed] [Google Scholar]
- 3.Feihl F, Liaudet L, Waeber B. The macrocirculation and microcirculation of hypertension. Curr Hypertens Rep. 2009;11(3):182–9. doi: 10.1007/s11906-009-0033-6. [DOI] [PubMed] [Google Scholar]
- 4.Kim S, Iwao H. Molecular and cellular mechanisms of angiotensin II-mediated cardiovascular and renal diseases. Pharmacological reviews. 2000;52(1):11–34. [PubMed] [Google Scholar]
- 5.Wolf G. Angiotensin II is involved in the progression of renal disease: importance of non-hemodynamic mechanisms. Nephrologie. 1998;19(7):451–6. [PubMed] [Google Scholar]
- 6.Ponnuchamy B, Khalil RA. Cellular mediators of renal vascular dysfunction in hypertension. American journal of physiology Regulatory, integrative and comparative physiology. 2009;296(4):R1001–18. doi: 10.1152/ajpregu.90960.2008. [DOI] [PMC free article] [PubMed] [Google Scholar]
- 7.Geisterfer AA, Peach MJ, Owens GK. Angiotensin II induces hypertrophy, not hyperplasia, of cultured rat aortic smooth muscle cells. Circulation research. 1988;62(4):749–56. doi: 10.1161/01.res.62.4.749. [DOI] [PubMed] [Google Scholar]
- 8.Griendling KK, Minieri CA, Ollerenshaw JD, Alexander RW. Angiotensin II stimulates NADH and NADPH oxidase activity in cultured vascular smooth muscle cells. Circulation research. 1994;74(6):1141–8. doi: 10.1161/01.res.74.6.1141. [DOI] [PubMed] [Google Scholar]
- 9.Min LJ, Mogi M, Li JM, Iwanami J, Iwai M, Horiuchi M. Aldosterone and angiotensin II synergistically induce mitogenic response in vascular smooth muscle cells. Circulation research. 2005;97(5):434–42. doi: 10.1161/01.RES.0000180753.63183.95. [DOI] [PubMed] [Google Scholar]
- 10.Kim S, Ohta K, Hamaguchi A, Omura T, Yukimura T, Miura K, et al. Contribution of renal angiotensin II type I receptor to gene expressions in hypertension-induced renal injury. Kidney Int. 1994;46(5):1346–58. doi: 10.1038/ki.1994.404. [DOI] [PubMed] [Google Scholar]
- 11.Kim S, Ohta K, Hamaguchi A, Omura T, Yukimura T, Miura K, et al. Role of angiotensin II in renal injury of deoxycorticosterone acetate-salt hypertensive rats. Hypertension. 1994;24(2):195–204. doi: 10.1161/01.hyp.24.2.195. [DOI] [PubMed] [Google Scholar]
- 12.Yoshioka K, Tohda M, Takemura T, Akano N, Matsubara K, Ooshima A, et al. Distribution of type I collagen in human kidney diseases in comparison with type III collagen. The Journal of pathology. 1990;162(2):141–8. doi: 10.1002/path.1711620207. [DOI] [PubMed] [Google Scholar]
- 13.Ford CM, Li S, Pickering JG. Angiotensin II stimulates collagen synthesis in human vascular smooth muscle cells. Involvement of the AT(1) receptor, transforming growth factor-beta, and tyrosine phosphorylation. Arteriosclerosis, thrombosis, and vascular biology. 1999;19(8):1843–51. doi: 10.1161/01.atv.19.8.1843. [DOI] [PubMed] [Google Scholar]
- 14.Martinez-Lemus LA, Galinanes EL. Matrix metalloproteinases and small artery remodeling. Drug Discov Today Dis Models. 2011;8(1):21–8. doi: 10.1016/j.ddmod.2011.06.002. [DOI] [PMC free article] [PubMed] [Google Scholar]
- 15.Arribas SM, Hinek A, Gonzalez MC. Elastic fibres and vascular structure in hypertension. Pharmacol Ther. 2006;111(3):771–91. doi: 10.1016/j.pharmthera.2005.12.003. [DOI] [PubMed] [Google Scholar]
- 16.Jacob MP. Extracellular matrix remodeling and matrix metalloproteinases in the vascular wall during aging and in pathological conditions. Biomed Pharmacother. 2003;57(5-6):195–202. doi: 10.1016/s0753-3322(03)00065-9. [DOI] [PubMed] [Google Scholar]
- 17.Nagase H, Visse R, Murphy G. Structure and function of matrix metalloproteinases and TIMPs. Cardiovascular research. 2006;69(3):562–73. doi: 10.1016/j.cardiores.2005.12.002. [DOI] [PubMed] [Google Scholar]
- 18.Carome MA, Striker LJ, Peten EP, Moore J, Yang CW, Stetler-Stevenson WG, et al. Human glomeruli express TIMP-1 mRNA and TIMP-2 protein and mRNA. Am J Physiol. 1993;264(6 Pt 2):F923–9. doi: 10.1152/ajprenal.1993.264.6.F923. [DOI] [PubMed] [Google Scholar]
- 19.Hobeika MJ, Thompson RW, Muhs BE, Brooks PC, Gagne PJ. Matrix metalloproteinases in peripheral vascular disease. J Vasc Surg. 2007;45(4):849–57. doi: 10.1016/j.jvs.2006.09.066. [DOI] [PubMed] [Google Scholar]
- 20.Zhao W, Chen SS, Chen Y, Ahokas RA, Sun Y. Kidney fibrosis in hypertensive rats: role of oxidative stress. American journal of nephrology. 2008;28(4):548–54. doi: 10.1159/000115289. [DOI] [PMC free article] [PubMed] [Google Scholar]
- 21.Han SY, Jee YH, Han KH, Kang YS, Kim HK, Han JY, et al. An imbalance between matrix metalloproteinase-2 and tissue inhibitor of matrix metalloproteinase-2 contributes to the development of early diabetic nephropathy. Nephrology, dialysis, transplantation : official publication of the European Dialysis and Transplant Association - European Renal Association. 2006;21(9):2406–16. doi: 10.1093/ndt/gfl238. [DOI] [PubMed] [Google Scholar]
- 22.Solini A, Rossi C, Santini E, Madec S, Salvati A, Ferrannini E. Angiotensin-II and rosuvastatin influence matrix remodeling in human mesangial cells via metalloproteinase modulation. J Hypertens. 2011;29(10):1930–9. doi: 10.1097/HJH.0b013e32834abceb. [DOI] [PubMed] [Google Scholar]
- 23.Camp TM, Smiley LM, Hayden MR, Tyagi SC. Mechanism of matrix accumulation and glomerulosclerosis in spontaneously hypertensive rats. J Hypertens. 2003;21(9):1719–27. doi: 10.1097/00004872-200309000-00022. [DOI] [PubMed] [Google Scholar]
- 24.Friese RS, Rao F, Khandrika S, Thomas B, Ziegler MG, Schmid-Schonbein GW, et al. Matrix metalloproteinases: discrete elevations in essential hypertension and hypertensive end-stage renal disease. Clin Exp Hypertens. 2009;31(7):521–33. doi: 10.3109/10641960802668730. [DOI] [PMC free article] [PubMed] [Google Scholar]
- 25.Marchesi C, Dentali F, Nicolini E, Maresca AM, Tayebjee MH, Franz M, et al. Plasma levels of matrix metalloproteinases and their inhibitors in hypertension: a systematic review and meta-analysis. J Hypertens. 2012;30(1):3–16. doi: 10.1097/HJH.0b013e32834d249a. [DOI] [PubMed] [Google Scholar]
- 26.Cheng S, Pollock AS, Mahimkar R, Olson JL, Lovett DH. Matrix metalloproteinase 2 and basement membrane integrity: a unifying mechanism for progressive renal injury. FASEB journal : official publication of the Federation of American Societies for Experimental Biology. 2006;20(11):1898–900. doi: 10.1096/fj.06-5898fje. [DOI] [PubMed] [Google Scholar]
- 27.Burns WC, Velkoska E, Dean R, Burrell LM, Thomas MC. Angiotensin II mediates epithelial-to-mesenchymal transformation in tubular cells by ANG 1-7/MAS-1-dependent pathways. American journal of physiology Renal physiology. 2010;299(3):F 585–93. doi: 10.1152/ajprenal.00538.2009. [DOI] [PubMed] [Google Scholar]
- 28.Briones AM, Arribas SM, Salaices M. Role of extracellular matrix in vascular remodeling of hypertension. Curr Opin Nephrol Hypertens. 2010;19(2):187–94. doi: 10.1097/MNH.0b013e328335eec9. [DOI] [PubMed] [Google Scholar]
- 29.Bernardo MM, Fridman R. TIMP-2 (tissue inhibitor of metalloproteinase-2) regulates MMP-2 (matrix metalloproteinase-2) activity in the extracellular environment after pro-MMP-2 activation by MT1 (membrane type 1)-MMP. The Biochemical journal. 2003;374(Pt 3):739–45. doi: 10.1042/BJ20030557. [DOI] [PMC free article] [PubMed] [Google Scholar]
- 30.Fernandez-Catalan C, Bode W, Huber R, Turk D, Calvete JJ, Lichte A, et al. Crystal structure of the complex formed by the membrane type 1-matrix metalloproteinase with the tissue inhibitor of metalloproteinases-2, the soluble progelatinase A receptor. The EMBO journal. 1998;17(17):5238–48. doi: 10.1093/emboj/17.17.5238. [DOI] [PMC free article] [PubMed] [Google Scholar]
- 31.Visse R, Nagase H. Matrix metalloproteinases and tissue inhibitors of metalloproteinases: structure, function, and biochemistry. Circulation research. 2003;92(8):827–39. doi: 10.1161/01.RES.0000070112.80711.3D. [DOI] [PubMed] [Google Scholar]
- 32.Fontana V, Silva PS, Gerlach RF, Tanus-Santos JE. Circulating matrix metalloproteinases and their inhibitors in hypertension. Clin Chim Acta. 2012;413(7-8):656–62. doi: 10.1016/j.cca.2011.12.021. [DOI] [PubMed] [Google Scholar]
- 33.Catania JM, Chen G, Parrish AR. Role of matrix metalloproteinases in renal pathophysiologies. American journal of physiology Renal physiology. 2007;292(3):F905–11. doi: 10.1152/ajprenal.00421.2006. [DOI] [PubMed] [Google Scholar]
- 34.Fontana V, Silva PS, Belo VA, Antonio RC, Ceron CS, Biagi C, et al. Consistent alterations of circulating matrix metalloproteinases levels in untreated hypertensives and in spontaneously hypertensive rats: a relevant pharmacological target. Basic Clin Pharmacol Toxicol. 2011;109(2):130–7. doi: 10.1111/j.1742-7843.2011.00698.x. [DOI] [PubMed] [Google Scholar]
- 35.Tayebjee MH, Nadar S, Blann AD, Gareth Beevers D, MacFadyen RJ, Lip GY. Matrix metalloproteinase-9 and tissue inhibitor of metalloproteinase-1 in hypertension and their relationship to cardiovascular risk and treatment: a substudy of the Anglo-Scandinavian Cardiac Outcomes Trial (ASCOT) Am J Hypertens. 2004;17(9):764–9. doi: 10.1016/j.amjhyper.2004.05.019. [DOI] [PubMed] [Google Scholar]
- 36.Yasmin, McEniery CM, Wallace S, Dakham Z, Pulsalkar P, Maki-Petaja K, et al. Matrix metalloproteinase-9 (MMP-9), MMP-2, and serum elastase activity are associated with systolic hypertension and arterial stiffness. Arteriosclerosis, thrombosis, and vascular biology. 2005;25(2):372. doi: 10.1161/01.ATV.0000151373.33830.41. [DOI] [PubMed] [Google Scholar]
- 37.Onal IK, Altun B, Onal ED, Kirkpantur A, Gul Oz S, Turgan C. Serum levels of MMP-9 and TIMP-1 in primary hypertension and effect of antihypertensive treatment. Eur J Intern Med. 2009;20(4):369–72. doi: 10.1016/j.ejim.2008.10.003. [DOI] [PubMed] [Google Scholar]
- 38.Ergul A, Portik-Dobos V, Hutchinson J, Franco J, Anstadt MP. Downregulation of vascular matrix metalloproteinase inducer and activator proteins in hypertensive patients. Am J Hypertens. 2004;17(9):775–82. doi: 10.1016/j.amjhyper.2004.06.025. [DOI] [PubMed] [Google Scholar]
- 39.Zervoudaki A, Economou E, Stefanadis C, Pitsavos C, Tsioufis K, Aggeli C, et al. Plasma levels of active extracellular matrix metalloproteinases 2 and 9 in patients with essential hypertension before and after antihypertensive treatment. J Hum Hypertens. 2003;17(2):119–24. doi: 10.1038/sj.jhh.1001518. [DOI] [PubMed] [Google Scholar]
- 40.Smith ER, Tomlinson LA, Ford ML, McMahon LP, Rajkumar C, Holt SG. Elastin degradation is associated with progressive aortic stiffening and all-cause mortality in predialysis chronic kidney disease. Hypertension. 2012;59(5):973–8. doi: 10.1161/HYPERTENSIONAHA.111.187807. [DOI] [PubMed] [Google Scholar]
- 41.Chung AW, Booth AD, Rose C, Thompson CR, Levin A, van Breemen C. Increased matrix metalloproteinase 2 activity in the human internal mammary artery is associated with ageing, hypertension, diabetes and kidney dysfunction. J Vasc Res. 2008;45(4):357–62. doi: 10.1159/000119755. [DOI] [PubMed] [Google Scholar]
- 42.Tvete S, Elsayed E, Clausen G. Effect of exogenous angiotensin-II on local blood flow in kidneys with neoplasm. Experiments in the rat. Acta Radiol Oncol. 1981;20(2):125–9. doi: 10.3109/02841868109130432. [DOI] [PubMed] [Google Scholar]
- 43.Huang CL, Davis G, Johns EJ. A study of the action of angiotensin II on perfusion through the cortex and papilla of the rat kidney. Exp Physiol. 1991;76(5):787–98. doi: 10.1113/expphysiol.1991.sp003544. [DOI] [PubMed] [Google Scholar]
- 44.Tharaux PL, Chatziantoniou C, Fakhouri F, Dussaule JC. Angiotensin II activates collagen I gene through a mechanism involving the MAP/ER kinase pathway. Hypertension. 2000;36(3):330–6. doi: 10.1161/01.hyp.36.3.330. [DOI] [PubMed] [Google Scholar]
- 45.Boffa JJ, Lu Y, Placier S, Stefanski A, Dussaule JC, Chatziantoniou C. Regression of renal vascular and glomerular fibrosis: role of angiotensin II receptor antagonism and matrix metalloproteinases. Journal of the American Society of Nephrology : JASN. 2003;14(5):1132–44. doi: 10.1097/01.asn.0000060574.38107.3b. [DOI] [PubMed] [Google Scholar]
- 46.Kost CK, Jr, Herzer WA, Li P, Notoya M, Mizuhira V, Inagami T, et al. Angiotensin II-induced structural and functional alterations in spontaneously hypertensive rat kidney. Am J Physiol. 1996;270(1 Pt 2):F 229–36. doi: 10.1152/ajprenal.1996.270.1.F229. [DOI] [PubMed] [Google Scholar]
- 47.Ceron CS, Rizzi E, Guimaraes DA, Martins-Oliveira A, Cau SB, Ramos J, et al. Time course involvement of matrix metalloproteinases in the vascular alterations of renovascular hypertension. Matrix biology : journal of the International Society for Matrix Biology. 2012;31(4):261–70. doi: 10.1016/j.matbio.2012.01.009. [DOI] [PubMed] [Google Scholar]
- 48.Wang M, Zhang J, Spinetti G, Jiang LQ, Monticone R, Zhao D, et al. Angiotensin II activates matrix metalloproteinase type II and mimics age-associated carotid arterial remodeling in young rats. Am J Pathol. 2005;167(5):1429–42. doi: 10.1016/S0002-9440(10)61229-1. [DOI] [PMC free article] [PubMed] [Google Scholar]
- 49.Lenz O, Elliot SJ, Stetler-Stevenson WG. Matrix metalloproteinases in renal development and disease. Journal of the American Society of Nephrology : JASN. 2000;11(3):574–81. doi: 10.1681/ASN.V113574. [DOI] [PubMed] [Google Scholar]


