Abstract
Background
Electrical stimulation of muscle or nerve is a very useful technique for understanding of muscle activity and its pathological changes for both diagnostic and therapeutic purposes. During electrical stimulation of a muscle, the recorded M wave is often contaminated by a stimulus artifact. The stimulus artifact must be removed for appropriate analysis and interpretation of M waves.
Objectives
The objective of this study was to develop a novel software based method to remove stimulus artifacts contaminating or superimposing with electrically evoked surface electromyography (EMG) or M wave signals.
Methods
The multiple stage method uses a series of signal processing techniques, including highlighting and detection of stimulus artifacts using the Savitzky-Golay filtering, estimation of the artifact contaminated region with the Otsu thresholding, and reconstruction of such region using signal interpolation and smoothing. The developed method was tested using M wave signals recorded from biceps brachii muscles by a linear surface electrode array. To evaluate the performance, a series of semi-synthetic signals were constructed from clean M wave and stimulus artifact recordings with different degrees of overlap between them.
Results
The effectiveness of the developed method was quantified by a significant increase in correlation coefficient and a significant decrease in root mean square error between the clean M wave and the reconstructed M wave, compared with those between the clean M wave and the originally contaminated signal. The validity of the developed method was also demonstrated when tested on each channel’s M wave recording using the linear electrode array.
Conclusions
The developed method can suppress stimulus artifacts contaminating M wave recordings.
Keywords: M wave, Stimulus artifact suppression, Electromyography (EMG)
INTRODUCTION
The electromyographic (EMG) signal is the electrical manifestation of a contracting muscle. A muscle can be activated voluntarily or by applying electrical stimulation. Electrical stimulation of a peripheral nerve innervating a muscle results in the near simultaneous activation of the motor units. The resultant surface EMG signal is called a compound muscle action potential (CMAP) or M wave. Supramaximal stimulation of a muscle evokes the maximum M wave, the electrical equivalent of the recruitment of all the motor units of the muscle.
Electrical stimulation of muscle or nerve is a very useful technique for understanding of muscle activity and its pathological changes for both diagnostic and therapeutic purposes. For example, the amplitude of the maximum M wave and the number of motor unites (estimated from maximum M wave and incremental nerve stimulation) have been used to track progress of motor neuron diseases (de Carvalho et al. 2005). Such methods can also be used to investigate motor unit or muscle fiber changes following neurologic disorders such as stroke or spinal cord injury (Li et al., 2011; 2012). Electrical stimulation is also an important therapeutic approach for individuals with neurologic injuries targeting prevention of function loss or promotion of functional restoration (Schuhfried et al., 2012).
During electrical stimulation of a muscle, the recorded M wave is often contaminated by a stimulus artifact. The degree of contamination depends on the stimulus and recording conditions as well as the muscle studied. Stimulus parameters and the choice of detection parameters (e.g., selection of particular stimulation waveforms, inter-electrode distances, or electrode configuration) have been previously examined (Mandrile et al., 2003). Although experimental techniques can be developed to minimize stimulus artifact contamination, such artifacts routinely exist in M wave recordings. The stimulus artifact may obliterate the onset and rising phase of the M wave, making measures of latency impossible and influencing the M wave amplitude and area. The stimulus artifact mostly constitutes high frequencies and biases M wave spectrum analysis toward high values. The nontraveling signal components induced by stimulus artifact may alter M wave conduction velocity estimation using a linear electrode array (Mandrile et al., 2003).
The stimulus artifact can be removed for appropriate analysis and interpretation of M waves. For example, blanking based techniques have been applied to remove an artifact when it is separate from the M wave (Knaflitz and Merletti, 1988). In the case where the stimulus artifact and M-wave are superimposed, more complicated methods than blanking are required to remove the artifact without altering useful signal components.
The objective of this study was to develop a novel software based method to remove stimulus artifacts contaminating or superimposing with M waves. The method takes advantage of the Savitzky-Golay filtering (Savitzky and Golay,1964; Schafer, 2011) and Otsu thresholding (Otsu, 1979) techniques to highlight and blank the region of artifact contaminating M wave recordings. Then, signal interpolation and smoothing are employed to replace such a region for M wave reconstruction. The validity of the developed method was demonstrated using both simulation and experimental approaches.
METHODS
A. Framework for stimulus artifact removal
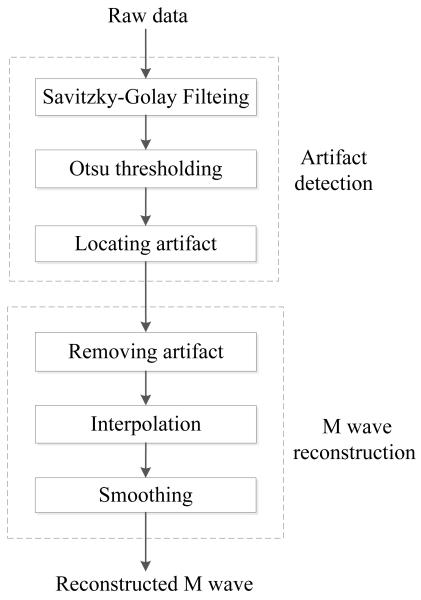
The developed method for stimulus artifact suppression from M waves is a software based approach. The framework includes highlighting, detection and blanking of the region of stimulus artifact contamination and replacement of artifact contaminated region for M wave reconstruction (Figure 1). The framework was implemented using a program written in MATLAB (v.7.12.0 R2011a, MathWorks Inc., Natick, MA), and the details of each step are described below.
Figure 1.
The framework for suppression stimulus artifacts contaminating M wave recording
B. Savitzky-Golay filtering
Compared with the M wave, artifacts evoked by electrical stimulation are rapidly varying signals (Figure 2a&b). The first step for artifact removal is to apply a Savitzky-Golay smoothing filter to attenuate short-term variations and obtain the underlying unadulterated form (Figure 2c) of the processed signal (Figure 2b). A Savitzky-Golay filter is a simplified least square fit convolution for smoothing and computing derivatives of a set of consecutive values (Savitzky and Golay, 1964; Schafer, 2011). The general equation of a Savitzky-Golay filter can be given as follows:
| (1) |
where y is the input signal, y* is the output signal, cj represents filter coefficients, m is the half-width of the smoothing window. The coefficients of a Savitzky–Golay filter (cj) can be determined from the equations presented by Madden (1978). After the Savitzky-Golay filtering, the stimulus artifact can be highlighted in the residual signal (i.e. subtracting the filter output from the original signal, Figure 2d), which contains short term variation of the signal.
Figure 2.
Illustration of stimulus artifact detection with the Savitzky-Golay filtering. (a) Representative stimulus artifact and clean M wave; (b) Superimposition of the M wave and the stimulus artifact; (c) Output signal after the Savitzky-Golay filtering; (d) Residual signal after the Savitzky-Golay filtering.
The behavior of a Savitzky-Golay filter is influenced by the polynomial order and the smoothing window length (2m+1). In this study, we initially filtered the signal by using a Savitzky–Golay filter of a second order polynomial and 7 data points. The equation for this particular Savitzky-Golay filter is defined as:
| (2) |
To optimize the window length of the Savitzky-Golay filter for stimulus artifact suppression, the influence of different window lengths ranging from 7 to 35 data points (at a sampling rate of 6k Hz as used in this study) on the artifact removal performance was examined (see Results).
C. Otsu thresholding
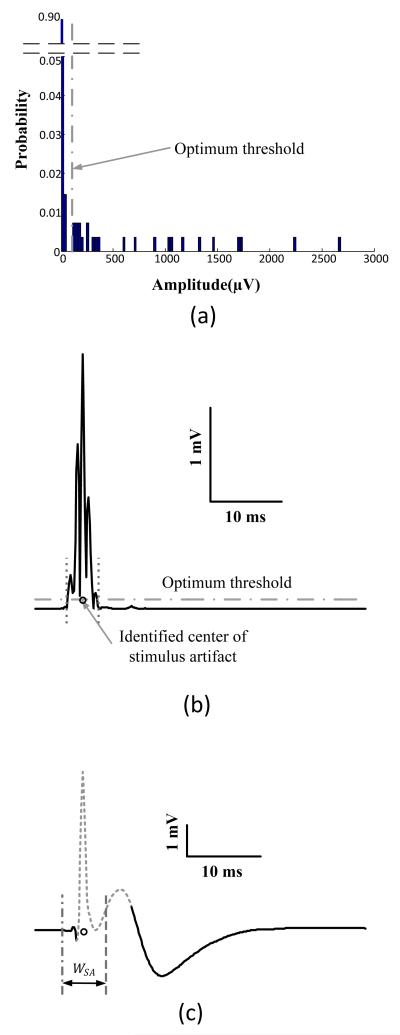
The residual signal after the Savitzky-Golay filtering is composed of two classes: the dominant stimulus artifact and the M wave with a relative low magnitude. The Otsu thresholding (Otsu 1979) was then used to optimize the threshold towards locating the artifacts in the residual signal (Figure 3a&b). Otsu thresholding was originally proposed to extract objects from their background in a grey-scale image. It determines an adaptive rather than fixed intensity threshold which minimizes, on a frame by frame basis, the intra-class variance of the grayscale values of the pixels to be binarized. The method can be applied in general to separate two classes of elements given their magnitude. It calculates the optimum threshold separating those two classes by making each cluster as tight as possible, thus minimizing their overlap. As the threshold is iteratively adjusted in one way, the variance of one class is increased while the variance of the other is decreased. The algorithm selects the threshold that minimizes the within-class variance or, equivalently, maximizes the between-class variance.
Figure 3.
Illustration of locating stimulus artifact with the Otsu thresholding. (a) Otsu thresholding of the residual signal (demonstrated in Figure 2d) to determine the optimum threshold for discrimination of M wave and stimulus artifact. (b) Locating the center of the stimulus artifact as the middle point of the set of consecutive data points above the optimum threshold; (c) Defining the stimulus artifact contaminated region of width WSA.
In this study, after computing the normalized histogram of the residual signal, Otsu thresholding was applied to determine the optimum threshold to separate the stimulus artifacts from the M wave (Figure 3a). The center of the artifact was identified as the middle point of the set of consecutive data points above the optimum threshold. The stimulus artifact region WSA was then empirically determined as 37 data points (i.e. 6 ms with 6k Hz sampling rate) (Figure 3c), which resulted in the best performance for the data sets tested in this study.
D. M wave reconstruction
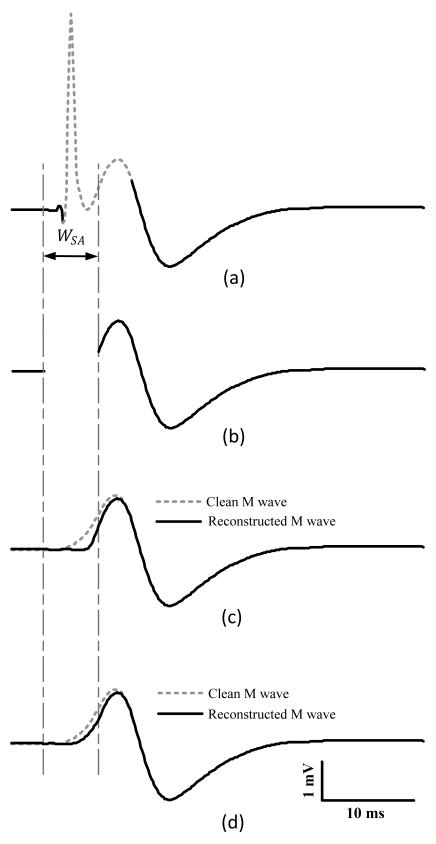
The artifact region (WSA) identified from the previous step was removed from the raw signal (Figure 4a&b). Signal interpolation with piecewise cubic Hermite polynomials was then used replace the removed region. Such an interpolation function was chosen to preserve shape and respect monotonicity for M wave reconstruction (Figure 4c). The signal was then smoothed with a sliding-average filter, which calculates a moving average under a rectangular window of 23 data points (Figure 4d).
Figure 4.
Illustration of M wave reconstruction. (a) The M wave with identified region of artifact contamination; (b) The artifact contaminated region was removed from the signal; (c) Reconstruction of the removed region with piecewise cubic Hermite interpolation; (d) Reconstruction of the removed region with a 23-point sliding-average smoothing filter after signal interpolation.
E. Testing datasets description
A validation study was conducted using a database of stimulus artifacts and M wave recordings from biceps brachii muscles of four neurologically intact subjects. Electrical stimulation was delivered through standard bar electrodes to the musculocutaneous nerve using a constant current stimulator (DS7A; Digitimer Ltd., Hertfordshire, UK). The M wave was recorded from the biceps brachii muscle using a home-made 20-channel linear electrode array (silver bars, each bar 10 mm in length and 1 mmm in width, inter-bar distance 5 mm) positioned over the midline and parallel to the muscle fibers. All signals were measured with the Refa multiple channel EMG acquisition system at a sampling frequency of 2k Hz per channel, using Portilab 2 software (TMS International, The Netherlands). The recorded signals were up-sampled to 6k Hz per channel to facilitate M wave reconstruction.
To evaluate stimulus artifact removal performance of the developed method, semi-synthetic signals were constructed where the precise M wave and stimulus artifact components were known a priori. To construct the semi-synthetic testing signals, two types of experimental signals were identified. The first type represents clean M waves. The second type represents typical stimulus artifacts. For each of the four subjects, four signal segments were selected to represent each type. Each segment of the clean M wave was then superimposed with each of the stimulus artifacts. For every combination, four different degrees of overlapping were used, generating artifact contaminated regions being 19, 23, 27 and 31 data points, respectively. Thus, for each subject, 64 semi-synthetic signals were generated. In total, we had 256 semi-synthetic testing signals.
F. Performance evaluation
The stimulus artifact removal performance was quantified using the constructed semi-synthetic testing datasets. The performance of the method was assessed by two criteria: the comparison of the correlation coefficient (CC) and the root mean square (RMS) error between the clean M wave and the signal before and after the processing. The stimulus artifact removal performance was also tested on each channel’s M wave recording using the linear electrode array.
RESULTS
A. Optimal window length of Savitzky-Golay filter for stimulation artifact removal
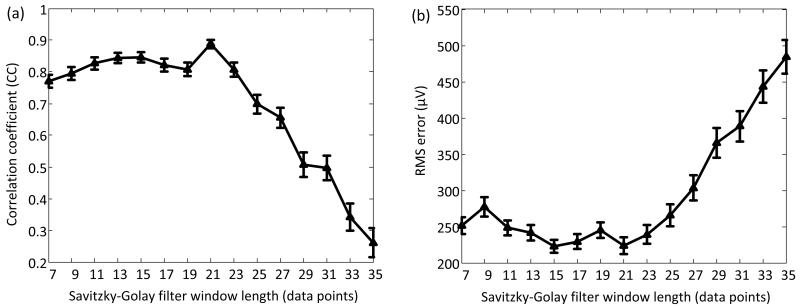
Figure 5 shows the effect of the Savitzky-Golay filter length on stimulus artifact removal performance. The dependence of correlation coefficient and the RMS error between the clean M wave and the reconstructed M wave are demonstrated in Figure 5(a) and (b), respectively. The results were averaged from all the semi-synthetic signals constructed from clean M wave and stimulus artifact recordings. It was observed that the correlation coefficient reached the maximum value when the window length was set to be 21 data points. The RMS error was approximately the minimum with 21 data points. Based on this analysis, the length of 21 data points was considered as a robust and optimal Savitzky-Golay filter length for the datasets used in this study.
Figure 5.
Evaluation of the effect of Savitzky-Golay filter length on stimulus artifact removal performance. (a) The dependence of correlation coefficient between clean M wave and reconstructed M wave on the filter length; (b) The dependence of RMS error between clean M wave and reconstructed M wave on the filter length.
B. Artifact suppression of semi-synthetic signals
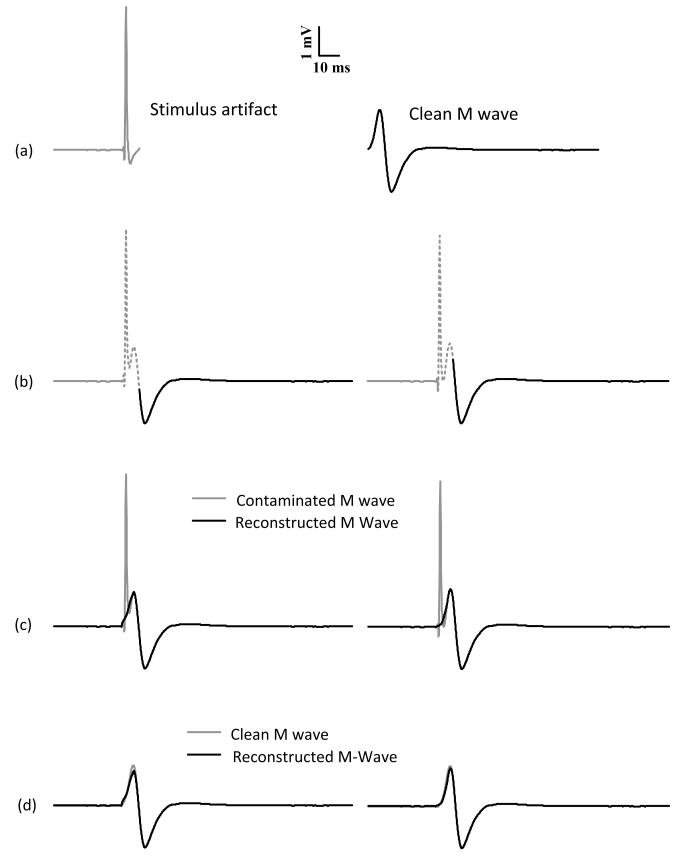
Figure 6 shows examples of artifact removal using semi-synthetic signals with different degrees of overlap between clean M waves and stimulus artifacts. After artifact removal, good matching between the clean M waves and the reconstructed signals was obtained (Figure 6d) for both tested degrees of overlap.
Figure 6.
Examples of stimulus artifact removal in M wave recordings. (a) Representative stimulus artifact and clean M wave recordings; (b) Simulation of contaminated M waves with different degrees of overlap between clean M wave and stimulus artifact; (d) A comparison of contaminated M wave and reconstructed M wave; (e) A comparison of clean M wave and reconstructed M wave.
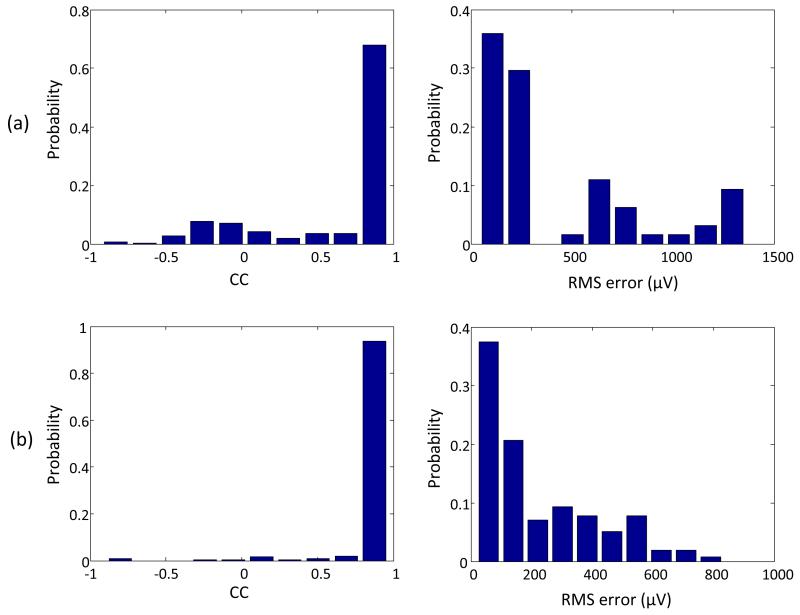
To quantitatively evaluate the stimulus artifact removal performance, the distribution of correlation coefficients and RMS error was further investigated using all the semi-synthetic signals (Figure 7). The average correlation coefficient between clean M wave and reconstructed M wave was 0.89, much higher than the average correlation coefficient of 0.64 between clean M wave and original signal. The average RMS error between clean M wave and reconstructed M wave was 223μV, much smaller than the average RMS error of 425 μV between clean M wave and original signal.
Figure 7.
Evaluation of artifact removal performance using semi-synthetic signals. (a) Distribution of correlation coefficient and RMS error between clean M wave and the signal before the artifact removal; (b) Distribution of correlation coefficient and RMS error between clean M wave and the signal after the artifact removal.
C. Artifact suppression of experimental signals
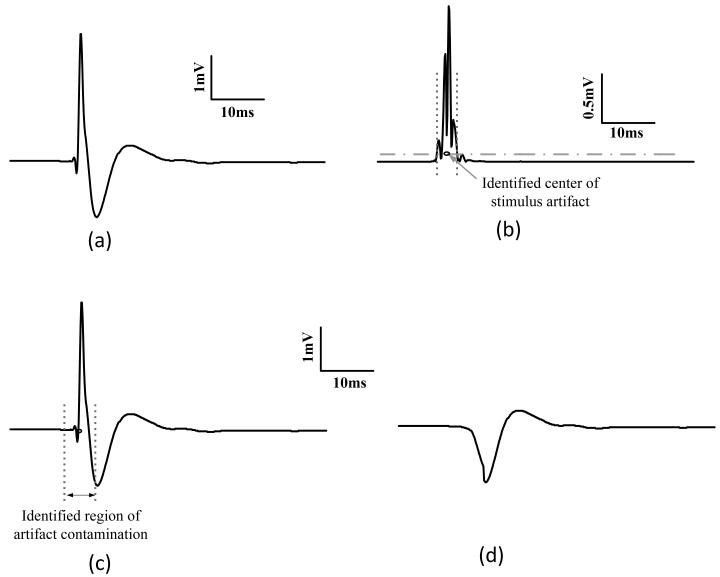
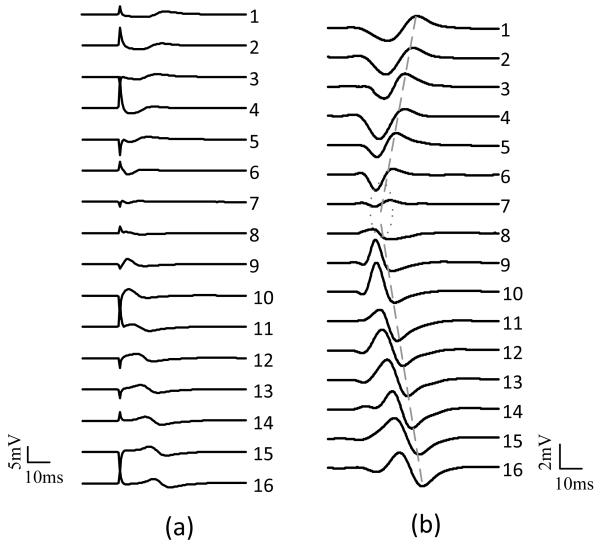
Figure 8 shows an example of stimulus artifact removal by the developed method using experimental M wave recording from biceps brachii muscle, where several selected specific steps were demonstrated. Figure 9 shows removal of stimulus artifacts from multiple channel M wave recordings using a linear electrode array. Sixteen channels of bipolar signals are shown in the figure. It was observed that the M wave recordings were severely contaminated by stimulus artifacts (Figure 9a). With such contaminations, it was difficult to observe the M wave propagation patterns along the muscle fibers. Figure 9b shows the reconstructed M waves for each channel using the developed method, where the M wave propagation pattern can clearly be observed. Based on this, the muscle innervation zone can be estimated (marked by the dotted oval).
Figure 8.
An example of stimulus artifact removal from experimental M wave recording. (a) M wave superimposed with stimulus artifact; (b) Locating the center of the stimulus artifact by the Otsu threholding of the residual signal after the Savitzky-Golay filtering; (c) Identification of the region of artifact contamination region in the M wave recording; (d) the reconstructed M wave after removal of stimulus artifact.
Figure 9.
An illustration of artifact removal from M wave recordings of a linear electrode array. Sixteen single differential surface EMG signals are demonstrated. (a) Raw M waves contaminated or superimposed with stimulus artifacts; (b) The corresponding M waves after removal of stimulus artifacts.
DISCUSSION
Electrically evoked EMG or M wave recording is a very important tool for both neurophysiological research and clinical electrodiagnosis. Reliable measurement of M wave is important for its various applications. Although experimental procedures may be optimized to reduce stimulus artifacts, stimulus artifacts routinely exist in the electrically evoked myoelectric signals. It is not uncommon that the recorded signals are contaminated with dominant stimulus artifacts. In such a situation, suppression of stimulus artifacts is required for appropriate interpretation and application of the signals.
Stimulus artifact removal is a research topic for many fields such as M wave recording, electrically evoked potentials (EEPs) from visual cortex and electrically evoked compound action potentials (ECAPs) during deep brain stimulation. Thus suppression of stimulus artifacts has received considerable attention. Different methods have been developed including the most commonly used blanking techniques and more complicated methods (e.g. based on template subtraction, digital filtering, multi-channel signal processing) which can reduce stimulus artifact while leaving the useful signal relatively intact (Al-ani et al., 2011; Blogg and Reid, 1990; Boudreau et al., 2004; Brown et al., 2008; Erez et al., 2010; Grieve et al., 2000; Hashimoto et al., 2002; Heffer and Fallon, 2008; Kent and Grill, 2012; Lu et al., 2012; Mahmud et al., 2012; McGill et al., 1982; O’Keeffe et al., 2001; Sadeghian et al., 2010; Taulu and Hari, 2009; Wagenaar and Potter, 2002; Wichmann, 2000; Wichmann and Devergnas, 2011).
In this study we presented a novel and relatively simple method to effectively remove stimulus artifacts contaminating M wave recordings. The method includes multiple stages taking advantage of a series of signal processing techniques. These include highlighting and detection of stimulus artifacts using the Savitzky-Golay filtering, estimation of artifact contamination region with the Otsu thresholding, and reconstruction of artifact contaminated region using signal interpolation and smoothing. The primary feature of the method is that it does not require extra channel recording. The user is not required to record any pure artifact signals for use in stimulus artifact removal methods, such as those based on template subtraction, adaptive filtering or independent component analysis. Moreover, the techniques used in the present study have the ability to cope with stimulus artifacts superimposed with M wave. The Savitzky-Golay smoothing operation was utilized to extract instantaneous short-term variations, followed by the Otsu thresholding which determines an optimal threshold for discrimination of M wave and stimulus artifacts. Application of such techniques can help separate and suppress stimulus artifacts superimposed with M waves.
The methods presented in this study are designed for artifact removal from M waves. Stimulus artifacts from other recordings (e.g., EEPs from visual cortex, ECAPs during deep brain stimulation) share similar characteristics. Thus theoretically similar methods can be used for stimulus artifact removal from other signals. It is acknowledged that the stimulus artifacts of each type of signal may vary. The parameters, empirically set for the current study, may need to be adjusted in order to achieve the best performance of artifact removal using the similar framework. Indeed, even for simultaneously recorded EMG channels of an electrode array, the characteristics of stimulus artifacts and M waves may be different from each other. Our program allows batch processing of multiple files. It also provides a convenient way to compare the artifact removal performance with different parameter settings and adjust relevant parameters according to signal characteristics of a specific file. This facilitates application of the developed method for stimulus artifact removal from different types of signals.
Acknowledgement
This work was supported in part by the National Institutes of Health of the U.S. Department of Health and Human Services under Grant R21NS075463 and Grant R24HD050821, and in part by the National Institute on Disability and Rehabilitation Research of the U.S. Department of Education under Grant H133G090093.
References
- Al-ani T, Cazettes F, Palfi S, Lefaucheur JP. Automatic removal of high-amplitude stimulus artefact from neuronal signal recorded in the subthalamic nucleus. Journal of neuroscience methods. 2011;198:135–46. doi: 10.1016/j.jneumeth.2011.03.022. [DOI] [PubMed] [Google Scholar]
- Blogg T, Reid WD. A digital technique for stimulus artifact reduction. Electroencephalography and clinical neurophysiology. 1990;76:557–61. doi: 10.1016/0013-4694(90)90005-5. [DOI] [PubMed] [Google Scholar]
- Boudreau BH, Englehart KB, Chan AD, Parker PA. Reduction of stimulus artifact in somatosensory evoked potentials: segmented versus subthreshold training. IEEE transactions on bio-medical engineering. 2004;51:1187–95. doi: 10.1109/TBME.2004.827342. [DOI] [PubMed] [Google Scholar]
- Brown EA, Ross JD, Blum RA, Nam Y, Wheeler BC, DeWeerth SP. Stimulus-Artifact Elimination in a Multi-Electrode System. Ieee T Biomed Circ S. 2008;2:10–21. doi: 10.1109/TBCAS.2008.918285. [DOI] [PubMed] [Google Scholar]
- de Carvalho M, Chio A, Dengler R, Hecht M, Weber M, Swash M. Neurophysiological measures in amyotrophic lateral sclerosis: markers of progression in clinical trials. Amyotroph Lateral Scler Other Motor Neuron Disord. 2005 Mar;6(1):17–28. doi: 10.1080/14660820410020600. [DOI] [PubMed] [Google Scholar]
- Erez Y, Tischler H, Moran A, Bar-Gad I. Generalized framework for stimulus artifact removal. Journal of neuroscience methods. 2010;191:45–59. doi: 10.1016/j.jneumeth.2010.06.005. [DOI] [PubMed] [Google Scholar]
- Grieve R, Parker PA, Hudgins B, Englehart K. Nonlinear adaptive filtering of stimulus artifact. IEEE Trans. Biomed. Eng. 2000;47(3):389–395. doi: 10.1109/10.827307. [DOI] [PubMed] [Google Scholar]
- Hashimoto T, Elder CM, Vitek JL. A template subtraction method for stimulus artifact removal in high-frequency deep brain stimulation. Journal of neuroscience methods. 2002;113:181–6. doi: 10.1016/s0165-0270(01)00491-5. [DOI] [PubMed] [Google Scholar]
- Heffer LF, Fallon JB. A novel stimulus artifact removal technique for high-rate electrical stimulation. Journal of neuroscience methods. 2008;170:277–84. doi: 10.1016/j.jneumeth.2008.01.023. [DOI] [PMC free article] [PubMed] [Google Scholar]
- Kent AR, Grill WM. Recording evoked potentials during deep brain stimulation: development and validation of instrumentation to suppress the stimulus artefact. Journal of neural engineering. 2012;9:036004. doi: 10.1088/1741-2560/9/3/036004. [DOI] [PMC free article] [PubMed] [Google Scholar]
- Knaflitz M, Merletti R. Suppression of simulation artifacts from myoelectric-evoked potential recordings. IEEE Trans Biomed Eng. 1988 Sep;35(9):758–63. doi: 10.1109/10.7278. [DOI] [PubMed] [Google Scholar]
- Li X, Wang YC, Suresh NL, Rymer WZ, Zhou P. Motor unit number reductions in paretic muscles of stroke survivors. IEEE Trans Inf Technol Biomed. 2011 Jul;15(4):505–12. doi: 10.1109/TITB.2011.2140379. [DOI] [PubMed] [Google Scholar]
- Li X, Jahanmiri-Nezhad F, Rymer WZ, Zhou P. An Examination of the Motor Unit Number Index (MUNIX) in Muscles Paralyzed by Spinal Cord Injury. IEEE Trans Inf Technol Biomed. 2012 Apr 4;16(6):1143–1149. doi: 10.1109/TITB.2012.2193410. [DOI] [PMC free article] [PubMed] [Google Scholar]
- Lu Y, Cao P, Sun J, Wang J, Li L, Ren Q, Chen Y, Chai X. Using independent component analysis to remove artifacts in visual cortex responses elicited by electrical stimulation of the optic nerve. Journal of neural engineering. 2012;9:026002. doi: 10.1088/1741-2560/9/2/026002. [DOI] [PubMed] [Google Scholar]
- Madden HH. Comments on Savitzky-Golay Convolution Method for Least-Squares Fit Smoothing and Differentiation of Digital Data. Analytical chemistry. 1978;50:1383–6. [Google Scholar]
- Mahmud M, Bertoldo A, Girardi S, Maschietto M, Vassanelli S. SigMate: A MATLAB-based automated tool for extracellular neuronal signal processing and analysis. Journal of neuroscience methods. 2012;207:97–112. doi: 10.1016/j.jneumeth.2012.03.009. [DOI] [PubMed] [Google Scholar]
- Mandrile F, Farina D, Pozzo M, Merletti R. Stimulation artifact in surface EMG signal: effect of the stimulation waveform, detection system, and current amplitude using hybrid stimulation technique. IEEE transactions on neural systems and rehabilitation engineering. 2003;11:407–15. doi: 10.1109/TNSRE.2003.819791. [DOI] [PubMed] [Google Scholar]
- McGill KC, Cummins KL, Dorfman LJ, Berlizot BB, Leutkemeyer K, Nishimura DG, Widrow B. On the nature and elimination of stimulus artifact in nerve signals evoked and recorded using surface electrodes. IEEE transactions on bio-medical engineering. 1982;29:129–37. doi: 10.1109/TBME.1982.325019. [DOI] [PubMed] [Google Scholar]
- O’Keeffe DT, Lyons GM, Donnelly AE, Byrne CA. Stimulus artifact removal using a software-based two-stage peak detection algorithm. Journal of neuroscience methods. 2001;109:137–45. doi: 10.1016/s0165-0270(01)00407-1. [DOI] [PubMed] [Google Scholar]
- Otsu N. Threshold Selection Method from Gray-Level Histograms. Ieee T Syst Man Cyb. 1979;9:62–6. [Google Scholar]
- Sadeghian H, Chitnis S, Elliott JL. Deep brain stimulation artifact in needle electromyography. Archives of neurology. 2010;67:1030. doi: 10.1001/archneurol.2010.183. [DOI] [PubMed] [Google Scholar]
- Savitzky A, Golay MJE. Smoothing + Differentiation of Data by Simplified Least Squares Procedures. Analytical chemistry. 1964;36:1627–39. [Google Scholar]
- Schafer RW. What Is a Savitzky-Golay Filter? Ieee Signal Proc Mag. 2011;28:111–7. [Google Scholar]
- Schuhfried O, Crevenna R, Fialka-Moser V, Paternostro-Sluga T. Non-invasive neuromuscular electrical stimulation in patients with central nervous system lesions: an educational review. J Rehabil Med. 2012 Feb;44(2):99–105. doi: 10.2340/16501977-0941. doi: 10.2340/16501977-0941. [DOI] [PubMed] [Google Scholar]
- Taulu S, Hari R. Removal of magnetoencephalographic artifacts with temporal signal-space separation: demonstration with single-trial auditory-evoked responses. Human brain mapping. 2009;30:1524–34. doi: 10.1002/hbm.20627. [DOI] [PMC free article] [PubMed] [Google Scholar]
- Wagenaar DA, Potter SM. Real-time multi-channel stimulus artifact suppression by local curve fitting. Journal of neuroscience methods. 2002;120:113–20. doi: 10.1016/s0165-0270(02)00149-8. [DOI] [PubMed] [Google Scholar]
- Wichmann T. A digital averaging method for removal of stimulus artifacts in neurophysiologic experiments. Journal of neuroscience methods. 2000;98:57–62. doi: 10.1016/s0165-0270(00)00190-4. [DOI] [PubMed] [Google Scholar]
- Wichmann T, Devergnas A. A novel device to suppress electrical stimulus artifacts in electrophysiological experiments. Journal of neuroscience methods. 2011;201:1–8. doi: 10.1016/j.jneumeth.2011.06.026. [DOI] [PMC free article] [PubMed] [Google Scholar]


