

Abstract
The nature and stoichiometry of pigments in the Fenna-Matthews-Olson (FMO) photosynthetic antenna protein complex were determined by native electrospray mass spectrometry. The FMO antenna complex was the first chlorophyll-containing protein that was crystallized. Previous results indicate that the FMO protein forms a trimer with seven bacteriochlorophyll a in each monomer. This model has long been a working basis to understand the molecular mechanism of energy transfer through pigment/pigment and pigment/protein coupling. Recent results have suggested, however, that an eighth bacteriochlorophyll is present in some subunits. In this report, a direct mass-spectrometry measurement of the molecular weight of the intact FMO protein complex clearly indicates the existence of an 8th pigment, which is assigned as a bacteriochlorophyll a by mass analysis of the complex and HPLC analysis of the pigment. The 8th pigment is found to be easily lost during purification, which results in its partial occupancy in the mass spectra of the intact complex prepared by different procedures. The results are consistent with the recent X-ray structural models. The existence of the 8th bacteriochlorophyll a in this model antenna protein gives new insights into the functional role of the FMO protein and motivates the need for new theoretical and spectroscopic assignments of spectral features of the FMO protein.
Keywords: FMO protein, bacteriochlorophyll a, native electrospray ionization, mass spectrometry
With increasing attention toward renewable and carbon-neutral energy sources to meet our future energy demands, solar energy is receiving significant attention as a potential energy source (1). One of the greatest technological challenges today, however, is to capture, convert, and store efficiently the energy in photons in a cost-effective fashion. Solar-energy utilization by photosynthetic organisms provides an excellent example for us to learn the architecture of the components, as well as their self-assembly and self-repair. Lessons learned from natural energy transduction systems will inspire the search for bio-hybrid and artificial devices and improve the technological design of novel photovoltaics (2–4).
The Fenna-Matthews-Olson (FMO) protein was the first photosynthetic antenna complex containing (bacterio)chlorophyll to have its atomic structure determined (5–7). The FMO protein has been the subject of intense structural (8–11), spectroscopic (12–16) and theoretical attention (17–20) directed at gaining insights into the molecular mechanism of photosynthetic energy transfer (21, 22). The FMO protein is found in photosynthetic green sulfur bacteria (23) and recently in the acidobacteria (9, 24, 25). It functions both as a photosynthetic light-harvesting antenna and as an energy-transfer intermediate governing the energy flow from the peripheral antenna chlorosomes to the reaction centers where energy conversion occurs via electron-transfer reactions (12, 26, 27).
The FMO protein from Chlorobaculum tepidum (formerly Chlorobium tepidum) (5) consists of three identical subunits related by a 3-fold axis of symmetry (Fig. 1B). In each subunit, the polypeptide backbone consists mainly of beta sheet secondary structure and forms a compact “taco-shell” structure that encloses a central core of seven bacteriochlorophyll (BChl) a molecules (Fig. 1A). The open end of the “taco” is closed by short alpha helices and loops. Structures of the FMO protein from Prosthecochloris (P.) aestuarii 2K (6, 8) and Pelodictyon (P.) phaeum (11) are similar overall to that of the FMO from C. tepidum; their backbones and pigment cofactors are nearly superimposible. There are numerous water molecules in the solved structures, located mainly in the monomer connection region, and some inside the monomer cavity (Fig. 1). For example, BChl a2 has a water ligand binding the central magnesium (5).
Figure 1.
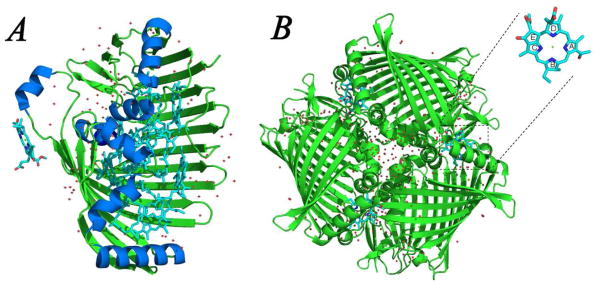
Structure of the FMO protein from Chlorobaculum tepidum (PDB: 3ENI). (A) FMO monomer with β sheets and loops colored in green, α helices colored in blue and pigments colored in cyan. (B) FMO trimer with one proposed 8th pigment shown as it is located in the trimer. The red dots are water molecules.
The high-resolution structures of the FMO protein have provided the basis for detailed analysis of the optical spectra of the protein and for understanding the pigment-protein interactions (13, 17). Advances in multidimensional coherent spectroscopies (12, 28, 29) have allowed a more detailed description of the energy-delocalization process within this protein and have recently revealed quantum-coherence effects in the energy transfer in the FMO protein (14,15). Advanced theoretical calculations (17, 26) were applied to describe the origin of the tuning of the electronic structure by pigment-pigment and pigment-protein couplings in this model antenna protein, and its electronic structure was recently reviewed (13, 21). Moreover, fundamental studies of the high energy-transfer efficiency in the FMO protein were comprehensively carried out, and quantum physics models were developed to explain such a high efficiency (30–33). Knowledge gained from understanding the molecular mechanism of the energy transfer process in this model antenna will facilitate the development of a generalized theory to describe energy transfer in photosynthetic systems and advance the development of artificial solar conversion systems.
All these analyses and calculations have been based on earlier structures with seven BChl a in each monomer. Recent new FMO structures (8, 11, 34), however, all suggest that an 8th pigment modeled as a BChl a is located in the monomer connection region (Fig. 1B), where the floating electron density in the previous structures could not be modeled (6). The electron density of the putative 8th BChl a is weak and incomplete in some structures, which is attributed to its partial occupancy. The estimated electron density occupancy of this extra BChl a in the structure of the FMO protein from P. aestuarii 2K (8) is approximately 34% that of the other BChl a molecules. Thus, immediate questions arise concerning the presence of the 8th pigment in the protein and the overall pigment stoichiometry of the complexin vivo. It is possible that an FMO trimer in this species has only one 8th pigment, which breaks the three-fold symmetry and has a specific role in directing the energy flow. It is also possible, however, that the native trimer has three additional pigments and that some of them are lost during the protein purification and crystallization owing to surface exposure (Fig. 1B). A heterogeneous sample containing between zero and three additional pigments in a trimer may give the average of 34% occupancy by coincidence.
The newly resolved 8th pigment is positioned such that it is near the chlorosome according to the recently determined orientation of the FMO protein on the membrane (27). Based on its location, the 8th pigment is likely to provide the entrance point of excitations into the FMO protein. It is, therefore, important to establish the stoichiometry and identity of this pigment, especially when modeling the quantum coherent energy transfer pathways through the complex.
Furthermore, the phytyl tail of the 8th proposed BChl a could not be resolved in any of the structures (PDB: 3ENI, 3EOJ and 3OEG). Thus, the additional pigment may be a bacteriochlorophylide (BChlide) a, (i.e., BChl a without a tail). An alternative explanation is that the tail is flexible in the crystal and, thus, cannot be resolved by crystallography. Moreover, the electron density of the cyclic tetrapyrrole of the proposed BChl a is weak even in the 1.3 Å resolution structure. Thus, more data are needed to validate the existence of the 8th pigment and determine its chemical nature and stoichiometry in the protein complex.
In this study, we employed native electrospray ionization (ESI) mass spectrometry (MS) to measure directly the mass of the entire FMO protein complex. MS not only plays a crucial role in the identification of proteins involved in the intricate interaction networks of the cell and their expression levels and modifications (35–37), but also is increasingly involved in the characterization of non-covalent protein complexes by measuring the mass of the intact complex (38–41). In this study, the purified intact FMO protein complexes from P. aestuarii (AFMO) and C. tepidum (TFMO) were introduced into a mass spectrometer under native conditions (i.e., the spray solution was neutral, aqueous, and contained a high concentration of NH4OAc). The molecular weight of the entire complex including the noncovalently bound cofactors could be recorded, thus allowing the stoichiometry of the interacting components to be defined to provide unique insights into the nature of the 8th pigment and the stoichiometry of the complex. In addition, different preparation methods of the FMO protein from C. tepidum were tested to measure the occupancy of the 8th pigment. The possible function of the 8th pigment in the FMO protein is discussed at the end.
Experimental Procedures
FMO protein purification
Cells of P. aestuarii 2K were grown anaerobically at room temperature with a light intensity of 150 μE for 2 days in two 15 L carboys (42). C. tepidum TLS cells were grown at 40 °C (43). The Na2CO3 extraction of the FMO protein from the membrane was performed following the procedure described earlier (5, 8, 10). In brief, the cytoplasmic membrane (OD745nm ~ 200 cm−1) was sequentially incubated with 0.2 M and 0.4 M Na2CO3 in the dark at 4 °C for 20 h, respectively. The released FMO protein was then loaded onto a Toyopearl SuperQ-650S (Tosoh Bioscience LLC, PA) ion-exchange column after desalting. The FMO protein was eluted with 80–100 mM NaCl. Further protein purification was achieved by loading the protein on a HiLoad 16/60 Superdex 200 gel filtration column (GE Healthcare, Piscataway, NJ), and the fractions with OD267nm/OD371nm <0.6 were selected and pooled. The final product was concentrated by using an Amicon Ultra-15 centrifugal filter units with molecular weight cut-off of 50 kDa (Millipore, Billerica, MA) and stored in the dark at 4 °C.
The FMO protein from C. tepidum was also prepared by membrane extraction using the zwitterionic detergent Anzergent 3–12 (Anatrace, Maumee, OH). The cytoplasmic membrane (OD745nm ~ 200 cm−1) was incubated with 250 mM Anzergent 3–12 for 1 h, then diluted five times and ultra-centrifuged at 200,000 ×g for 2 h. The detergent-extracted protein complexes in the supernatant containing the FMO protein were collected. The solution was concentrated and loaded onto a linear sucrose density gradient with densities from 10% to 45% (g/v) in 20 mM Tris/HCl (pH = 8.0) with 50 mM Anzergent 3–12 and centrifuged at 100,000 ×g overnight. The FMO protein band, which showed a light blue color, was collected and desalted by serial dilutions and concentrations. The FMO protein was further purified by ion exchange and gel filtration columns as described above. No detergent was added to the buffer solution in the ion exchange and gel filtration chromatography to ensure the final FMO protein solution was detergent-free and mass-spectrometry-compatible.
MS measurements
MS measurements of the denatured and native FMO protein were carried out on a quadrupole time-of-flight mass spectrometer equipped with a nano-electrospray (nano-ESI) source (Maxis, Bruker Daltonics, Bremen, Germany) coupled either to a PHD ULTRA™ syringe pump (Harvard Apparatus, MA, USA), or to an nanoACQUITY UltraPerformance LC (Waters Corp., MA). A schematic of the ion source, ion transfer and detection of the Maxis mass spectrometer is shown in SI Figure 1. The electrospray ionization (ESI) source and ion-transfer region of the Maxis are similar to the Bruker SolariX FTICR instrument (25, 44).
Sample preparation and mass measurement were similar to those as described previously (25). In brief, to measure the mass of the denatured FMO polypeptide and the BChl a, an aliquot of the protein solution (10 μL of a ~ 0.5 μM solution) was loaded onto an Opti-Guard C18 trap column (Optimize Technologies, INC., Oregon City, OR) and washed by 0.1% formic acid (FA) in water before it was eluted by using a 0–100% acetonitrile gradient with 0.1% FA in 10 min. The ESI conditions were: positive-ion mode; capillary voltage, 4000 V; dry gas, 5 L/min; and dry-gas temperature, 150 °C.
For native ESI, the FMO complex was exchanged into 0.75 M ammonium acetate (pH = 7.5) and concentrated to ~15 μM. Sample infusion was by nano-ESI, using a custom-pulled silica capillary needle at a voltage of 850–1500 V. The needle was pulled by a P-2000 Laser Puller (Sutter Instrument CO., Novato, CA) using fused silica capillary tubing with ID 150 μm (Polymicro Technologies LLC, Phoenix, AZ). The flow rates for the mass spectral measurements were between 20 nL/min to 0.1 μL/min. Optimization of the ion-transfer parameters and calibration of the instrument to m/z = 15,000 were carried out by using an ESI tuning mix (Bruker, part # 18220) that was directly infused. To achieve better native-ESI signals, the collision energy in the collision cell (CID) was increased to 20–40 eV, in-source collision-induced dissociation (ISCID) was turned on, and collision voltages up to 180 V were used, all of which helped desolvate the complex without dissociating it. The details of the CID and ISCID parameters and their effects on the quality of the native mass spectra are described in the main text.
The Bruker Data Analysis Software was used to analyze the data and deconvolute the mass spectra. For the simulation of the native electrospray spectra, Gaussian functions with bandwidths of 6–8 m/z were applied by using Origin (OriginLab Corporation, Northampton, MA). All mass measurements were made in triplicate at a minimum. The mass accuracy of the deconvoluted molecular weight is estimated on the basis of the peak width and peak fluctuations in different replications.
Pigment analysis by HPLC
The purified FMO protein (10 uL, OD808 nm ~ 10 cm−1) was directly loaded onto an XDB C18 reversed-phase column (4.6 × 250 mm; pore size: 100 Å; Agilent Technologies) by an Agilent series 1100C high-performance liquid chromatography (HPLC) system. Pigments were eluted by an acetone/water gradient that started with 40% acetone and increased to 70% acetone in 15 min and then increased to 100% acetone in 10 min and kept constant for another 7 min. The flow rate was 1 mL/min. The whole UV/Vis range of an absorption spectrum was monitored by a photodiode-array detector. Pigments eluted by HPLC were collected for further mass analysis. Other HPLC protocols for pigment analyses (45–47) were adapted and used in an effort to detect BChlide a.
BChlide a, extracted from the bchG mutant of Rhodobacter capsulatus (46) (a gift from Prof. Carl Bauer) in which only BChlide a accumulated, was used as a chromatography standard.
Results and Discussion
Native electrospray of AFMO protein complex
Under native ESI conditions, the AFMO protein complexes enter the gas phase with a range of only four or five charge states per monomer and produce ions over a high m/z range (m/z ~ 6000) (Fig. 2, SI Fig. 2). The relatively few charge states indicate that compact structures are maintained in the gas phase. This electrospray-ionization pattern contrasts strongly with that of a wide charge-state distribution at lower m/z when this protein was measured under denaturing conditions (SI Fig. 3A). The balance of ion desolvation and complex dissociation during the native ESI was achieved by gradually increasing the voltage of ISCID (in-source collision induced dissociation) and the CID (collision induced dissociation) energy and observing the mass spectra. In agreement with previously reported native ESI mass spectra (39, 41), better desolvation resulted in lower m/z ion peaks with narrower peak widths and smaller peak fluctuations (SI. Fig. 2). Most importantly for the AFMO protein complex, clear shoulder peaks gradually appeared as the complex was increasingly desolvated (Fig. 2, SI Fig. 2).
Figure 2.

(A) Mass spectrum of intact AFMO complex by native electrospray mass spectrometry. Nano-ESI conditions: voltage of ISCID: 180 V; CID: 20 eV. The vertical blue lines are theoretical m/z values for charge states +20 to +24 generated using the labeled MW; the +23 charge state was assigned to the base peak. (B) Gaussian functions with bandwidth of m/z = 6 were used to simulate the various resolved peaks (+22 and +23) of ions with molecular weights of 139,043 Da (pink), 139,685 Da (green), 140,329 Da (blue), and 140,976 Da (red).
Under relatively harsh desolvation conditions (Fig. 2A, ISCID: 180 V; CID: 20 eV), the peak fluctuation is only approximately m/z = 1–2, in contrast to the larger deviations with incomplete desolvation shown in SI Fig. 2A–2C, from m/z ~ 40, 20 and 4, respectively. Further increases of ISCID and CID energy beyond these values resulted in decreased or lost signal. The small peak fluctuation and the clear separation of the shoulder peaks in each charge state enable an optimum assignment of the charge states of the various molecular ions, with the base peak corresponding to an ion of m/z ~ 6100 carrying +23 charges. The molecular weight (MW) of the AFMO complex is determined to be 140,329 ± 50 Da. A theoretical charge state simulation for a protein assembly with a MW of 140,329 Da is shown by the vertical blue lines (Fig. 2A), which are a good match with the experimental data.
The resolved peaks in each charge state were labeled as 0, 1, 2 and 3 in Fig. 2B, and the MWs of their corresponding protein assemblies are listed in Table 1. The mass differences between neighboring ions are approximately 640 Da, which can be calculated from the above deconvoluted MWs or from individual resolved peaks in each charge state. For example, the four resolved peaks corresponding to ions having +24 charge states are centered at m/z 5795, 5821, 5848 and 5875. The m/z difference is ~27, corresponding to a mass difference of 27 × 24 ~ 640 Da in MW.
Table 1.
Theoretical and experimental mass of the AFMO complex with 0–3 BChlide a
| # of 8th BChlide a | Theoretical Mass (Da) | Experimental Mass (Da) | Δ m2 (Da) |
|---|---|---|---|
| 0 | 138,854 | 139,043 ± 50 | 189 |
| 1 | 139,487 | 139,685 ± 50 | 198 |
| 2 | 140,120 | 140,329 ± 50 | 209 |
| 3 | 140753 | 140976 ± 50 | 223 |
Δm is the mass difference between the Experimental Mass and the Theoretical Mass.
For each charge state, the four peaks are assigned as corresponding to AFMO protein complexes with 0, 1, 2 and 3 copies of an eighth or additional pigment in the trimer. Given that the mass difference between neighboring ions is ~ 640 Da, the apparent MW of the 8th pigment is approximately that of BChlide a (Average MW: 633.0 Da) and not that of intact BChl a (Average MW: 911.5 Da). The measured MW of the denatured AFMO polypeptide is 39,904 Da (SI Fig. 3B), which is that of the protein sequence without the N-terminal MetAlaLeuPhe residues. Using this value and the MWs of BChl a and BChlide a, we calculated the theoretical MWs of the AFMO complexes containing zero to three additional BChlide a and listed them in Table 1. As can be seen, the experimental MWs are a good match with the theoretical values when we assume the 8th pigment is BChlide a. The slightly higher measured values (189, 198, 209 and 223 Da, respectively) are not unexpected because native ESI does not completely desolvate protein assemblies (38, 48, 49). If all the adducted species were water molecules, then approximately 10–13 water molecules are trapped in each trimer; this number is consistent with its X-ray crystal structure that shows ordered water molecules enclosed in the protein shell.
To determine the occupancy of the 8th pigment in the sample, we simulated the resolved peaks in each charge state with Gaussian functions (width of m/z = 6), and the outcomes, using the above MWs and assigned charge states, are included in Fig. 2B. Using the well-resolved +23 and +24 charge states and assuming that three is the maximum number of additional species in the trimer, we calculated the occupancy of the putative 8th BChlide a to be ~55% by using the integrated areas under the individual peaks from the Gaussian simulation.
AFMO pigment analysis
The above MS analysis, especially the observation of clear shoulders for the various charge states separated by a mass difference of ~640 Da, suggests partial occupancy of an 8th pigment as BChlide a. BChlide a has never been reported or observed, however, in any FMO HPLC pigment analysis (5, 7, 10). A possible reason is that previous reverse-phase HPLC protocols always involve a high concentration of organic phase, in which case the BChlide a, even if it exists in the FMO protein, would elute from the column at the void volume together with the solvent front of aqueous buffers. To facilitate the detection of BChlide a or other pigments with a short tail, we used as a standard the pigment extract of a bchG mutant of Rhodobacter capsulatus (46), in which only BChilde a is accumulated. A detailed HPLC analysis of the FMO proteins (both AFMO and TFMO), indicates that there is no BChlide a in these proteins, as shown in Figure 3. Injection of the extracted BChlide a leads to an elution peak at 7.3 min, whereas the chromatogram of the AFMO extract shows a single peak at 26.8 min, which is due to BChl a. Although only chromatogram traces detected at 770 nm are shown in Figure 3, the whole range of the UV/Vis spectrum was monitored, and no additional peaks were observed. Different columns and different solvents (45–47) were also used, but no BChlide a or similar pigments were observed in the FMO protein.
Figure 3.

Pigment analysis of AFMO by HPLC. (A) Chromatogram of BChlide a extracted from the bchG mutant of Rhodobacter capsulatus. (B) Chromatogram of pigments from the AFMO protein. BChlide a eluted at 7.3 min, and BChl a eluted at 26.8 min.
Rationalization of the pigment analysis data
The discrepancy between the native ESI data (BChlide a as the 8th pigment) and the HPLC analysis (no BChlide a in FMO) can be resolved if the 8th BChl a pigment is susceptible to decompose by losing its phytyl tail during the relatively harsh desolvation in the native ESI. To test the possibility of fragmentation of the BChl a into BChlide a, we obtained the mass spectrum of purified BChl a itself under various desolvation conditions. When introduced by ESI, both a radical cation and a smaller amount of [M + H]+ were formed. This is not unexpected as metal-containing porphyrins are easily oxidized in the positive-ion mode of ESI (50). Fragmentation did occur to lose the phytyl chain, presumably as a 1,3-phytadiene (278 Da) under the harsher desolvation conditions, as shown in Figure 4B, whereas intact protonated BChl a was conserved under normal ESI conditions with the ISCID off, or at most at 20 V, and a collision energy of 10 eV in the collision cell (Fig. 4A). In the spectrum in Figure 4B, we cannot be certain whether the radical cation or the [M + H]+ is responsible for the fragmentation. Under atmospheric pressure chemical ionization conditions, however, an [M + H]+ is cleanly formed, and it does fragment by loss of the phytadiene (51). For the protein complex, we propose that in the ESI process, the 8th pigment becomes ionized, either by protonation or oxidation, promoting the loss of the phytadiene. Because each monomer of the trimer contains an 8th pigment, the ESI spectrum of the trimer shows the increments of 632 (BChlide a), rather than of 910 Da. We propose that the intrinsically weak ester bond connecting the phytyl group of BChl a is cleaved following a H+ or H• transfer to the ester bond.
Figure 4.
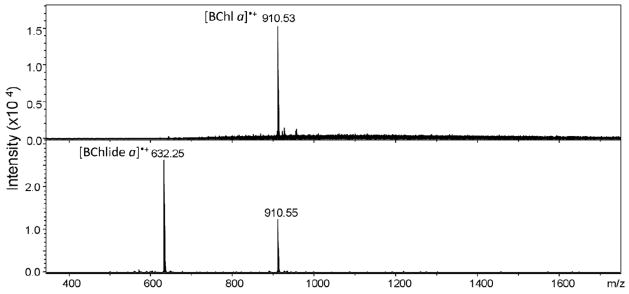
(A) The BChl a isolated from the FMO protein has a monoisotopic mass of 910.5 Da. No fragmentation occurs under normal ESI conditions with gentle desolvation. (B) BChl a is significantly fragmented under harsher desolvation conditions similar to that used in the native electrospray of the AFMO complex. The dominant ion of m/z = 632.2 is the fragment of the BChl a without the phytyl tail (i.e., protonated BChlide a).
The other 21 BChl a molecules in the FMO complex are more “sheltered” in the interior of the protein. Thus, fragmentation is a characteristic of only a surface BChl a with its flexible tail possibly extending from the surface. Such an orientation is understandable if the tetrapyrrole of the 8th BChl a is oriented such that ring D, to which the tail is connected, is exposed on the protein surface, as shown in the inset of Figure 1B. A flexible phytyl tail also explains why the tail cannot be resolved by protein crystallography.
Native electrospray of TFMO protein complex
The FMO protein from C. tepidum (TFMO) was extracted and purified using two different methods as described in the Methods section. Both the detergent-extracted TFMO protein (termed “TFMO_detergent”) and the Na2CO3-extracted TFMO protein (TFMO_Na2CO3) show similar four to five main charge states (+21 to +25) with two shoulder peaks on the low m/z side of each charge state when introduced to the mass spectrometer under native ESI conditions (Fig. 5A, 5B). The MWs deconvoluted from the main ion peaks and shoulders in the two samples are listed in Table 2. The simulated charge state distributions are also included in Figure 5A and 5B (solid vertical lines and arrows). From the deconvoluted MWs of the TFMO_detergent, the mass differences between the shoulder and peak ions are 644 and 676 Da, respectively. In the TFMO_ Na2CO3 case, the MW differences between the shoulder and peak ions are 656 and 700 Da, respectively. All the mass differences are slightly larger than the MW of BChlide a, which is again likely due to differential, incomplete desolvation.
Figure 5.

Mass spectra of intact TFMO complexes prepared by two different methods. (A) Intact TFMO complex extracted from the cytoplasmic membrane by detergent Anzergent 3–12 (termed “TFMO_detergent”). (B) Intact TFMO complex extracted from the membrane by Na2CO3 (“TFMO_Na2CO3”). Solid colored vertical lines (red, blue and green) and also the pink arrows are simulations of the theoretical charge distribution of the deconvolved molecular weights, respectively. (C) and (D) Expansion of the +22 to +24 charge states with the resolved shoulder peaks in each charge state simulated by Gaussian functions with band widths of m/z = 7 and 8 for the detergent and Na2CO3-extracted TFMO, respectively.
Table 2.
Theoretical and experimental mass of the TFMO_detergent and TFMO_Na2CO3 with 0–3 BChlide a
| # of 8th BChlide a | Theoretical Mass (Da) | Experimental Mass (Da) of TFMO_detergent | Δm3 (Da) | Experimental Mass (Da) of TFMO_Na2CO3 | Δm3 (Da) |
|---|---|---|---|---|---|
| 0 | 139,631 | 139,822 ± 120 | 191 | N/A | N/A |
| 1 | 140,264 | 140,466 ± 120 | 396 | 140,660 ± 200 | 202 |
| 2 | 140,897 | 141,142 ± 120 | 463 | 141,360 ± 200 | 245 |
| 3 | 141,530 | N/A | N/A | 142,016 ± 200 | 486 |
Δm is the mass difference between the Experimental Mass and the Theoretical Mass.
The fine structure of each charge state, however, is different from that of the AFMO complex and is dependent on the protein extraction and purification methods. As shown in Fig. 5C, 5D and also listed in Table 2, the MW determined from peak #2 (141,360 ± 200 Da) in the mass spectrum of intact TFMO_Na2CO3 is similar to that determined from the most abundant ion (#2) in the spectrum of intact TFMO_detergent (141,142 ± 120 Da). Both of these experimental MWs are similar to that of the TFMO trimer plus two additional putative BChlide a species (140,897 Da). The experimental MWs of TFMO_Na2CO3 and TFMO_detergent are different from the theoretical values by 463 and 245 Da, respectively. Similarly, the MW determined from ions corresponding to peak #1 in the spectrum of TFMO_Na2CO3 (140,660 ± 200 Da) and that for peak #1 of TFMO_detergent (140,466 ± 120 Da) are similar to the MW of the TFMO trimer with one additional putative BChlide a (140,264 Da), with mass differences of 396 and 202 Da, respectively. The region labeled 0 in the spectrum of TFMO_detergent has no corresponding peak in the spectrum of the TFMO_Na2CO3. The MW calculated for peak 0 is 139,822 ± 120 Da, which is within 191 Da of that of TFMO with no additional BChlide a (139,631 Da). We assign the main peak (#3) in the spectrum of TFMO_Na2CO3 to be the TFMO trimer with three additional BChlide a. The difference between the measured (142,016 ± 200 Da) and theoretical value (141,530 Da) is 486 Da.
Thus, successful assignments of the most abundant peaks in the mass spectrum of the TFMO_Na2CO3 point to a TFMO trimer with 21 BChl a plus three additional BChlide a species. The two shoulders on the low m/z side correspond to the trimer containing two and one additional BChlide a species. The dominant peaks in the spectrum of the TFMO_detergent sample correspond to the TFMO trimer with 21 BChl a plus two additional BChlide a, and the two shoulders on the low m/z side correspond to the trimer containing one or zero additional BChlide a. The Gaussian simulations with m/z bandwidths 8 and 7, respectively, account well for the experimental mass spectra of the TFMO_Na2CO3 and TFMO_detergent. The broader peak width needed to fit the spectrum of TFMO_Na2CO3 is in accord with less desolvation, as also indicated from the bigger differences between the deconvoluted experimental MWs and the theoretical values. Using the areas under Gaussian simulations, we calculate the occupancy of the 8th site in the TFMO_Na2CO3 and TFMO_detergent samples to be 80% and 65%, respectively.
Structural mass spectrometry with native electrospray
Mass spectrometry has a bias toward maintaining electrostatic interactions but weakening hydrophobic interfaces of protein complexes in the gas phase (39). Given that the stable and compact trimeric FMO is held together by electrostatic interactions, including salt bridges (5–8, 11), it can survive very high ISCID (52, 53) without dissociation. That the MWs are greater than the theoretical values is consistent with other reports that the MWs determined by native ESI are high owing to water or buffer molecules that remain attached to the complex in the gas phase. We found that the measured MW of the AFMO complex is approximately 200 Da greater than the theoretical value, and the MWs of TFMO_detergent and TFMO_Na2CO3 are approximately 200 and 400 Da, respectively, greater than expected. Presumably more solvent or salt adducts occur for the TFMO_Na2CO3 than for the TFMO_detergent ions.
Nature and stoichiometry of the 8th pigment
The native ESI mass spectra of AFMO, TFMO_Na2CO3 and TFMO_detergent clearly indicate the existence of an 8th pigment in this model antenna system. Although the mass difference is consistent with BChlide a as the 8th pigment, we know from extensive HPLC analysis (Fig. 3) that only BChl a is associated with the protein complex. To explain the discrepancy, we propose that the phytyl tail of the additional BChl a sticks out from the protein surface where it adopts flexible conformations that cannot be resolved by X-ray crystallography. Its protruding tail becomes a target of fragmentation making the phytyl chain a good leaving group. Consecutive losses of phytyl groups from the additional BChl a molecules explain the mass difference between ions corresponding to the shoulders to be approximately the mass of BChlide a.
Moreover, the occupancy of the 8th site is different in different FMO samples. For example, its occupancy in TFMO_detergent (~65%) is lower than that in TFMO_Na2CO3 (80%), consistent with the expectation that detergent will extract more BChl a from the 8th site and cause more to be lost during purification. Consequently, quantitative spectroscopic analyses of the purified FMO protein will be complicated by the partial loss of the 8th BChl a during the sample preparation. Native ESI and mass spectrometry will be a unique method to estimate the occupancy. Combining our results with those from the recent crystallography analyses (8, 11, 34), we believe the FMO protein in vivo probably has the 8th BChl a fully occupied.
Function of the 8th BChl a
In green sulfur bacteria, the photon energy absorbed by the giant chlorosome antenna complex is transferred through the FMO protein to the reaction center. The overall architecture of the photosystem ensuring the high energy-transfer efficiency is now beginning to be understood. Linear dichroism studies (54) and chemical labeling coupled with MS data (27) have established the orientation of the FMO protein on the membrane. The side of the protein containing BChl a3 faces the cytoplasmic membrane, and the side containing BChl a1 faces the chlorosome. The eighth BChl a is near the chlorosome, in a region that is the putative CsmA binding site of the FMO protein (25). The unique position and its close proximity to the chlorosome allow the 8th BChl a to play an important role in guiding the energy transfer from the chlorosome to the core pigments in the FMO. Recently, Schmidt am Busch and co-workers (55) calculated the site energy of the 8th BChl a and simulated the optical properties of the FMO protein that includes this new pigment. The results indicate that the 8th BChl a has the most blue-shifted site energy, which almost certainly provides the entrance point for energy transfer from the chlorosome to the core pigments of FMO.
In addition, both the native ESI mass spectrometry data and the recent crystallography results suggest a flexible tail of the 8th BChl a. The protruding tails of the 8th BChl a might also form in vivo interactions with the carotenoid or the tail of the BChl a in the baseplate (56, 57), and may play an important structural role of stabilizing the chlorosome and FMO complex, as shown in Fig. 6. Compared to the relatively weak binding between the chlorosome and the FMO, the interaction between the FMO and the RC is much stronger, accounting for the difficulty to remove completely the FMO from the RC. The molecular mechanism of such strong binding is unknown. The RC binding region that has been proposed from homology modeling (25) is very far from the 8th BChl and is unlikely to involve the tail of the pigment.
Figure 6.

Schematic of the photosystem from green sulfur bacteria. The chlorosome envelope is made of a lipid monolayer and chlorosomal proteins with BChl c aggregates enclosed. The baseplate is located at the bottom of the chlorosome and interacts with the FMO protein. The 8th BChl a (in red), and its tail sticks out of the protein surface and interacts with the baseplate. On the other side, the FMO transfers energy to the reaction center in the membrane.
In conclusion, the mass of the intact FMO complex is now measurable by native ESI mass spectrometry. The outcome confirms that the protein exists as a trimer, and more importantly, that an additional 8th pigment per monomer is present and that its occupancy and identity can be determined. New spectroscopic and theoretical calculations must now include this 8th BChl a in an improved picture to understand the photosynthetic energy transfer process in this model antenna system.
Supplementary Material
Acknowledgments
We thank Prof. Carl Bauer from Indiana Univ. for the gift of the Rb. capsulatus bchG mutant strain. We thank Drs. James Carrol and Justin Sperry from Pfizer for their support during the initial native electrospray test.
Abbreviations
- FMO
Fenna-Matthews-Olson bacteriochlorophyll a protein; C. tepidum, Chlorobaculum tepidum; P. aestuarii, Prosthecochloris aestuarii; P. phaeum, Pelodictyon phaeum
- AFMO
FMO protein purified from Prosthecochloris aestuarii
- TFMO
FMO protein purified from Chlorobaculum tepidum
- BChl a
bacteriochlorophyll a
- ESI
electrospray ionization
- MS
mass spectrometry
- OD
optical density
- CID
collision-induced dissociation
- ISCID
in-source collision-induced dissociation
- HPLC
high-performance liquid chromatography
- MW
molecular weight
Footnotes
This work was supported by U.S. Department of Energy Grant DE-FG02-7ER15846 to REB and National Centers for Research Resources of the National Institutes of Health Grant 2P41RR000954 to MLG. Additional support was provided by Merck; MLG is a consultant for Merck. This research is from the Photosynthetic Antenna Research Center (PARC), an Energy Frontier Research Center funded by the U.S. Department of Energy, Office of Science, Office of Basic Energy Sciences, via Grant DE-SC 0001035.
Supporting information available
A schematic picture of the Bruker Maxis Q-TOF instrument, mass spectra of the AFMO complex under different desolvation conditions, and mass spectra of the denatured AFMO and TFMO polypeptides and their deconvoluted molecular weights. This material is available free of charge via the Internet at http://pubs.acs.org.
References
- 1.Lewis NS. Toward cost-effective solar energy use. Science. 2007;315:798–801. doi: 10.1126/science.1137014. [DOI] [PubMed] [Google Scholar]
- 2.Barber J. Photosynthetic energy conversion: natural and artificial. Chem Soc Rev. 2009;38:185–196. doi: 10.1039/b802262n. [DOI] [PubMed] [Google Scholar]
- 3.Hambourger M, Moore GF, Kramer DM, Gust D, Moore AL, Moore TA. Biology and technology for photochemical fuel production. Chem Soc Rev. 2009;38:25–35. doi: 10.1039/b800582f. [DOI] [PubMed] [Google Scholar]
- 4.Nocera DG. Personalized energy: the home as a solar power station and solar gas station. Chem Sus Chem. 2009;2:387–390. doi: 10.1002/cssc.200900040. [DOI] [PubMed] [Google Scholar]
- 5.Li YF, Zhou W, Blankenship RE, Allen JP. Crystal structure of the bacteriochlorophyll a protein from Chlorobium tepidum. J Mol Biol. 1997;271:456–471. doi: 10.1006/jmbi.1997.1189. [DOI] [PubMed] [Google Scholar]
- 6.Tronrud DE, Schmid MF, Matthews BW. Structure and X-Ray amino acid sequence of a bacteriochlorophyll a protein from Prosthecochloris aestuarii refined at 1.9 A resolution. J Mol Biol. 1986;188:443–454. doi: 10.1016/0022-2836(86)90167-1. [DOI] [PubMed] [Google Scholar]
- 7.Fenna RE, Matthews BW. Chlorophyll arrangement in a bacteriochlorophyll protein from Chlorobium limicola. Nature. 1975;258:573–577. [Google Scholar]
- 8.Tronrud DE, Wen J, Gay L, Blankenship RE. The structural basis for the difference in absorbance spectra for the FMO antenna protein from various green sulfur bacteria. Photosynth Res. 2009;100:79–87. doi: 10.1007/s11120-009-9430-6. [DOI] [PubMed] [Google Scholar]
- 9.Tsukatani Y, Wen J, Blankenship RE, Bryant DA. Characterization of the FMO protein from the aerobic chlorophototroph, Candidatus Chloracidobacterium thermophilum. Photosynth Res. 2010;104:201–209. doi: 10.1007/s11120-009-9517-0. [DOI] [PubMed] [Google Scholar]
- 10.Wen J, Harada J, Buyle K, Yuan K, Tamiaki H, Oh-Oka H, Loomis RA, Blankenship RE. Characterization of an FMO variant of Chlorobaculum tepidum carrying bacteriochlorophyll a esterified by geranylgeraniol. Biochemistry. 2010;49:5455–5463. doi: 10.1021/bi1006805. [DOI] [PMC free article] [PubMed] [Google Scholar]
- 11.Larson CR, Seng C, Lauman L, Matthies HJ, Wen J, Blankenship RE, Allen JP. The three dimensional structure of the FMO protein from Pelodictyon phaeum and the implications for energy transfer. Photosynthesis Research. 2010;107:139–150. doi: 10.1007/s11120-010-9604-2. [DOI] [PubMed] [Google Scholar]
- 12.Brixner T, Stenger J, Vaswani HM, Cho M, Blankenship RE, Fleming GR. Two-dimensional spectroscopy of electronic couplings in photosynthesis. Nature. 2005;434:625–628. doi: 10.1038/nature03429. [DOI] [PubMed] [Google Scholar]
- 13.Cheng YC, Fleming GR. Dynamics of light harvesting in photosynthesis. Annu Rev Phys Chem. 2009;60:241–262. doi: 10.1146/annurev.physchem.040808.090259. [DOI] [PubMed] [Google Scholar]
- 14.Engel GS, Calhoun TR, Read EL, Ahn TK, Mancal T, Cheng YC, Blankenship RE, Fleming GR. Evidence for wavelike energy transfer through quantum coherence in photosynthetic systems. Nature. 2007;446:782–786. doi: 10.1038/nature05678. [DOI] [PubMed] [Google Scholar]
- 15.Panitchayangkoon G, Hayes D, Fransted KA, Caram JR, Harel E, Wen J, Blankenship RE, Engel GS. Long-lived quantum coherence in photosynthetic complexes at physiological temperature. Proc Natl Acad Sci USA. 2010;107:12766–12770. doi: 10.1073/pnas.1005484107. [DOI] [PMC free article] [PubMed] [Google Scholar]
- 16.Savikhin S, Zhou W, Blankenship RE, Struve WS. Femtosecond energy transfer and spectral equilibration in bacteriochlorophyll a protein antenna trimers from the green bacterium Chlorobium tepidum. Biophys J. 1994;66:110–113. doi: 10.1016/S0006-3495(94)80769-6. [DOI] [PMC free article] [PubMed] [Google Scholar]
- 17.Adolphs J, Renger T. How proteins trigger excitation energy transfer in the FMO complex of green sulfur bacteria. Biophys J. 2006;91:2778–2797. doi: 10.1529/biophysj.105.079483. [DOI] [PMC free article] [PubMed] [Google Scholar]
- 18.Louwe R, Vrieze J, Hoff A, TA Toward an integral interpretation of the optical steady-state spectra of the FMO-complex of Prosthecochloris aestuarii2 exciton simulations. J Phys Chem B. 1997;101:11280–11287. [Google Scholar]
- 19.Pearlstein R. Theory of the optical spctra of the bacteriochlorophyll a antenna protein trimer from Prosthecochloris aestuarii. Photosynth Res. 1992;31:213–226. doi: 10.1007/BF00035538. [DOI] [PubMed] [Google Scholar]
- 20.Renger T. Theory of excitation energy transfer: from structure to function. Photosynth Res. 2009;102:471–485. doi: 10.1007/s11120-009-9472-9. [DOI] [PubMed] [Google Scholar]
- 21.Milder MT, Bruggemann B, van Grondelle R, Herek JL. Revisiting the optical properties of the FMO protein. Photosynth Res. 2010;104:257–274. doi: 10.1007/s11120-010-9540-1. [DOI] [PMC free article] [PubMed] [Google Scholar]
- 22.Blankenship RE. Molecular mechanisms of photosynthesis. Blackwell Science; Oxford, UK: 2003. [Google Scholar]
- 23.Olson JM. The FMO protein. Photosynth Res. 2004;80:181–187. doi: 10.1023/B:PRES.0000030428.36950.43. [DOI] [PubMed] [Google Scholar]
- 24.Bryant DA, Costas AM, Maresca JA, Chew AG, Klatt CG, Bateson MM, Tallon LJ, Hostetler J, Nelson WC, Heidelberg JF, Ward DM. Candidatus Chloracidobacterium thermophilum: an aerobic phototrophic Acidobacterium. Science. 2007;317:523–526. doi: 10.1126/science.1143236. [DOI] [PubMed] [Google Scholar]
- 25.Wen J, Tsukatani Y, Cui W, Zhang H, Gross ML, Bryant DA, Blankenship RE. Structural model and spectroscopic characteristics of the FMO antenna protein from the aerobic chlorophototroph, Candidatus Chloracidobacterium thermophilum. Biochim Biophys Acta. 2010;1807:157–164. doi: 10.1016/j.bbabio.2010.09.008. [DOI] [PMC free article] [PubMed] [Google Scholar]
- 26.Müh F, Madjet MEA, Adolphs J, Abdurahman A, Rabenstein B, Ishikita H, Knapp EW, Renger T. alpha-Helices direct excitation energy flow in the Fenna-Matthews-Olson protein. Proc Natl Acad Sci USA. 2007;104:16862–16867. doi: 10.1073/pnas.0708222104. [DOI] [PMC free article] [PubMed] [Google Scholar]
- 27.Wen J, Zhang H, Gross ML, Blankenship RE. Membrane orientation of the FMO antenna protein from Chlorobaculum tepidum as determined by mass spectrometry-based footprinting. Proc Natl Acad Sci USA. 2009;106:6134–6139. doi: 10.1073/pnas.0901691106. [DOI] [PMC free article] [PubMed] [Google Scholar]
- 28.Nagy A, Prokhorenko V, Miller RJ. Do we live in a quantum world? Advances in multidimensional coherent spectroscopies refine our understanding of quantum coherences and structural dynamics of biological systems. Curr Opin Struct Biol. 2006;16:654–663. doi: 10.1016/j.sbi.2006.08.012. [DOI] [PubMed] [Google Scholar]
- 29.Read EL, Schlau-Cohen GS, Engel GS, Wen JZ, Blankenship RE, Fleming GR. Visualization of excitonic structure in the Fenna-Matthews-Olson photosynthetic complex by polarization-dependent two-dimensional electronic spectroscopy. Biophys J. 2008;95:847–856. doi: 10.1529/biophysj.107.128199. [DOI] [PMC free article] [PubMed] [Google Scholar]
- 30.Abramavicius D, Voronine DV, Mukamel S. Double-quantum resonances and exciton-scattering in coherent 2D spectroscopy of photosynthetic complexes. Proc Natl Acad Sci USA. 2008;105:8525–8530. doi: 10.1073/pnas.0802926105. [DOI] [PMC free article] [PubMed] [Google Scholar]
- 31.Ishizaki A, Fleming GR. Theoretical examination of quantum coherence in a photosynthetic system at physiological temperature. Proc Natl Acad Sci USA. 2009;106:17255–17260. doi: 10.1073/pnas.0908989106. [DOI] [PMC free article] [PubMed] [Google Scholar]
- 32.Rebentrost P, Mohseni M, Aspuru-Guzik A. Role of quantum coherence and environmental fluctuations in chromophoric energy transport. J Phys Chem B. 2009;113:9942–9947. doi: 10.1021/jp901724d. [DOI] [PubMed] [Google Scholar]
- 33.Sarovar M, Ishizaki A, Fleming GR, Whaley KB. Quantum entanglement in photosynthetic light-harvesting complexes. Nature Physics. 2010;6:462–467. [Google Scholar]
- 34.Ben-Shem A, Frolow F, Nelson N. Evolution of photosystem I - from symmetry through pseudosymmetry to asymmetry. FEBS Letters. 2004;564:274–280. doi: 10.1016/S0014-5793(04)00360-6. [DOI] [PubMed] [Google Scholar]
- 35.Liu T, Belov ME, Jaitly N, Qian WJ, Smith RD. Accurate mass measurements in proteomics. Chem Rev. 2007;107:3621–3653. doi: 10.1021/cr068288j. [DOI] [PMC free article] [PubMed] [Google Scholar]
- 36.Lu B, Xu T, Park SK, Yates JR., 3rd Shotgun protein identification and quantification by mass spectrometry. Methods Mol Biol. 2009;564:261–288. doi: 10.1007/978-1-60761-157-8_15. [DOI] [PubMed] [Google Scholar]
- 37.Yates JR, Ruse CI, Nakorchevsky A. Proteomics by mass spectrometry: approaches, advances, and applications. Ann Rev Biomed Eng. 2009;11:49–79. doi: 10.1146/annurev-bioeng-061008-124934. [DOI] [PubMed] [Google Scholar]
- 38.Heck AJ, Van Den Heuvel RH. Investigation of intact protein complexes by mass spectrometry. Mass Spectrom Rev. 2004;23:368–389. doi: 10.1002/mas.10081. [DOI] [PubMed] [Google Scholar]
- 39.Hernandez H, Robinson CV. Determining the stoichiometry and interactions of macromolecular assemblies from mass spectrometry. Nature Protocols. 2007;2:715–726. doi: 10.1038/nprot.2007.73. [DOI] [PubMed] [Google Scholar]
- 40.Loo JA. Electrospray ionization mass spectrometry: a technology for studying noncovalent macromolecular complexes. Int J Mass Spectrom. 2000;200:175–186. [Google Scholar]
- 41.Sobott F, Robinson CV. Protein complexes gain momentum. Curr Opin Struct Biol. 2002;12:729–734. doi: 10.1016/s0959-440x(02)00400-1. [DOI] [PubMed] [Google Scholar]
- 42.Franken EM, Amesz J. Electron transport and triplet formation in membrane fragments of the green sulfur bacterium Prosthecochloris aestuarii. Biochim Biophys Acta. 1997;1319:214–222. [Google Scholar]
- 43.Wahlund TM, Woese CR, Castenholz RW, Madigan MT. A thermophilic green sulfur bacterium from New Zealand hot springs, Chlorobium tepidum sp. nov. Arch Microbiol. 1991;156:81–90. [Google Scholar]
- 44.Zhang H, Cui W, Wen J, Blankenship RE, Gross ML. Native electrospray and electron-capture dissociation in FTICR mass spectrometry provide top-down sequencing of a protein component in an intact protein assembly. J Am Soc Mass Spectrom. 2010;21:1966–1968. doi: 10.1016/j.jasms.2010.08.006. [DOI] [PMC free article] [PubMed] [Google Scholar]
- 45.Addlesee HA, Hunter CN. Physical mapping and functional assignment of the geranylgeranyl-bacteriochlorophyll reductase gene, bchP, of Rhodobacter sphaeroides. J Bacteriol. 1999;181:7248–7255. doi: 10.1128/jb.181.23.7248-7255.1999. [DOI] [PMC free article] [PubMed] [Google Scholar]
- 46.Bollivar DW, Wang S, Allen JP, Bauer CE. Molecular genetic analysis of terminal steps in bacteriochlorophyll a biosynthesis: characterization of a Rhodobacter capsulatus strain that synthesizes geranylgeraniol-esterified bacteriochlorophyll a. Biochemistry. 1994;33:12763–12768. doi: 10.1021/bi00209a006. [DOI] [PubMed] [Google Scholar]
- 47.Frigaard NU, Voigt GD, Bryant DA. Chlorobium tepidum mutant lacking bacteriochlorophyll c made by inactivation of the bchK gene, encoding bacteriochlorophyll c synthase. J Bacteriol. 2002;184:3368–3376. doi: 10.1128/JB.184.12.3368-3376.2002. [DOI] [PMC free article] [PubMed] [Google Scholar]
- 48.Liepold L, Oltrogge LM, Suci PA, Young MJ, Douglas T. Correct charge state assignment of native electrospray spectra of protein complexes. J Am Soc Mass Spectrom. 2009;20:435–442. doi: 10.1016/j.jasms.2008.10.024. [DOI] [PMC free article] [PubMed] [Google Scholar]
- 49.McKay AR, Ruotolo BT, Ilag LL, Robinson CV. Mass measurements of increased accuracy resolve heterogeneous populations of intact ribosomes. J Am Chem Soc. 2006;128:11433–11442. doi: 10.1021/ja061468q. [DOI] [PubMed] [Google Scholar]
- 50.Van Berkel GJ, McLuckey SA, Glish GL. Electrospray ionization of porphyrins using a quadrupole ion trap for mass analysis. Anal Chem. 1991;63:1098–1109. [Google Scholar]
- 51.Verzegnassi L, Riffe-Chalard C, Gulacar FO. Rapid identification of Mg-chelated chlorins by on-line high performance liquid chromatography/atmospheric pressure chemical ionization mass spectrometry. Rapid Commun Mass Spectrom. 2000;14:590–594. doi: 10.1002/(SICI)1097-0231(20000415)14:7<590::AID-RCM917>3.0.CO;2-P. [DOI] [PubMed] [Google Scholar]
- 52.Breuker K, McLafferty FW. Stepwise evolution of protein native structure with electrospray into the gas phase, 10(−12) to 10(2) s. Proc Natl Acad Sci USA. 2008;105:18145–18152. doi: 10.1073/pnas.0807005105. [DOI] [PMC free article] [PubMed] [Google Scholar]
- 53.Weinmann W, Stoertzel M, Vogt S, Wendt J. Tune compounds for electrospray ionisation/in-source collision-induced dissociation with mass spectral library searching. J Chromatog A. 2001;926:199–209. doi: 10.1016/s0021-9673(01)01066-4. [DOI] [PubMed] [Google Scholar]
- 54.Melkozernov AN, Olson JM, Li YF, Allen JP, Blankenship RE. Orientation and excitonic interactions of the Fenna-Matthews-Olson Protein in membranes of the green sulfur bacterium Chlorobium tepidum. Photosynth Res. 1998;56:315–328. [Google Scholar]
- 55.Busch Schmidtam, Müh F, Mudget MEA, Renger T. The Eighth Bacteriochlorophyll Completes the Excitation Energy Funnel in the FMO Protein. J Phys Chem Lett. 2011;2:93–98. doi: 10.1021/jz101541b. [DOI] [PubMed] [Google Scholar]
- 56.Pedersen MO, Borch J, Hojrup P, Cox RP, Miller M. The light-harvesting antenna of Chlorobium tepidum: interactions between the FMO protein and the major chlorosome protein CsmA studied by surface plasmon resonance. Photosynth Res. 2006;89:63–69. doi: 10.1007/s11120-006-9081-9. [DOI] [PubMed] [Google Scholar]
- 57.Pedersen MO, Linnanto J, Frigaard NU, Nielsen NC, Miller M. A model of the protein-pigment baseplate complex in chlorosomes of photosynthetic green bacteria. Photosynth Res. 2010;104:233–243. doi: 10.1007/s11120-009-9519-y. [DOI] [PubMed] [Google Scholar]
Associated Data
This section collects any data citations, data availability statements, or supplementary materials included in this article.