Abstract
Slow changes in steady-state (resting) transmembrane potential (Vmem) of non-excitable cells often encode important instructive signals controlling differentiation, proliferation, and cell:cell communication. Probing the function of such bioelectric gradients in vivo or in culture requires the ability to track Vmem, in order to characterize endogenous patterns of differential potential, map out isopotential cell groups (compartments or cell fields), and confirm the results of functional perturbation of Vmem. The use of fluorescent bioelectricity reporters (FBRs) has become more common as continuing research and innovation have produced better and more options. These dyes are now used routinely for cell sorting and for studies of cultured cells. Important advantages over single cell electrode measurements are offered by dyes, including: (1) subcellular resolution, (2) the ability to monitor multicellular areas and volumes in vivo, (3) simplicity of use, (4) ability to measure moving targets, and (5) ability to measure over long time periods. Thus, FBRs are suitable for longitudinal studies of systems that change and move over time, for example, embryos. Existing protocols focus on measurements of rapid action potentials in cultured cells or neurons. This article describes a dye pair that can be used to measure resting Vmem in cultured cells and in vivo in Xenopus laevis embryos and tadpoles (and is readily applied to other model systems, such as zebrafish, for studies of developmental bioelectricity). It is assumed that the reader is fully familiar with the process and terminology of fluorescence microscopy.
MATERIALS
It is essential that you consult the appropriate Material Safety Data Sheets and your institution’s Environmental Health and Safety Office for proper handling of equipment and hazardous materials used in this protocol.
Reagents
CC2-DMPE (N-[6-chloro-7-hydroxycoumarin-3-carbonyl] dimyristoyl phosphatidyl ethanolamine; Invitrogen K1017)
Prepare a 5 mM stock solution in DMSO. The instructions in the package insert offer useful tips such as opening the bottle using a damp kimwipe, and sonicating. Aliquot to avoid freeze-thaw cycles, then store in the dark at −20°C. The stock will last for ~2 mo.
Cells, tissues, or organisms of interest and appropriate medium
DiBAC4(3) (bis-[1,3-dibutylbarbituric acid]trimethine oxonol; Invitrogen B438 or Biotium 61011)
Prepare a 1.9 mM (1 mg/mL) stock solution in DMSO and store in the dark at room temperature. This stock will last for 6 mo or more.
Dimethyl sulfoxide (DMSO)
Equipment
Centrifuge
Coverslips, 25 mm diameter round
Coverslips, 43×50 mm (for long observations)
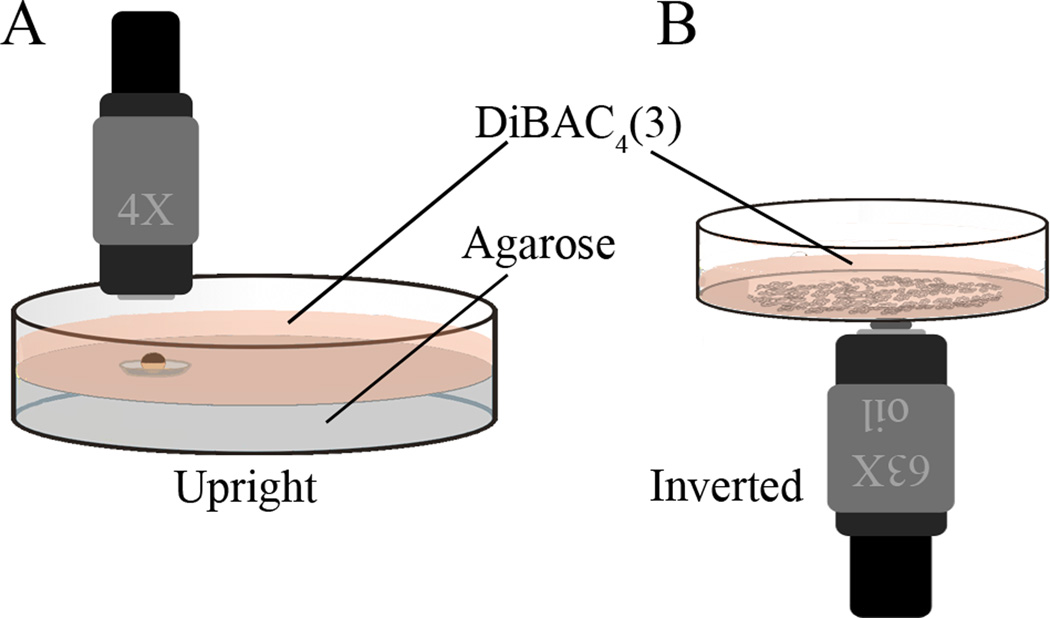
FluoroDishes, 35 mm (for in vitro cell culture; Fig. 1B)
Figure 1.
Dishes for imaging large specimens and cells in culture. (A) A Petri dish with a depression is useful for holding larger, or moving specimens. A convenient way to make these is to pour 2% agarose into a Petri dish; then, before the agarose starts to solidify, float the cap of a microcentrifuge tube, outside up, at the surface. The volume enclosed by the ridge underneath will hold a bubble of air. When the gel is solid, remove the cap and there will be a circular well the diameter of that internal ridge. The caps of 0.5 mL PCR tubes make a depression exactly big enough (5 mm in diameter) to hold seven Xenopus embryos. If shorter working distance lenses will be used, it is useful to fill the dish as high as possible with agarose so that the sample will be near the coverslip but still exposed to the DiBAC solution. (B) The bottom of a FluoroDish is made of coverslip glass, and thus is an excellent surface on which to grow cultured cells for this kind of imaging. If using an inverted microscope, the dish can simply be filled with DiBAC solution; for use on an upright scope, a round coverslip placed over the well will hold enough DiBAC solution for short term imaging with the dish turned upside down, although it should be remembered that it is a much smaller volume and thus bleaching may prove a problem.
Microcentrifuge tubes
Microscope with fluorescence optics and the following filter sets or their equivalents:
CC2-DMPE filter set: EX 405/20; BS 425; EM 460/50 (Chroma filter set 31016).
DiBAC4(3) EX 470/20; BS 485; EM517/23 (Chroma FITC filter set 41001)
Petri dishes
Software for image creation and correction
Viewing chamber (for long observations)
Prepare this by half-filling a 35-mm Petri dish with 2% agarose (made with the medium that will surround the cells), then removing a plug of agarose the size of the field of view (Fig. 1A).
Vortex mixer
METHOD
Add CC2-DMPE aliquots directly to medium for final concentration of 5µM (1:1000).
Vortex to distribute dye evenly.
- Use DiBAC4(3) at 47.5 µM (1:4000) for cell culture, and 0.95 µM (1:2000) for whole organisms (embryos, tadpoles).
- Pipette double the amount of dye needed into a microcentrifuge tube.
- Add the same amount of DMSO and vortex.
- Add at least the same volume of medium and vortex again.
- Centrifuge at 14,000 rpm for at least 10 min.
- Pipette off half the contents, being careful not to disturb the pellet, and add it to the medium.
- Centrifuge at 5000 rpm for 10 min. Use the supernate.
Incubate in CC2-DMPE in the dark for 30 to 60 min.
Wash the cells in plain medium once or twice.
Incubate in DiBAC4(3) for at least 30 min; do not remove the dye solution. For long term imaging (e.g., time lapse), fill the agarose viewing chamber with DiBAC4(3) solution. Add the specimens, then fill the dish until the meniscus is above the rim. Carefully seal the dish with the large coverslip.
Select the specimens that are expected to have the brightest DiBAC4(3) emission to set the exposure times. These will be the ones expected to be most depolarized.
Use a brightfield image to find, and do the initial focus of, the specimen.
Determine the proper exposure for DiBAC4(3) and for CC2-DMPE.
Move the slide a little to get away from the probably bleached section.
Correct the focus using the CC2-DMPE image (the DiBAC4(3) will bleach.)
Take the picture set (one picture each of the two dyes, and any other desired images, such as brightfield or differential interference contrast). If the exposures are good, continue. Otherwise, repeat Steps 10 to 12.
Once certain of the exposures, close the shutter so no light can reach the specimen and take a picture set at the chosen exposures. These are your DARKFIELD (DF) images.
Re-open the shutter and start a live image of the CC2-DMPE.
While watching the screen, move the stage so that there is no longer a specimen in view, then lower the stage until the image is out of focus – the result is a field with nothing in it, i.e. a “flat” field. Take a picture set. These are your FLATFIELD (FF) images. (You can actually take these images at any time; you will need an FF image for every exposure you use.)
Using brightfield, return to your specimen and refocus.
Focus again using the CC2-DMPE filter set.
Take a picture set.
Image correction (Step 19) can be postponed to a later time, but should be done with the same software that was used to create the images. That is because the image (i.e. the data) might be altered when moving between software packages.
- Correct the images. Each raw data image needs to be corrected using the image arithmetic function (meaning corresponding pixels in two images will be added, subtracted, etc., and a new image of the sum, difference, etc. will be generated; that is the corrected image.)
- Raw CC2 image – DF image = DF corrected CC2 image
- FF CC2 image – DF image = DF corrected FF CC2 image
- DF corrected CC2 image ÷ DF corrected FF CC2 image = CC2- data image
- Repeat Steps 19.i through 19.iii using DiBAC4(3) images.
- CC2 data image ÷ DiBAC4(3) data image = RATIO IMAGE or DATA
TROUBLESHOOTING
Problem (Step ): The signal to noise ratio is too low.
Solution: Electronic noise and other unavoidable imperfections in the equipment add error. Consider the following:
Perform DF and FF correction. These corrections are absolutely required. Error is significantly reduced by propagation through the process of division.
Varying incubation times and dye concentration may also improve your signal.
Problem (Step ): There are “sparkles” in the DiBAC4(3) image.
Solution: These are undissolved particles. Centrifuge the final DiBAC4(3) solution again (after Step 3.v above) at 3500g for 5 min.
Problem (Step ): Fluorescent signal fades.
Solution: Fluorescent dyes can be quenched (lose their ability to fluoresce) by bleaching, self-quenching, or other processes. Consider the following:
Using time lapse, image the time course of dye uptake and bleaching (control for the timing of imaging relative to staining). This will reveal whether the signal was there to begin with.
Titer the dye concentration in both directions (too much can lead to self-quenching), starting at the published concentration. Then use a concentration that responds appropriately in the range of Vmems you expect to be measuring.
To reduce bleaching, focus on your region of interest using a different, preferably longer wavelength. The first exposure of the region to the λex should be the one collected. Keep this constant throughout all the imaging (the FF image as well).
DISCUSSION
Background
This protocol was used by Vandenberg et al. (2011). It is a variation on the protocol given by Invitrogen for their FRET-based voltage sensor probes (VSPs), specifically, a combination of CC2-DMPE and DiSBAC2(3) (bis-[1,3-diethylthiobarbiturate]trimethine oxonol). After soaking, CC2-DMPE stays associated with the outer-leaflet of the plasma membrane (Kuznetsov et al. 2005). The DiBAC4(3), which only fluoresces in the microenvironment of a membrane, enters and exits the cell in response to the charge on the plasma membrane. As the inner leaflet becomes more negative (hyperpolarized), the anionic DiBAC4(3) leaves the cell and its signal decreases. Conversely, as the inner leaflet becomes more positive, more DiBAC4(3) enters, and the DiBAC4(3) signal gets more intense (brighter) (Maher et al. 2007). By monitoring the brightness of these two fluorophores, you can, with the appropriate corrections applied to the images, determine relative Vmem by analysis of the signals coming from the two fluorophores. For further background information, see General Principles for Measuring Resting Membrane Potential and Ion Concentration Using Fluorescent Bioelectricity Reporters<top067710> (Adams and Levin 2012).
Controls
The following controls should be performed.
Alter membrane voltage using ionophores (positive control for direction of change in fluorescence intensity). Hyperpolarization should lead to an increase in the brightness of the ratio.
Image undyed cells using identical parameters (control for autofluorescence and phototoxicity of excitation wavelength [λex]). Autofluorescence should look very different and much less intense than signal from the dyes.
Image cells with each of the dyes alone (control for unpredicted interaction between the dyes). Except with fluorescence resonance energy transfer (FRET) pairs, the emission should look the same with or without the presence of the other dye.
Grow embryos/cells in the dye (control for toxicity of the dye or an effect of the dye on physiology). Embryos/cells should live/grow normally.
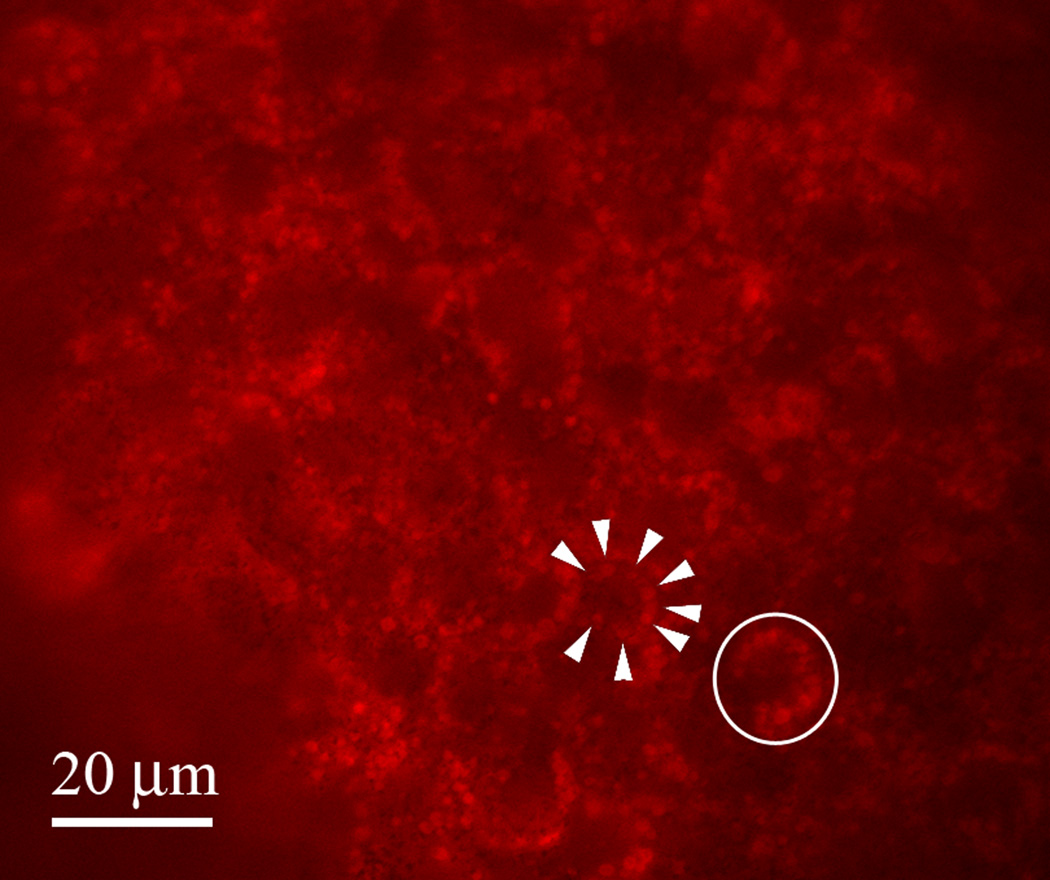
Image the cells with sufficient resolution to identify which membranes are emitting signal (control for source of fluorescent signal). Knowing which membranes are being measured will affect the interpretation (Fig. 2).
Figure 2.
Image of DiSBAC2(3) accumulation in cortical intracellular vesicles in the ectoderm of a Xenopus laevis embryo. Not all membranes are equal; thus a dye that accumulates in the plasma membrane of one cell type may accumulate in a different membrane of a different cell type. In this image, it is clear that the DiSBAC2(3) has accumulated in cortically located intracellular vesicles (arrowheads) of these ectodermal cells (single cell circled). The signal from these vesicles is very bright; thus it is not possible to use this dye for imaging the voltage of the plasma membrane of these cells. Scale bar = 20 μm.
Advantages of the System
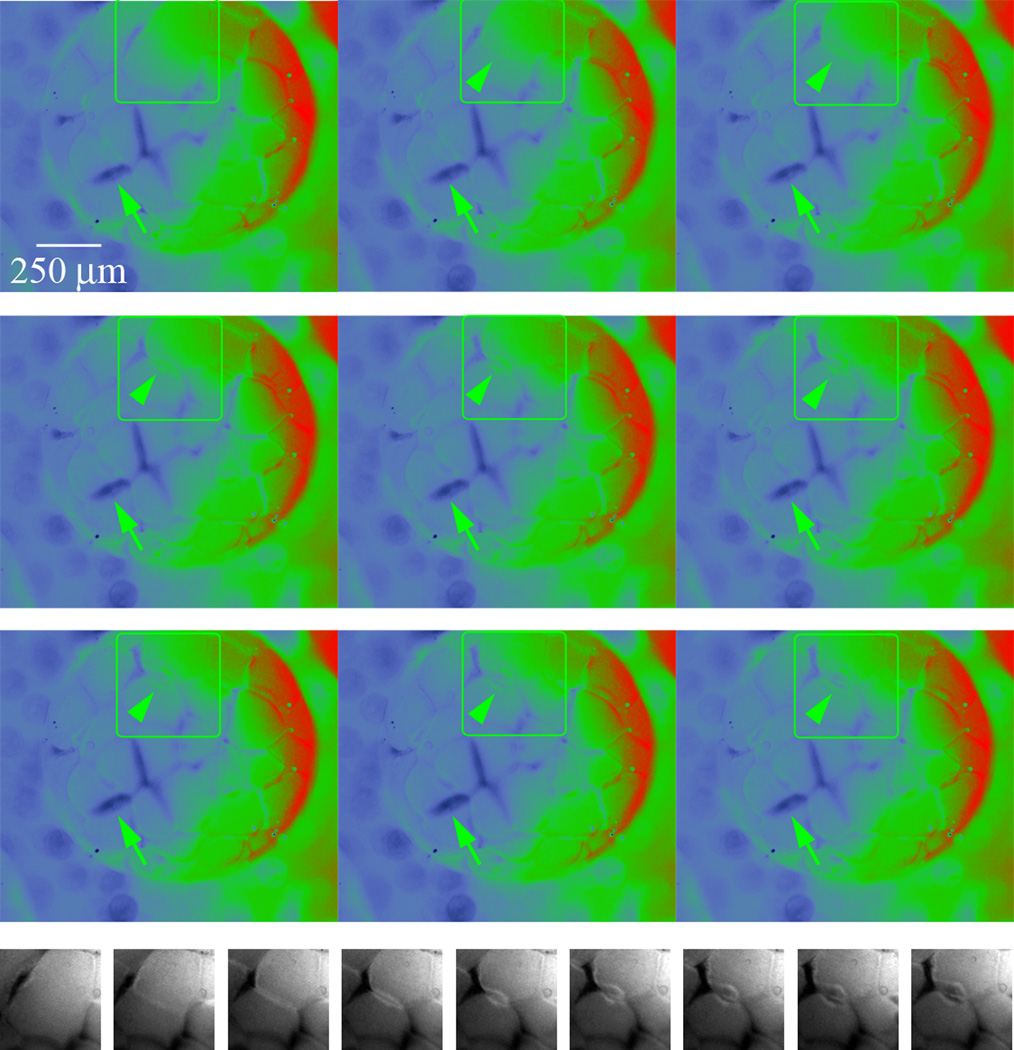
While direct measurement of Vmem using electrodes is still the gold standard and is still used for calibration of dyes, the advantages offered by using dyes promise to reveal critical new information about the electrophysiological state of the cell/tissue. Imaging over long time periods and with subcellular resolution has already revealed that, like neurons, non-excitable cells can have regional differences in membrane voltage (Fig. 3 and Fig. 4). Indeed, these cells can maintain regionalization of Vmem for minutes to hours. This raises the exciting possibility that electrophysiological signals between cells could be far more information rich due to variation in space as well as time. The coupling of dyes, such as that described here, is one way to improve the accuracy of the data over that collected by one dye alone; there are many more in the literature, FRET-based being the most advanced to date.
Figure 3.
Ratio images from a time-lapse recording of a Xenopus blastula undergoing cleavage. Nine frames from a DF and FF corrected time-lapse ratio video have been pseudocolored to emphasize the variation in Vmem across the embryo and across individual cells; red is relatively negative Vmem, blue is relatively positive Vmem. The areas in the green boxes are reproduced in a single line at the bottom in black and white. In addition to the relatively stable difference in Vmem of cells in different positions in the embryo, the variation of Vmem across the surface of individual blastomeres is striking, especially the relatively positive membrane associated with positions of cell-cell contact (green arrows). Illustrated in the black and white images is a typical pattern of changing Vmem in the new membrane that is inserted as the cleavage furrow forms. Initially, membrane at the cleavage furrow is relatively negative (lighter). As the furrow forms, relatively positive membrane (darker) is inserted, but the lighter negative membrane region is maintained for some time. Images are separated by 3 min.
Figure 4.

Three images of a culture of COS m6 cells before, during, and after depolarization. An example of control 1. The addition of high potassium (120 mM) PBS to the cultured mammalian cells depolarizes the membrane. This should cause the ratio of CC2 signal to DiBAC4(3) signal to become lower; thus the brightness of the signal should decrease. This is exactly what happened. For cells whose internal ion concentrations are known, the Goldman-Katz-Hodgkin1 equation (http://www.physiologyweb.com/calculators/ghk_equation_calculator.html) can be used to calibrate the dyes based on images like these taken at varying external potassium concentrations.
ACKNOWLEDGMENTS
We thank Punita Koustubhan and Amber Currier for Xenopus husbandry, William Baga for administrative help, Carter Erwin for technical support, and Brian Schneider for microscopy consultation. This work was supported by National Institutes of Health (NIH) grant GM078484, and the Telemedicine and Advanced Technology Research Center (TATRC) at the United States Army Medical Research and Materiel Command (USAMRMC) through award W81XWH-10-2-0058. M.L. is also grateful for the support of the G. Harold and Leila Y. Mathers Charitable Foundation. D.S.A. was supported by NIH grant K22-DE016633.
REFERENCES
- 1.Adams DS, Levin M. General principles for measuring resting membrane potential and ion concentration using fluorescent bioelectricity reporters. Cold Spring Harb Protoc. 2012 doi: 10.1101/pdb.top067710. [DOI] [PMC free article] [PubMed] [Google Scholar]
- 2.Kuznetsov A, Bindokas VP, Marks JD, Philipson LH. FRET-based voltage probes for confocal imaging: membrane potential oscillations throughout pancreatic islets. Am J Physiol Cell Physiol. 2005;289:C224–C229. doi: 10.1152/ajpcell.00004.2005. [DOI] [PubMed] [Google Scholar]
- 3.Maher MP, Wu N-T, Ao H. pH-Insensitive FRET voltage dyes. J Biomol Screen. 2007;12:656–667. doi: 10.1177/1087057107302113. [DOI] [PubMed] [Google Scholar]
- 4.Vandenberg LN, Morrie RD, Adams DS. V-ATPase-dependent ectodermal voltage and pH regionalization are required for craniofacial morphogenesis. Dev Dyn. 2011;240:1889–1904. doi: 10.1002/dvdy.22685. [DOI] [PMC free article] [PubMed] [Google Scholar]


