Abstract
Background
System redesign is described in one primary care trust (PCT)/clinical commissioning group (CCG) resulting in improved cardiovascular disease (CVD) management.
Aim
To evaluate CVD managed practice networks in one entire local health economy using practice networks, compared with PCTs in London, England, and local PCTs.
Design and setting
Observational study of 34 general practices in Tower Hamlets, a socially disadvantaged inner-London borough.
Method
In 2009, all 34 practices were allocated to eight geographical networks of four to five practices, each serving 30 000–50 000 patients. Each network had a network manager, administrative support, and an educational budget to deliver financially-incentivised attainment targets in four care packages of which CVD comprised one.
Results
In 2009/11, Tower Hamlets increased total statin prescribing (ADQ-STAR PU) by 17.9% compared with 5.5% in England (P<0.001). Key CVD indicators improved faster in Tower Hamlets than in England, London, or local PCTs, and in 2012/13, Tower Hamlets ranked top in the national Quality and Outcomes Framework for blood pressure and cholesterol control in coronary heart disease (CHD) and diabetes, top five for stroke and top in London for all these measures. Male mortality from CHD was fourth highest in England in 2008 and reduced more than any other PCT in the next 3 years; reducing by 43% compared with an average fall of 25% for the top 10 PCTs in 2008 ranked by mortality.
Conclusion
Managed geographical practice networks delivered a step-change in key CVD performance indicators in comparison with England, London, or similar PCT/CCGs.
Keywords: cardiovascular diseases, clinical decision support systems, disease management, general practice, health services, prescribing patterns
BACKGROUND
Tower Hamlets is an inner-London borough with one of the most deprived and ethnically diverse populations in the UK, of whom 46% are white, 35% South Asian mainly Bangladeshi, and 10% black African–Caribbean. It has one of the highest rates of premature cardiovascular death, ranking fourth in England with a standardised death rate for males 60% above average.1 Hospital admission rates for heart disease and stroke were similarly high, whereas in 2007/8 spending on primary care was in the lowest quintile nationally and total health spending ranked in the lower third: a contemporary illustration of the inverse care law.2,3
Cardiovascular disease (CVD) is the leading cause of preventable mortality and a priority for the NHS. Substantial reduction in CVD events over several decades has been associated with improvements in smoking cessation, reduction in saturated fats, and blood pressure, with medical care estimated to be responsible for 40% of this reduction.4 In 2004, the national Quality and Outcomes Framework (QOF) introduced financial incentives for general practice target attainment for CVD with rapid initial gains.5 From 2006, primary care trusts (PCTs) also supported ‘local enhanced services’ that paid individual practices for additional locally agreed targets for CVD and improved prescribing,6 including since 2010, national quality, innovation, productivity and prevention prescribing comparators.7 Secondary care has improved treatment including rapid 24-hour angioplasty for coronary syndromes and thrombolysis for stroke. The National Institute for Health and Care Excellence (NICE) guidance has reinforced the evidence base on which these improvements are based.
Over two decades, the three east London PCTs of Newham, City and Hackney, and Tower Hamlets have supported quality improvement by funding university-based academic GPs in the Clinical Effectiveness Group (CEG)8 to support quality initiatives locally, around a number of care pathways including CVD. Many of these improvement initiatives around CVD have been common to these three local PCTs, which perform above average for CVD quality indicators.
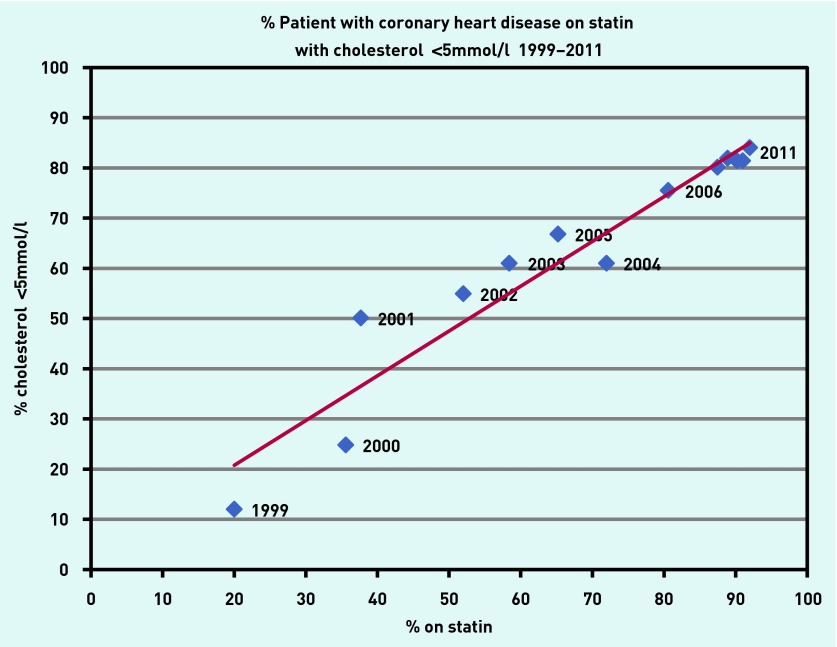
By 2008, Tower Hamlets PCT was already performing substantially better than average across a number of performance indicators in the QOF, ranking in the top 10% of PCTs for CVD indicators.9 In 2008, Tower Hamlets already had the highest rate of prescription of statins per capita in England. Prescription of statins for people with coronary heart disease (CHD) in Tower Hamlets had a linear impact on serum cholesterol targets based on GP electronic records without exception from 1999 to 2011 (Figure 1).10
Figure 1.
Proportion of coronary heart disease patients with blood pressure <150/90mmHg.
These initiatives form the complex background to improvement in CVD risk factors, which has been societal in scope and medically supported. However, despite large reductions in CVD outcomes an increase in obesity, sedentary behaviour, and type 2 diabetes has ensured that CVD remains the leading cause of ameliorable ill health associated with widening social inequity in outcome.11 Although doing relatively well, in 2008, east London PCTs still had more than one in five people with established CVD failing to achieve key targets in the context of the highest rates of CVD in the UK.
How this fits in
Attainment nationally in the Quality and Outcomes Framework indicators has levelled off. Managed practice networks in Tower Hamlets were associated with additional improvements in blood pressure and cholesterol control, improving at a faster rate than nationally, London, or local PCTs. Managed networks added value to existing methods of quality improvement including guidelines and education; decision support and patient recall; comparative performance feedback; and financial incentives.
With increases in NHS funding over the period to 2008, Tower Hamlets PCT invested in primary care to reduce ameliorable morbidity. Tower Hamlets PCT total spend per head of population increased from rank 117 of 151 English PCTs in 2007/8 to seventh in 2011/12.3 From 2009 the PCT spent an additional £10 million per annum in part to establish care packages for CVD, diabetes, chronic lung disease, and childhood immunisation delivered by managed practice networks, a new form of social organisation of primary care. The impact of practice networks on childhood immunisation and diabetes in Tower Hamlets has already been described elsewhere and the NHS checks programme will be described in a separate article.12,13
This paper describes a natural experiment in which Tower Hamlets performance for CVD indicators for CHD, stroke, hypertension, and diabetes from 2008 to 2012 were compared with England, London, and also the two neighbouring boroughs of City and Hackney, and Newham with similar populations with similar improvement initiatives (the same guidelines, education, and some aspects of IT support), but which did not adopt network working, retaining existing local enhanced services based on individual practices and their individual performance.
METHOD
In 2008/9, Tower Hamlets PCT provided additional funding of £10 million per annum for primary care services. In collaboration with the local medical committee representing local GPs, Tower Hamlets PCT established eight managed practice networks. Each practice was allocated to a network consisting of four to five practices located in the same geographical area to serve a local population of 30 000–50 000. Each network had a network manager, an administrative assistant, and an educational budget to support practices in their network to deliver four care packages: diabetes, childhood immunisation, chronic obstructive lung disease, and CVD. Approximately £2 million per annum was spent on network staff and educational resources. Network financial incentives replaced the earlier ‘local enhanced service’ incentives costing £1 million per network. These incentives were distributed on the basis of achieving network targets in contrast with the previous enhanced service schemes based on individual practice achievement, which were retained in the two local PCTs of Newham, and City and Hackney. Diabetes was the first care package implemented starting in 2008. Network incentive contracts for CVD began in April 2009, the network managers and the IT performance dashboards were in place in three networks by October 2009 and all eight networks were functioning by April 2010. In addition, three whole-time community specialist CVD nurses employed since 2006 to support local enhanced services, supported training for practice nurses and were aligned with the new targets, providing clinical care to some ‘off target’ patients in poorly performing practices.
The CVD care package consisted of four components: hypertension, stroke/transient ischaemic attack (TIA), CHD, and the NHS health check. Each component had network targets agreed by the local GP representatives. These included blood pressure <140/90mmHg for hypertension, stroke, and CHD; cholesterol <4mmol/l for CHD, stroke, and diabetes; and blood pressure <140/80mmHg for diabetes. Patients ‘off target’ were recalled more frequently using standardised recall searches in all practices. From April 2010 additional indices were added, and for people with CHD the proportion of people with new heart attacks reviewed at the GP surgery within 3 weeks of hospital discharge, attendance at cardiac rehabilitation, and recording of care plans were also incentivised. Other quality indicators including influenza vaccination were not incentivised. Practices in a particular network were paid if their combined network average exceeded the target, with payment pro rata based on attainment and practice patient numbers.
The following interventions were used to achieve network targets. Clinical guidelines were developed and published by the CEG.14 These supported each element of the CVD care package and were circulated to all practice staff in all three PCTs. These were reinforced at educational meetings centrally in all three PCTs, but only in Tower Hamlets within networks as clinical case discussion in multidisciplinary team meetings and at administrative target review meetings. A lead clinician in each network practice, worked with the network manager. More proactive clinicians acted as peer educators supporting staff in other practices within their network.
Practices in all three local PCTs used EMIS, a web-enabled computer system, which facilitated IT interventions. The CEG developed standard data entry templates used by all three local PCTs (template guides were available online).8 In Tower Hamlets these were further enhanced as monthly performance ‘dashboard’ reports for networks and practices, with ‘rag ratings’, charts, and trend lines to visually convey the comparative performance of each network and of individual practices within networks. Regular review of the dashboards took place at PCT level, network manager forums, and within networks, targeting additional support to practices that needed it and learning from successful teams. Standardised searches of electronic records improved recall of ‘off target’ patients so that they could then be contacted by letter or, if overdue, by telephone in their own language. Over the 3 years, the network managers collaborated to build up a sophisticated system of locally-tailored solutions, customising IT searches, register cleaning, patient recall tools, on-screen prompts, and support to poorly performing practices.
Networks customised searches to suit local arrangements, removing patients who had left or died and developing local on-screen prompts.
In this study, indices from the national Health and Social Care Information Centre QOF database without any ‘exception reporting’ were used to compare performance in Tower Hamlets with England, London, and local PCTs from 2004 to 2012/13.9,15 The differences in the slope of improvement (annual rate of increase) in the QOF data were compared in the 3 years before and after the start of the intervention in April 2009 for Tower Hamlets compared with England, London, and the local PCTs using logistic regression in STATA (version 11). Mortality data were taken from the Health and Social Care Information Centre portal without exceptions.16
Serum cholesterol and statin prescribing in Tower Hamlets for people with CHD were derived from the GP practice electronic records 1999–2011, and statin prescribing also from national Prescribing Analysis and Cost Tabulation (PACT) comparators 2013.17 The PACT data relate to all lipid-modifying drug prescription of which more than 90% are statins and relate to an age-standardised prescribing unit, Average Daily Quantity; Specific Therapeutic group Age-sex Related Prescribing Units (ADQ-STAR PU). The PCTs’ organisational spend was taken from NHS Networks — Health Investment Network.3 Data on care plans in people with CHD, review within 3 weeks of discharge after myocardial infarction, and cardiac rehabilitation attendance were obtained from the GP electronic record. Proportions were compared using χ2 tests.
RESULTS
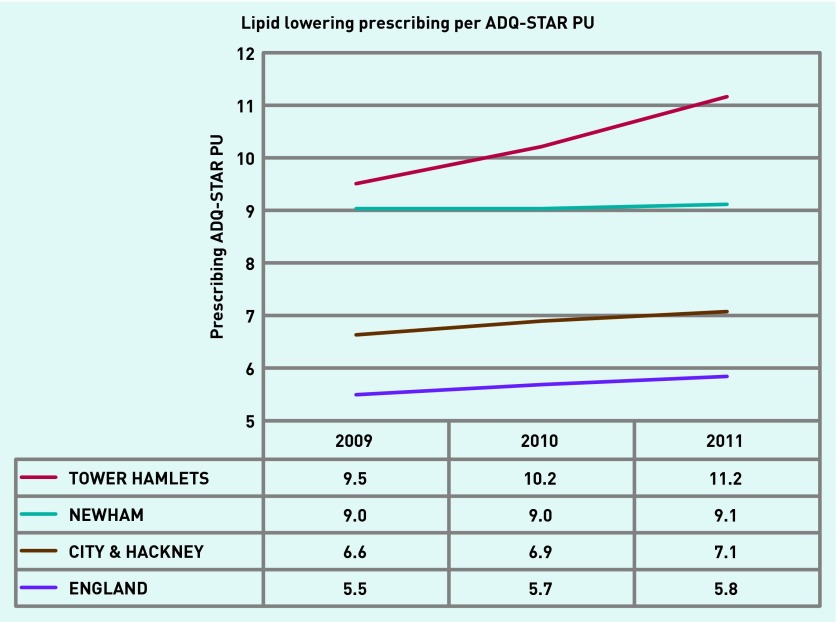
For patients with CHD in Tower Hamlets, there was a steady increase in the proportion prescribed statins over the decade 1999–2011 directly related to achieving target serum cholesterol <5mmol/l (Figure 1).10 In the period of network activity 2009–2012, the use of statins in Tower Hamlets continued to increase, whereas in other areas locally and nationally it levelled off. Tower Hamlets increased overall prescribing for lipid-modifying drugs (for primary and secondary indications) by 17.9%, 9.5 to 11.2 per ADQ-STAR PU 2009 2011, whereas England averaged a 5.5% increase, 5.5 to 5.8 ADQ-STAR PU, in this period (PACT data 2013).17 From 2009 to 2011 Tower Hamlets statin prescribing increased more than the other two local PCTs Newham, and City and Hackney: 1.7, 0.1 and 0.5 ADQ-STAR PU, respectively (P<0.01) (Figure 2).
Figure 2.
Lipid lowering prescribing per ADQ-STAR PU.
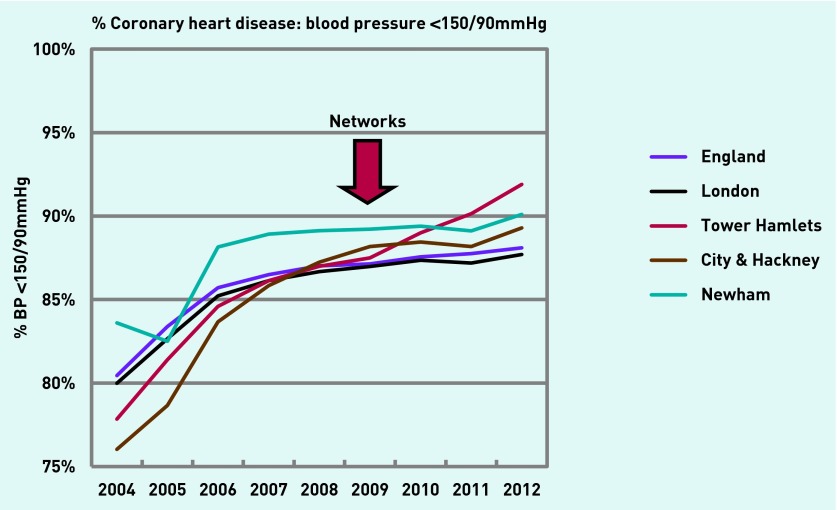
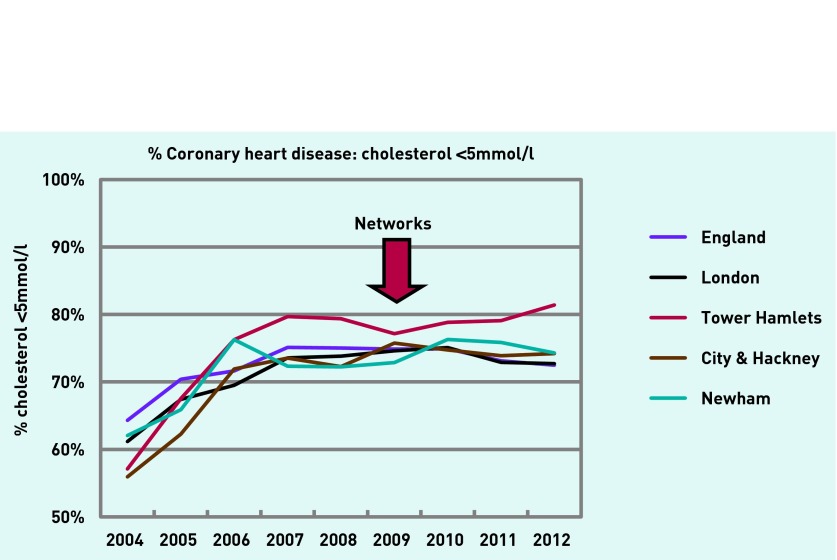
In 2012/13, QOF data (without exceptions) for serum cholesterol <5mmol/l and blood pressure <150/90mmHg ranked Tower Hamlets first out of 225 CCGs in England for both measures in CHD and diabetes, second and sixth respectively for stroke, and top in London on all measures. Improvement in Tower Hamlets took place at a faster rate than England, London, or comparable local PCTs after implementation of networks. Comparative cholesterol and blood pressure control for people with CHD is shown in Figures 3 and 4.
Figure 3.
Proportion of coronary heart disease patients with blood pressure <150/90mmHg.
Figure 4.
Proportion of coronary heart disease patients with cholesterol <5mmol/l.
Target serum cholesterol <5mmol/l for people with CHD in 2009–2012 in Tower Hamlets improved from 77.1% to 81.4% (4.3%), whereas in London and England the proportions declined; London 74.6% to 72.7% (−1.9%) and England 74.9% to 72.5% (−2.4%). The annual rate of increase in Tower Hamlets, 0.61%, was significantly greater in Tower Hamlets than England, −0.67%, and London, −0.40% (P<0.05).
For stroke, the proportion of people with serum cholesterol<5mmol/l improved in Tower Hamlets 2009–2011 from 70.3% to 74.8% (4.5%), in London 67.4% to 68.1% (0.7%), and in England 67.9% to 67.8% (−0.1%) (P<0.001).
For blood pressure control <150/90mmHg in all three domains, CHD, stroke, and hypertension, Tower Hamlets improved faster than London or England. For hypertension, from 2009 to 2012, blood pressure control in Tower Hamlets improved from 74.9% to 80.8% (5.9%); London 75.0% to 76.7% (1.7%); England 75.5% to 77.4% (1.9%). For stroke, blood pressure control in Tower Hamlets improved from 83.6% to 88.5% (4.9%); London 84.2% to 85.0% (0.8%); England 84.6% to 85.5% (1.1%). For CHD, blood pressure control in Tower Hamlets improved from 87.5% to 91.9% (4.4%); London 87.0% to 87.7% (0.7%); and England 87.1% to 88.1% (1.0%). All differences between Tower Hamlets and London or England were significant (P<0.001). The annual rate of change in Tower Hamlets, 1.24%, was significantly different from that in England, 0.28%, and London, 0.22% (P<0.001).
In 2012/13 for diabetes, blood pressure <140/80mmHg was 76.6% in Tower Hamlets, London 66.5%, and England 67.2%, and comparable targets were not available for 2009. For serum cholesterol <5mmol/l, attainment was 82.0% in Tower Hamlets, 73.1% in London, and 72.9% in England in 2012/13, compared with 2009 where the proportions were 77.9%, 73.9%, and 75.0%, respectively; changes of 4.1%, −0.8%, and −2.1% (P<0.001).
The proportion of people with CHD with a care plan 2011 to 2012 increased from 42.7% (1162/2718) to 61.6% (1697/2756). The proportion of people with a new heart attack seen by their GP within 3 weeks of discharge increased from 68.9% (113/164) in 2012 to 71.3% (166/227) in 2013. Attendances to cardiac rehabilitation decreased from 57/164 (34.8%) to 63/227 (27.7%), and there was no change in proportion given influenza vaccination (83%) in 2009–2012.
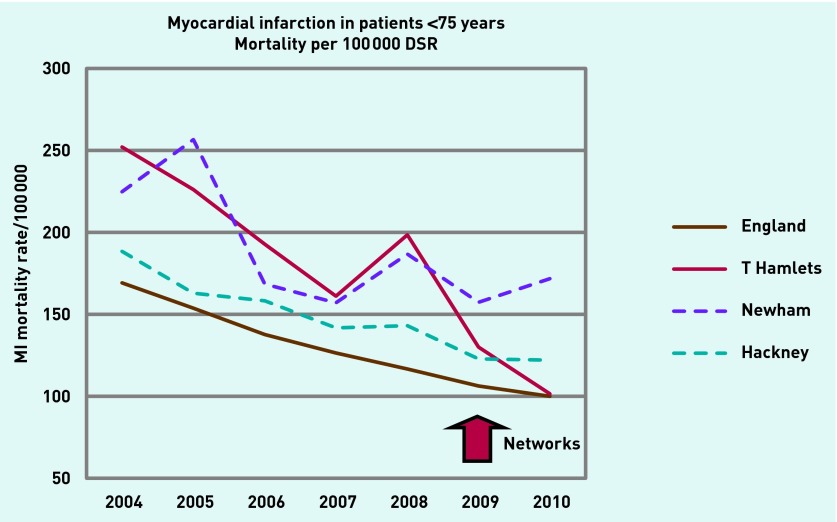
Tower Hamlets has shown a faster rate of decline in deaths from acute myocardial infarction in the 3 years since 2008, than local PCTs, London, or the national average. Male mortality from CHD in Tower Hamlets was fourth highest in England in 2008, and reduced substantially more than any other PCT in the next 3 years; a reduction of 43% compared with an average of 25% for the top 10 PCT in 2008 ranked by mortality.1 Figure 5 shows that mortality reduction from acute myocardial infarction in patients aged <75 years per 100 000 population directly standardised, has been more pronounced in Tower Hamlets with increasing divergence from local areas since 2009.
Figure 5.
Myocardial infarction mortality in patients aged <75 years per 100 000 directly standardised.
DISCUSSION
Summary
Networks are already widely used for supporting specific services or research and selected GP practices work collaboratively as companies or as federated groups.18 However, this is the first example of general practice-managed networks applied specifically to unselected geographical groups of general practices in an entire local primary healthcare economy, contracted to deliver specific care packages and improve service provision.
Strengths and limitations
Tower Hamlets has a ‘home advantage’. GP practices, the PCTs/CCGs in Newham, Hackney, and Tower Hamlets, and the university-based CEG, have worked collaboratively over two decades, building improvement on evidence, best practice, and good relationships to achieve above average performance in challenging circumstances. The cumulative impact on the practices and the PCT over time is difficult to quantify, but has helped build a legacy of trust for more radical innovations such as the networks.
A single web-enabled IT system was used by all but four of the practices in the three PCTs, which meant that templates could be downloaded centrally, permitting high-quality coded data entry and care pathway support including integrated web-links to guidelines, decision support, on-screen prompts, register ‘cleaning’, recall lists, and performance dashboards. CCGs with more fragmented systems may find IT support more complex, although the programme and IT were adapted in the four practices with a different computer system.
Comparison with existing literature
Long-established enablers were utilised for improvement, aligning educational enablers and guidance, real-time IT, clinician feedback, targets, and incentives. Similar mechanisms have been used by the better-performing American organisations such as Kaiser Permanente.19 The QOF results for blood pressure control in diabetes (with exceptions) in east London, 81%, are better than those in the 2012 HEDIS (Healthcare Effectiveness Data and Information Set) report for the average American providers (68%), and as good as Kaiser who do not include the uninsured.20
Implications for research and practice
This study describes the step-change in improvement in Tower Hamlets after 2009, which resulted in a widening divergence in performance between Tower Hamlets and the England and London averages, including an 8.9% absolute difference in cholesterol control in CHD and 9.4% in diabetes blood pressure control in 2012/13. The other two local PCTs supported by the CEG also did better than average, but the additional improvements in Tower Hamlets were all driven by practice networks and were unlikely to have been achieved without this method of working.
Mortality from myocardial infarction in Tower Hamlets has been falling rapidly for more than a decade. Any impact of improvement in care on outcomes such as mortality from CVD is difficult to assess and is speculative. East London is notable for demographic shifts and fewer immigrants are now entering Tower Hamlets, moving instead to cheaper housing further east, while more affluent residents move in, which is likely to reduce mortality. Behavioural change and percutaneous interventional cardiology have also had an impact, as have the widespread adoption of effective treatments to reduce cholesterol and blood pressure. The NHS health checks (not described in this article) also have been successfully implemented in Tower Hamlets with half of those identified at high CVD risk being prescribed statins. As a result of the networks, the further control of CVD risk factors in an additional 10% of people at highest risk, will also impact on the reductions in mortality from acute myocardial infarction after 2009.
The delegation of responsibility to networks combined with the resources for complex organisational change was a key element in the success. The elements of the network improvement were then synergistic.21 These consisted of high-quality guidelines and education including peer-to-peer knowledge transfer and facilitation; improved IT support for accurate patient recall, data entry, and decision support; and real-time reporting of comparative results and network financial incentives.
The networks were adaptive over the 3 years and built on existing practice strengths with responsive support for practices having difficulty with delivery. They were innovative, developing locally-tailored recall searches to identify patients spending extended periods abroad, searches to improve prevalence and register size, and local training of healthcare assistants and nurses. In particular the network managers had a monthly prospective overview of practice variation, procedures, and the problems that arose in implementing a complex new programme. Together with clinical and technical staff from the CEG, the network managers acted as facilitators to respond to individual and collective issues that arose: the enabling glue that provided local coherence and established trust. The network managers worked collaboratively and competitively to improve services and proved to be an articulate and cohesive force for practice support and change, learning from the best while supporting those having difficulty.22,23 Peer-to-peer support and education, including local multidisciplinary network meetings which included specialist nurse and consultant input, were also features.
The geographical units are coterminous with the local authority local area partnerships. Networks/clusters building on this example are being developed in neighbouring Newham and South Wales with network size a subject of discussion. Practice networks are used for commissioning by Birmingham and other CCGs. Geographical practice networks have also been a feature in Alberta, Canada, indicating that such methods may be generalisable in a number of settings including more dispersed populations.24
In 2013, network funding has survived transition to CCGs and cuts in funding. In fact Tower Hamlets CCG has now adapted the networks for a wider range of services including integrated complex care. The programme is highly popular and perceived as successful by GP practices and commissioners, representing one small step to address the inverse care law.
Acknowledgments
Practice networks and this evaluation are entirely predicated on the work of GPs, practice nurses, clerical staff, healthcare assistants, network and practice managers, and PCT administrators and public health personnel in City and Hackney, and Newham, and we are grateful for their continuing support. The CEG provided local data for this evaluation.
Funding
This research received no specific funding. The principle investigator and Clinical Effectiveness Group (CEG) staff supporting this programme were funded by Newham, City and Hackney, and Tower Hamlets primary care trusts/clinical commissioning groups.
Ethical approval
Not applicable.
Provenance
Freely submitted; externally peer reviewed.
Competing interests
John Robson, Sally Hull and Kambiz Boomla are all GPs in practices that have benefited from the network services and the CEG which employs them at Queen Mary University of London, is funded by the three local PCTs. All three have advised the PCTs/CCGs on policy and implementation pertaining to practice networks.
Discuss this article
Contribute and read comments about this article: www.bjgp.org/letters
REFERENCES
- 1.Public Health England 2012 Health profiles. Early deaths: heart disease and stroke. http://www.apho.org.uk/resource/view.aspx?RID=116446 (accessed 17 Mar 2014).
- 2.South East Public Health Observatory CVD e-atlas. 2011. http://www.sepho.org.uk/NationalCVD/atlas/atlas.html SEPHO (accessed 17 Mar 2014).
- 3.Health Investment Network 2003–04 to 2011–12 Programme Budgeting PCT Benchmarking Tools. http://www.networks.nhs.uk/nhs-networks/health-investment-network (accessed 17 Mar 2014).
- 4.Capewell S, O’Flaherty M. What explains declining coronary mortality? Lessons and warnings. Heart. 2008;94(9):1105–1108. doi: 10.1136/hrt.2008.149930. [DOI] [PubMed] [Google Scholar]
- 5.Roland M. Linking physicians’ pay to the quality of care — a major experiment in the United Kingdom. N Engl J Med. 2004;351(14):1448–1454. doi: 10.1056/NEJMhpr041294. [DOI] [PubMed] [Google Scholar]
- 6.Duerden M, Millson D, Avery A, Smart S. The quality of GP prescribing. London: The King’s Fund; 2011. [Google Scholar]
- 7.NHS Prescription Services QIPP Prescribing Comparators. http://www.nhsbsa.nhs.uk/PrescriptionServices/3332.aspx (accessed 6 Apr 2014).
- 8.Clinical Effectiveness Group The clinical effecvtiveness group works to support clinical improvement in primary care. http://blizard.qmul.ac.uk/ceg-home.html (accessed 4 Apr 2014).
- 9.QOF Database Tower Hamlets PCT. http://www.gpcontract.co.uk/browse/5C4/Coronary%20heart%20disease/8 NHS (accessed 17 Mar 2014).
- 10.Robson J. CEG longitudinal report. 2009. http://blizard.qmul.ac.uk/ceg-resource-library/ceg-reports/cat_view/15-reports/18-data-reports.html (accessed 5 Apr 2014).
- 11.Murray CJ, Richards MA, Newton JN, et al. UK health performance: findings of the Global Burden of Disease Study 2010. Lancet. 2013;381(9871):997–1020. doi: 10.1016/S0140-6736(13)60355-4. [DOI] [PubMed] [Google Scholar]
- 12.Cockman P, Dawson L, Mathur R, Hull S. Improving MMR vaccination rates: herd immunity is a realistic goal. BMJ. 2011;343:d5703. doi: 10.1136/bmj.d5703. [DOI] [PubMed] [Google Scholar]
- 13.Hull S, Chowdhury TA, Mathur R, Robson J. Improving outcomes for patients with type 2 diabetes using general practice networks: a quality improvement project in east London. BMJ Qual Safe. 2014;23:171–176. doi: 10.1136/bmjqs-2013-002008. [DOI] [PubMed] [Google Scholar]
- 14.CEG Clinical Effectiveness Group: Clinical guidelines. http://blizard.qmul.ac.uk/ceg-resource-library.html (accessed 6 Apr 2014).
- 15.Health & Social Care Information Centre Quality and Outcomes Framework GP practice results. http://qof.hscic.gov.uk/index.asp HSCIC (accessed 17 Mar 2014).
- 16.HSCIC Health & Social Care Information Centre. http://www.hscic.gov.uk HSCIC (accessed 17 Mar 2014).
- 17.NHS Prescription Services ePACTnet. http://www.nhsbsa.nhs.uk/3230.aspx NHS Business Services Authority (accessed 17 Mar 2014).
- 18.Ferlie E, Fitzgerald L, Fitzgerald L, et al. Networks in health care: a comparative study of their management, impact and performance. Report for the National Institute for Health Research Service Delivery and Organisation programme. http://www.academia.edu/attachments/31109588/download_file?st=MTM5Njk2NzYxMCwyMTMuMjE5LjUzLjcw&ct=MTM5Njk2NzYxMQ%3D%3D (accessed 4 Apr 2014).
- 19.McKinsey What health systems can learn from Kaiser Permenante? http://www.mckinsey.com/insights/health_systems_and_services/what_health_systems_can_learn_from_kaiser_permanente_an_interview_with_hal_wolf (accessed 4 Apr 2014).
- 20.California Department of Health Care Services 2012 HEDIS Aggregate Report Report for the Medi-Cal Managed Care Program. www.dhcs.ca.gov/dataandstats/reports/Documents/MMCD_Qual_Rpts/HEDIS_Reports/CA2012_HEDIS.pdf (accessed 9 Apr 2014).
- 21.Rhydderch M, Elwyn G, Marshall M, Grol R. Organisational change theory and the use of indicators in general practice. Qual Saf Health Care. 2004;13(3):213–7. doi: 10.1136/qshc.2003.006536. [DOI] [PMC free article] [PubMed] [Google Scholar]
- 22.Baskerville NB, Liddy C, Hogg W. Systematic review and meta-analysis of practice facilitation within primary care settings. Ann Fam Med. 2012;10(1):63–74. doi: 10.1370/afm.1312. [DOI] [PMC free article] [PubMed] [Google Scholar]
- 23.Laferriere D, Liddy C, Nash K, Hogg W. Navigating change: how outreach facilitators can help clinicians improve patient outcomes. J Am Board Fam Med. 2012;25(2):232–237. doi: 10.3122/jabfm.2012.02.110192. [DOI] [PubMed] [Google Scholar]
- 24.Jacobs P, Moffat J, Rappaport J, Bell N. Primary care economics. Edmonton, AB: Institute of Health Economics; 2010. [Google Scholar]


