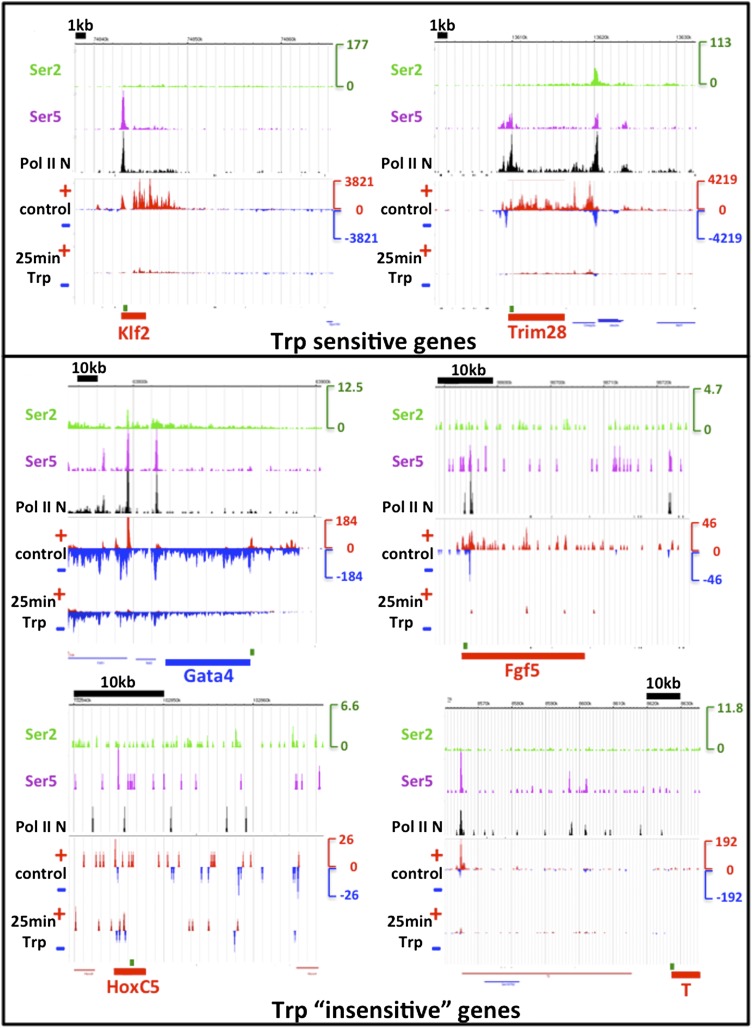
Author response image 2. TFIIH sensitivity.
The genes assayed by ChIP-qPCR of Ser5 phosphorylated Pol II in Figure 5F of Tee et al. Cell 2014 were examined. In the top box, two Trp sensitive control genes taken from this figure are shown, and in the bottom box, four examples of Trp “insensitive” genes are displayed. The tracks shown are Ser2 (green), Ser5 (purple) and N-terminal Pol II (black) ChIP-seq datasets from Rahl et al. 2010 Cell. The y-axis in RPKM is identical for the three ChIP-seq tracks. Below, the control DMSO and 25 min Trp treated GRO-seq datasets are displayed, with the sense strand in red and the antisense strand in blue. The y-axis for the GRO-seq data is in red and blue also and identical for both GRO-seq datasets, but different from the ChIP-seq y-axis due to different normalization done with Spike-in control instead of total reads as with ChIP-seq. Location of the genes is shown in red or blue at the bottom of each screenshot, and the location of the qPCR amplification product, as reported by Tee et al., is shown in green above the gene. Note that the Trp sensitive control genes Klf2 and Trim28 are over ∼10x higher expressed than the Trp “insensitive” developmental genes. The expression as measured by both GRO- and ChIP-seq of the HoxC5 and T genes was negligible. Despite the low activity of the developmental genes Gata4 and Fgf5, a Trp dependent block of initiation and loss of transcription after 25 min Trp treatment could clearly be detected.

