

Abstract
The epithelial-to-mesenchymal transition (EMT) transcriptional program is characterized by repression of E-cadherin (CDH1) and induction of N-cadherin (CDH2), and mesenchymal genes like vimentin (VIM). Placenta-specific 8 (PLAC8) has been implicated in colon cancer; however, how PLAC8 contributes to disease is unknown, and endogenous PLAC8 protein has not been studied. We analyzed zebrafish and human tissues and found that endogenous PLAC8 localizes to the apical domain of differentiated intestinal epithelium. Colon cancer cells with elevated PLAC8 levels exhibited EMT features, including increased expression of VIM and zinc finger E-box binding homeobox 1 (ZEB1), aberrant cell motility, and increased invasiveness. In contrast to classical EMT, PLAC8 overexpression reduced cell surface CDH1 and upregulated P-cadherin (CDH3) without affecting CDH2 expression. PLAC8-induced EMT was linked to increased phosphorylated ERK2 (p-ERK2), and ERK2 knockdown restored cell surface CDH1 and suppressed CDH3, VIM, and ZEB1 upregulation. In vitro, PLAC8 directly bound and inactivated the ERK2 phosphatase DUSP6, thereby increasing p-ERK2. In a murine xenograft model, knockdown of endogenous PLAC8 in colon cancer cells resulted in smaller tumors, reduced local invasion, and decreased p-ERK2. Using MultiOmyx, a multiplex immunofluorescence-based methodology, we observed coexpression of cytosolic PLAC8, CDH3, and VIM at the leading edge of a human colorectal tumor, supporting a role for PLAC8 in cancer invasion in vivo.
Introduction
Placenta-specific 8 (PLAC8), previously called Onzin, is a 115–amino acid, cysteine-rich protein first identified in human dendritic cells (1). By in situ hybridization (ISH), Plac8 expression is highly expressed in giant trophoblasts and the spongiotrophoblast layer in mouse placenta (2). Subsequently, Plac8 mRNA expression was observed in myeloid and lymphoid cells, as well as in epithelial cells in the lung and intestine (3). Plac8-deficient mice have defects in innate immunity (3) and exhibit contact hypersensitivity (4), impaired brown and white fat differentiation, and late-onset obesity (5, 6). In addition, Plac8 transcripts are upregulated in immortalized mouse colonocytes transformed by combined mutant H-ras and p53 (7). Knockdown of endogenous Plac8 in these cells and in a human colorectal cancer (CRC) cell line, HT-29, reduces growth of xenografts in nude mice (7). Although PLAC8 has important roles in normal physiology, and a possible role in CRC, its molecular function(s) and the cellular distribution of endogenous protein have not been studied.
Epithelial-to-mesenchymal transition (EMT) is a complex developmental process that drives key morphogenetic events, such as gastrulation and neural crest migration. During the process of EMT, cohesive epithelial cells undergo a loss of apicobasal polarity and cell-cell contact, while acquiring mesenchymal characteristics, enabling them to move as individual cells (8–11). EMT is thought to be a transcriptional program involving repression of CDH1 and concomitant induction of CDH2 and mesenchymal genes like VIM (12–14). In carcinoma, there appears to be inappropriate activation of the EMT program, whereby tumor cells become mesenchymal-like, enabling them to delaminate from the primary tumor and invade locally (15–18).
Herein, by combined analysis of zebrafish and human tissues, we show that PLAC8 protein is present in normal intestine, where it localizes to the apical domain of differentiated intestinal epithelium. However, PLAC8 is upregulated and cytosolic in medullary and mucinous CRC, and cytosolic PLAC8 correlates with tumor progression and tumor grade. Overexpression of PLAC8 in a human CRC cell line, HCA-7, results in morphological, molecular, and functional features of EMT. Unlike in classical EMT, there is post-transcriptional reduction in cell surface CDH1 and no change in CDH2; however, there is a cadherin switch with transcriptional upregulation of CDH3, a cadherin previously linked to colon cancer progression (19–21). PLAC8-overexpressing HCA-7 cells exhibit elevated levels of phosphorylated ERK2 (p-ERK2), previously shown to induce EMT (22). We show that PLAC8 selectively binds and inhibits the enzymatic activity of dual-specificity phosphatase 6 (DUSP6), an ERK2 phosphatase (23), thereby increasing p-ERK2 and leading to an unconventional EMT.
Results
Endogenous PLAC8 protein localizes to the apical domain of terminally differentiated human colonic epithelium.
Plac8 expression increases in immortalized mouse colonocytes transformed by mutant H-ras and p53, and Plac8 knockdown reduces tumor growth in xenografts (7). However, how PLAC8 contributes to colonic neoplasia is unknown. To address the role of PLAC8 in CRC, we examined its distribution in both normal and neoplastic human colon by immunofluorescence using a commercial PLAC8-specific polyclonal antibody. PLAC8 was found exclusively at the apical domain of fully differentiated normal colonic epithelium in both colonocytes (Figure 1, A and B) and goblet cells (Supplemental Figure 1, A and B; supplemental material available online with this article; doi: 10.1172/JCI71103DS1). We observed abrupt loss of PLAC8 immunoreactivity in epithelial cells deeper in the crypt (Figure 1, A and B) and absence of PLAC8 staining at the crypt base (Supplemental Figure 1, C and D). Staining was also observed in some scattered mononuclear cells in the stroma (A. Powell and R. Coffey, unpublished observations).
Figure 1. PLAC8 immunofluorescence in normal and neoplastic human colon.
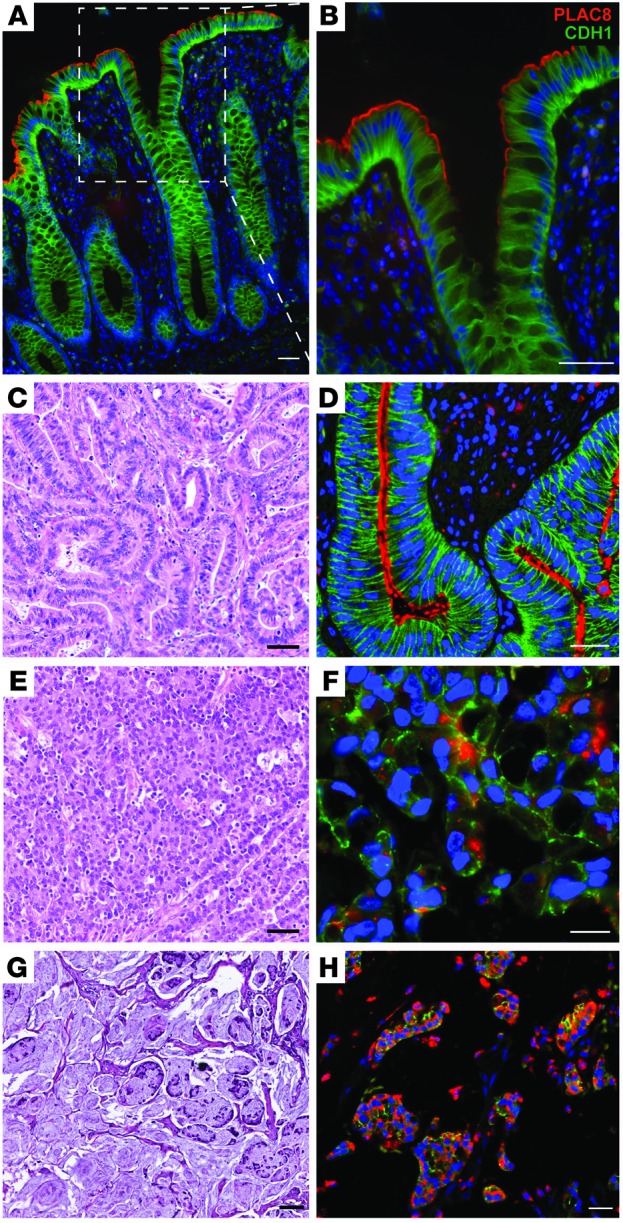
(A and B) In normal colon, PLAC8 immunofluorescence (red) localizes to the apical domain of the differentiated colonic epithelium at the top of crypts. The boxed region in A is magnified in B. Epithelial cells are outlined by CDH1 immunofluorescence (green). (D) In a typical moderately differentiated adenocarcinoma (H&E-stained sections at lower magnification are shown in C), PLAC8 also localizes to the apical domain, but immunoreactivity extends deeper into the neoplastic crypts. (F and H) PLAC8 immunofluorescence is largely detected in the cytoplasm of medullary (F) and mucinous (H) adenocarcinoma. (C, E, and G) Serial H&E-stained sections at lower magnification correspond to similar areas in D, F, and H. In all immunofluorescent panels, DAPI (blue) marks nuclei. Scale bars: 100 μm.
Cytosolic PLAC8 is correlated with tumor grade and linked to medullary and mucinous CRC.
We next analyzed PLAC8 expression in CRC using a tissue microarray (TMA) that contains a broad representation of stages and subtypes (24). In 49% of cases (41/84), no staining was observed in the malignant epithelium (Supplemental Figure 1F), while the remaining 51% (43/84) displayed membranous and/or cytosolic PLAC8 staining in the cancer. In cases where epithelial expression of PLAC8 was lost, stromal expression was still observed (C. Li and R. Coffey, unpublished observations), indicating that the lack of PLAC8 signal in the epithelium was not due to sample quality. In moderately differentiated colorectal adenocarcinomas, PLAC8 localized to the apical domain, similar to its distribution in normal colon (Figure 1C), although staining extended deeper into neoplastic crypts (Figure 1D and Supplemental Figure 1E). PLAC8 staining was confined to the cytoplasm in 9 cases (11%), where it correlated with higher tumor grade (P = 0.0009) (Supplemental Table 1). Notably, cases with strong cytosolic PLAC8 expression fall into 2 histological subtypes: medullary (Figure 1, E and F) and mucinous (Figure 1, G and H) carcinomas. As expected, CDH1 was present along the basolateral membrane of polarized normal and most neoplastic epithelia (Figure 1, A, B, and D, and Supplemental Figure 1). In areas with prominent PLAC8 immunofluorescence, CDH1 was less membranous.
PLAC8 overexpression increases tumor cell growth and invasion.
We generated a polyclonal rabbit anti-PLAC8 antibody, validated its specificity for immunoblotting (Supplemental Figure 2), and used it to examine a battery of human CRC cell lines cultured on plastic. In 2 matched primary and metastatic CRC cell lines, PLAC8 levels were higher in the metastatic cells compared with primary cell lines: SW620 versus SW480 (25) and KM12SM versus KM12C (ref. 26 and Figure 2A). The strongest PLAC8 signal was found in LoVo cells, a microsatellite unstable mucinous cell line (27). In 2 HCA-7 subclones, CC and SC (described below), PLAC8 levels were higher in SC than parental HCA-7 cells, whereas PLAC8 was not detected in CC (Figure 2A).
Figure 2. Increased PLAC8 protein is linked to tumor progression.

(A) Immunoblotting of CRC cell lines shows PLAC8 levels are higher in cells derived from metastatic tumors (SW620 and KM12SM) compared with cells derived from primary tumors (SW480 and KM12C), as well as in more invasive SC cells compared with CC or parental HCA-7 cells. (B) Left: DIC micrographs of 2 distinct types of HCA-7 colonies in 3D collagen culture: cystic clones (CC) that form smooth-edged spheres and spiky clones (SC) that grow as a solid mass with ill-defined borders and multiple protrusions (left panel) and phalloidin staining (right panel). Right: H&E staining of subcutaneous xenograft tumors of CC and SC cells (left panels); PLAC8 immunofluorescence of CC and SC subcutaneous xenograft tumors (right panels). (C) In 3D collagen culture, by immunoblotting, PLAC8 was undetectable in CC cells, but highly expressed in SC cells, and could be efficiently knocked down by 2 shRNAs in SC cells (left panel). PLAC8 knockdown in SC cells significantly decreased colony number in 3D collagen culture, and reduced tumor volume in xenografts (right panel; **P < 0.01). (D) Knockdown of endogenous PLAC8 in the KM12SM CRC cell line significantly reduced tumor volume of xenografts (left graph, *P < 0.05, n = 7). Right panels are representative H&E-stained tissue sections of xenografts. Data in all graphs are presented as mean ± SEM. Scale bars: 100 μm.
We cultured HCA-7 cells in type I collagen and identified 2 types of colonies with distinct morphologies (Figure 2B) and markedly different levels of PLAC8 (Figure 2, A and C): hollow cysts lined by a single layer of polarized cells enclosing a central lumen (designated cystic clones, CC) with undetectable levels of PLAC8, and solid masses with ill-defined borders and protrusions (designated spiky clones, SC) with high levels of PLAC8. When CC and SC cells were injected subcutaneously into athymic nude mice, they retained their in vitro morphologies: CC cells formed well-differentiated, encapsulated cysts, whereas SC cells formed poorly differentiated tumors that invaded into adjacent skeletal muscle (Figure 2B). By immunofluorescence, PLAC8 was not detected in CC tumors but was present and largely cytosolic in SC tumors (Figure 2B). Moreover, knockdown of endogenous PLAC8 in SC cells resulted in reduced growth in both type I collagen and xenografts (Figure 2C, right panels). In addition, knockdown of endogenous PLAC8 in KM12SM cells (Figure 2D, left panel) and LoVo cells (Supplemental Figure 3) reduced tumor growth in nude mice. There appeared to be reduced local invasion into skeletal muscle in xenografts of KM12SM cells with PLAC8 knockdown compared with vector control (Figure 2D, right panels). Taken together, these studies suggest PLAC8 overexpression may contribute to CRC progression.
Identification and characterization of zebrafish plac8 homologs.
To elucidate the cellular and molecular functions of PLAC8 in vivo, we took advantage of the experimental tractability afforded by the zebrafish model (28). Using the reciprocal best hits method (29), we identified the zebrafish Zgc114201 gene that encodes a cysteine-rich protein with 44% amino acid identity (including 13 of 16 cysteines) and 62% similarity to human PLAC8 (Supplemental Figure 4, A and C). In phylogenetic analyses, this putative zebrafish Plac8 clustered with Plac8 proteins from other species (Supplemental Figure 4E). Importantly, analysis of the human, mouse, and zebrafish genomes revealed that Zgc114201 is a syntenic equivalent of human PLAC8 (Supplemental Figure 4B). We noted that the second best hit, Zgc158845 (42% identity, 56% similarity to PLAC8), was located next to Zgc114201 (Supplemental Figure 4, B and C). Given their physical proximity and structural similarity, Zgc114201 and Zgc158845 likely arose via a tandem gene duplication event (30). According to the zebrafish gene nomenclature guidelines, we designated these genes plac8.1 and plac8.2, respectively. Using RT-PCR, we found that plac8.1 was prominently expressed in multiple developmental stages, whereas plac8.2 was expressed at low levels during early embryogenesis (Supplemental Figure 4D). Thus, we elected to focus on plac8.1 in this study.
Whole-mount ISH revealed that plac8.1 RNA was expressed maternally and zygotically in a ubiquitous fashion (Figure 3A) until 4 days post-fertilization (dpf), when it was upregulated in the gut and downregulated in other tissues (Figure 3C). To investigate Plac8.1 protein distribution, we generated a rabbit polyclonal antibody against a C-terminal peptide and validated its specificity by immunoblotting (Supplemental Figure 2, C and D). Using this antibody, we found widespread Plac8.1 immunofluorescence during gastrulation stages (Figure 3B, left panels). Strikingly, the intracellular distribution of Plac8.1 in mesenchymal gastrula cells was largely cytosolic at the onset of gastrulation but became progressively enriched at the plasma membrane at later gastrula stages (Figure 3B), during which cells begin to manifest epithelial characteristics (31, 32). This dynamic pattern of intracellular distribution was also observed in gastrulae expressing a C-terminal fusion protein, Plac8.1-EGFP (Figure 4B) or Plac8.1-HA (H. Ma, L. Solnica-Krezel, and R. Coffey, unpublished observations). Given the accumulation of plac8.1 transcripts in the gut, we next analyzed its distribution in this organ. As in the human intestine, Plac8.1 was enriched at the apical surface of gut epithelial cells at 4 dpf (Figure 3D). Thus, Plac8.1 intracellular distribution is dynamic and highly regulated in a developmental stage– and cell type–dependent manner.
Figure 3. plac8.1 RNA expression and Plac8.1 protein localization in zebrafish embryos.

(A) Whole-mount ISH using an antisense probe against full-length plac8.1 in zebrafish embryos at indicated hours post-fertilization (hpf). Asterisks denote position of animal poles. The arrow and arrowhead denote future dorsal and ventral side, respectively. Scale bar: 200 μm. (B) Confocal immunofluorescent images of whole-mount zebrafish embryos stained with anti-Plac8.1 antibody (green) and Texas red–conjugated phalloidin (red, F-actin). Cartoons on the left of each panel illustrate corresponding stages. The dashed lines correspond to their right section planes. Scale bar: 10 μm. (C) Whole-mount ISH using plac8.1 antisense probe in zebrafish embryos at 4 days post-fertilization (dpf). Dashed line indicates approximate position for transverse section shown in inset with strong signal in gut. Scale bars: 250 μm. (D) Cryosections through the gut of embryos at 4 dpf were stained with anti-Plac8.1 antibody (green), Texas red–conjugated phalloidin (red, F-actin), and TO-PRO-3 (blue, DNA). Scale bar: 10 μm.
Figure 4. Plac8.1 overexpression causes cell-autonomous post-transcriptional downregulation of E-cadherin.

(A) Left: Representative micrographs of control or plac8.1 RNA–injected zebrafish embryo. Horizontal white lines mark the deep cell margin. Middle: ntl ISH. The vertical white lines denote midline tissues, and the red arrowhead indicates the cluster of dorsal forerunner (df) cells separated from the deep cell margin. Right: Micrographs of control and plac8.1 RNA–injected embryos at 3 days post-fertilization (dpf), with ventral view of eyes shown in insets. Scale bars: 200 μm (7.5 hpf); 500 μm (3 dpf); 100 μm (insets). (B) Representative micrographs of a cell cluster with 3 types of membrane junctions: those shared by 2 wild-type cells (white arrows); those shared by 2 Plac8.1-EGFP–overexpressing cells (cyan arrow); and hybrid membrane junctions (green arrows). Scale bars: 10 μm. (C) Quantification of membrane Cdh1 intensity at different membrane junctions. **P < 0.01, ANOVA and subsequent pair-wise t test. (D and E) Quantification of total speed and net speed of lateral mesodermal cells. **P < 0.01, t test. (F) Left: Representative paths of lateral mesodermal cells traveling during time lapse in control and Plac8.1-EGFP–overexpressing embryos. Right: Orientations of the long axes of lateral mesodermal cells are plotted with length/width ratio (LWR) expressed as mean ± SEM. P > 0.05, Mann-Whitney U test. (G) qRT-PCR of cdh1 expression in Plac8.1-overexpressing and control embryos. Data are presented as mean ± SEM (P > 0.05, t test). (H) Immunoblotting of Cdh1 levels in control and Plac8.1-overexpressing embryos at 50% epiboly. Normalized levels are shown as mean ± SEM (P < 0.01, t test).
Overexpression of Plac8.1 impairs gastrulation, phenocopying Cdh1 loss-of-function.
To gain mechanistic insight into the effects of Plac8.1 overexpression, we injected various amounts of synthetic plac8.1 RNA into 1-cell-stage zebrafish embryos (Figure 4A). Plac8.1-overexpressing embryos displayed normal morphology until gastrulation, when cells accumulated predominantly in the dorsal region of the gastrula (Figure 4A). Moreover, the blastoderm margin was further away from the vegetal pole in Plac8.1-overexpressing embryos compared with control embryos (uninjected or EGFP RNA–injected wild-type). These results indicate that excess Plac8.1 impairs epibolic movements that spread embryonic tissues around the yolk. Accordingly, expression of the mesodermal marker no tail (ntl, zebrafish brachyury homolog) (33) at the blastoderm margin was positioned further from the vegetal pole in embryos overexpressing Plac8.1 compared with control embryos. Moreover, the ntl expression domain, marking dorsal forerunner cells (normally in close contact with the dorsal blastoderm margin), was separated from the deep cell margin in embryos overexpressing Plac8.1 (Figure 4A, red arrowhead), a phenotype consistent with defective epiboly (34). In addition, the ntl expression domain in the nascent chordamesoderm was shortened anteroposteriorly, but broadened mediolaterally (Figure 4A, white lines of middle panels), suggesting that excess Plac8.1 also impairs convergence and extension gastrulation movements.
At the completion of embryogenesis, Plac8.1-overexpressing embryos manifested dorsally curved and shortened body axes, with a small fraction displaying various degrees of cyclopia (Figure 4A, right panels). Injection of exogenous RNA encoding human PLAC8 led to a similar phenotype (H. Ma, L. Solnica-Krezel, and R. Coffey, unpublished observations). Penetrance of the defective gastrulation phenotypes described above increased in a concentration-dependent manner (Supplemental Figure 5A) and was reduced by coinjection with a plac8.1 antisense morpholino oligonucleotide, MO1-plac8.1, which inhibits translation of the injected plac8.1 RNA (H. Ma, L. Solnica-Krezel, and R. Coffey, unpublished observations). Taken together, these data indicate that the observed defects in epiboly and convergence and extension gastrulation movements are due to overexpression of Plac8.1.
To determine the cellular basis of these gastrulation abnormalities, we compared the movements of lateral mesodermal cells in control embryos and embryos overexpressing Plac8.1-EGFP using Nomarski time-lapse analysis. Cells from control and Plac8.1-EGFP–overexpressing embryos showed similar length/width ratios, suggesting that Plac8.1 overexpression does not affect cell elongation (Figure 4F, right panels). Also, the orientation of cell bodies in Plac8.1-EGFP–overexpressing gastrulae showed a pattern similar to that in controls (Figure 4F, right panels). Tracking the positions of representative mesodermal cells over time revealed normal cell migration paths in Plac8.1-EGFP–overexpressing gastrulae (Figure 4F, left panels). However, both the total and net cell migration speeds were significantly reduced in embryos overexpressing Plac8.1-EGFP compared with control gastrulae (Figure 4, D and E).
Plac8.1 overexpression causes cell-autonomous, post-transcriptional downregulation of cdh1.
The morphogenetic phenotypes observed in gastrulae overexpressing Plac8.1 resembled cdh1 loss-of-function phenotypes (34–38). If Plac8.1 influences Cdh1 function during gastrulation, embryos with reduced Cdh1 levels should be sensitive to Plac8.1 expression levels. To test this, we injected a low dose of plac8.1 RNA (20 pg) into offspring of cdh1vu44/+ parents and monitored epiboly progression using ntl as a marker of the blastoderm margin. The resulting progeny were characterized into 3 distinct phenotypes: wild-type gastrulae had a very mild epiboly defect; cdh1vu44/+ heterozygotes manifested more severe epiboly defects (Supplemental Figure 5B, lower right panel); and cdh1vu44/vu44 homozygotes displayed the most severe phenotype (H. Ma, L. Solnica-Krezel, and R. Coffey, unpublished observations). This synergistic epiboly defect in cdh1vu44/+ heterozygous embryos expressing low amounts of Plac8.1 supports the notion that Plac8.1 negatively influences cdh1 gene expression or function.
We next examined whether Plac8.1 affected cdh1 transcript levels. By quantitative RT-PCR (qRT-PCR), cdh1 mRNA levels were not significantly different between uninjected control and Plac8.1-overexpressing embryos (Figure 4G), suggesting that Plac8.1 represses cdh1 post-transcriptionally. In fact, Cdh1 protein levels were reduced by about 50% in embryos overexpressing Plac8.1 compared with controls (Figure 4H). To test whether Plac8.1 regulated Cdh1 levels in a cell-autonomous manner, we injected plac8.1-EGFP RNA into 1 cell of 32-cell-stage embryos, and monitored Cdh1 by immunofluorescence at early gastrula stages (Figure 4B). Cdh1 membrane immunofluorescence was significantly reduced at membranes shared by 2 Plac8.1-overexpressing cells; less reduced, yet still significantly reduced, intensity was observed at membranes shared by 1 wild-type cell and 1 Plac8.1-EGFP–expressing cell, compared with Cdh1 levels at membranes shared by cells lacking Plac8.1-EGFP (Figure 4C). The Plac8.1-EGFP signal negatively correlated with Cdh1 signals (Figure 4C; H. Ma, L. Solnica-Krezel, and R. Coffey, unpublished observations). Taken together, these studies are consistent with a model whereby excess Plac8.1 expression negatively regulates Cdh1 levels in zebrafish gastrulae post-transcriptionally in a cell-autonomous fashion.
Overexpression of PLAC8 in HCA-7 cells confers an EMT phenotype.
Armed with the insights gained from studying Plac8.1 in zebrafish, we examined the functional consequences of overexpressing PLAC8 in HCA-7 cells (HCA-7P8). We compared the 2-dimensional (2D) invasive behavior of parental and HCA-7P8 cells using a magnetically attachable stencil invasion assay (39). Cells were seeded at high density on monomeric collagen, and cell migration was analyzed upon removal of a magnetic stencil. Parental HCA-7 cells moved as a cohesive sheet, whereas HCA-7P8 cells moved unevenly and tended to detach from a common but irregular front (Figure 5A and Supplemental Figure 6). The deviation ratio and number of detached cells per field were significantly greater in HCA-7P8 cells than those observed in parental HCA-7 cells 8 and 24 hours after stencil removal (Figure 5B). When cultured in a 3D collagen matrix, HCA-7P8 cells showed less membranous CDH1 by immunofluorescence, especially cells located at the common front (Figure 5C). A similar pattern was observed in SC cells (with high PLAC8 levels) and CC cells (with barely detectable PLAC8 levels) cultured in 3D collagen (Supplemental Figure 10B). Hence, consistent with our findings in zebrafish embryos (Figure 4B), PLAC8 overexpression altered HCA-7 cell migration and reduced cell surface expression of CDH1.
Figure 5. Expression of PLAC8 enhances HCA-7 cell invasion and alters CDH1 subcellular localization.

(A) 2D invasive capacity was assessed by a magnetically attachable stencil invasion assay. After removal of a magnetically attachable stencil, movement of parental HCA-7 and PLAC8-overexpressing HCA-7 (HCA-7P8) cells was monitored over 24 hours by time-lapse microscopy. HCA-7 cells moved as a common front, whereas HCA-7P8 cell movement was uneven and cells detached. Scale bars: 100 μm. (B) At 8 and 24 hours, static images were taken and quantified by 2 parameters (deviation ratio and number of detached cells per field), based on 3 independent experiments performed in triplicate. Both parameters were significantly greater in PLAC8-overexpressing cells. Data are presented as mean ± SD. *P < 0.05; **P < 0.01. (C) After 15 days in 3D collagen culture, PLAC8 and CDH1 immunofluorescence were largely cytosolic in HCA-7 cells overexpressing PLAC8 (HCA-7P8). The boxed regions in the upper panels are magnified in the lower panels. Scale bars: 50 μm.
Given that PLAC8-overexpressing HCA-7 cells display features that are functionally and morphologically similar to EMT, we next examined expression of EMT-related genes by using a commercial qRT-PCR array (see Methods; Y. Wang and R. Coffey, unpublished observations) and validated individual upregulated candidates. Consistent with a classical EMT signature (8), VIM and zinc finger E-box binding homeobox 1 (ZEB1) transcripts were increased 12- and fourfold, respectively, in HCA-7P8 cells compared with parental HCA-7 cells. We were not able to detect ZEB2 expression and did not observe changes in other transcriptional regulators of CDH1 (TWIST1 and TWIST2, SNAIL, and SLUG) in HCA-7P8 cells (Y. Wang and R. Coffey, unpublished observations). In contrast to transcriptional repression of CDH1 seen in classical EMT, CDH1 mRNA was slightly upregulated (1.4-fold) in HCA-7P8 cells (Figure 6A), and CDH2 transcripts were undetectable in both cell lines (Y. Wang and R. Coffey, unpublished observations). Interestingly, expression of CDH3, a cadherin linked to colon cancer progression (20), was upregulated nearly fourfold in HCA-7P8 cells. Therefore, PLAC8 overexpression results in an unconventional cadherin switch: transcriptional upregulation of CDH3 and reduced cell surface CDH1, along with other typical features of EMT including transcriptional upregulation of VIM and ZEB1.
Figure 6. HCA-7P8 cells exhibit features of EMT.

(A) qRT-PCR demonstrated that CDH1 was slightly upregulated, 1.4-fold, whereas ZEB1, VIM, and CDH3 were markedly upregulated, 13-, 5-, and 4-fold, respectively, in HCA-7P8 cells compared with HCA-7 cells. OCLN and AKT expression was not significantly changed. Data are presented as mean ± SD. (B) By detergent fractionation analysis, most CDH1 in HCA-7P8 cells was in the Triton X-100 soluble fraction. Control HCA-7 cells had approximately 50% insoluble CDH1, reflecting cytoskeleton-attached CDH1. CDH3 in HCA-7P8 cells was predominantly Triton X-100 soluble. ACTB and AKT serve as fractionation controls. (C) Expression and localization of classical EMT markers were assessed by immunoblotting (left) and immunofluorescence (right). In contrast to RNA levels, CDH1 protein was modestly reduced in HCA-7P8 cells and appeared less membranous and more cytoplasmic. CTNND1 was slightly reduced in HCA-7P8 cells; consistent with qRT-PCR results, VIM, ZEB1, and CDH3 protein levels were upregulated. In HCA-7P8 cells, VIM immunofluorescence was observed in approximately 10% of the cells, where it had a cytoplasmic filamentous pattern. ZEB1 fluorescence was uniformly nuclear, and CDH3 appeared more cytoplasmic compared with that in HCA-7 cells. (D) Expression and localization of tight junction proteins were assessed by immunoblotting (left) and immunofluorescence (right). Compared with HCA-7 cells, there was no change in total OCLN protein levels in HCA-7P8 cells; however, there was a marked reduction in membrane localization, with appearance of punctate cytoplasmic immunoreactivity. TRIC and CLDN4 protein levels were upregulated with loss of tricellular junction localization. Scale bars: 20 μm.
To determine the post-transcriptional effects of PLAC8 on CDH1, we examined the Triton X-100–soluble and –insoluble fractions of CDH1 in parental and HCA-7P8 cells. The Triton-insoluble pool of CDH1 is thought to represent a cytoskeleton-attached, highly organized complex of functional CDH1 at the plasma membrane (40). PLAC8 overexpression reduced the insoluble pool of CDH1 (Figure 6B). Thus, like in zebrafish, PLAC8 overexpression post-transcriptionally regulates CDH1, in this case, by reducing the insoluble pool of cytoskeleton-attached CDH1, as well as modestly decreasing the total CDH1 protein level (Figure 6C, left panel). Similar to the changes observed at the transcript level, CDH3 protein was increased in HCA-7P8 cells, whereas it was barely detected in parental HCA-7 cells. CDH3 was mainly detected in the Triton X-100–soluble fraction.
We further examined EMT-related markers by immunoblotting (Figure 6C, left panels) and immunofluorescence (Figure 6C, right panels). By immunoblotting, levels of CDH1 and CTNND1 were modestly reduced in HCA-7P8 cells. By immunofluorescence, we observed less membranous and increased cytoplasmic CDH1 expression. By immunoblotting, HCA-7P8 cells exhibited increased levels of VIM and ZEB1 compared with parental HCA-7 cells. VIM immunofluorescence was detected in approximately 10% of HCA-7P8 cells and, when present, displayed a filamentous pattern in the cytoplasm. ZEB1 immunofluorescence was detected in nuclei of all HCA-7P8 cells. CDH3 levels were increased in HCA-7P8 cells and appeared to be more cytosolic compared with CDH3 in parental HCA-7 cells by immunofluorescence.
Alterations in tight junction proteins have been reported in EMT and cancer progression (41–43); thus, we examined the levels and localization of a panel of tight junction proteins. Although occludin (OCLN) levels were not significantly altered by PLAC8 overexpression, the protein relocalized from the plasma membrane to cytoplasm (Figure 6D, right panels). Immunoblotting revealed elevated levels of tricellulin (TRIC) in HCA-7P8 compared with parental HCA-7 cells (Figure 6D, left panels). However, in contrast to the typical localization of TRIC at tricellular junctions in parental HCA-7 cells, TRIC immunofluorescence was apparent throughout the plasma membrane and in the cytoplasm of HCA-7P8 cells (Figure 6D, right panels). By contrast, JAM-A levels were reduced and a faster migrating form of ZO-1 was detected in lysates from HCA-7P8 cells compared with parental HCA-7 cells. For both JAM-A and ZO-1, immunofluorescence was less uniform and markedly reduced at the tricellular junctions in HCA-7P8 cells (Figure 6D, right panels). Taken together, these results show that excess PLAC8 results in a number of morphological and biochemical features of EMT. However, in contrast to classical EMT, in which CDH2 is transcriptionally upregulated, we observed transcriptional upregulation of CDH3.
PLAC8 enhances ERK2 phosphorylation.
To elucidate the molecular mechanism by which excess PLAC8 leads to this EMT phenotype, we examined signaling pathways linked to EMT, including ERK (22, 44), AKT (45, 46), and SRC (ref. 47 and Figure 7A). Phosphorylation of ERK2, but not ERK1, has been shown to induce EMT (22). Although we observed no difference in total ERK1/2 levels, p-ERK1/2 levels were markedly increased in HCA-7P8 cells, with a more prominent increase in p-ERK2. There was a modest increase in total AKT and p-AKT in HCA-7P8 cells, consistent with previous findings that PLAC8 increases p-AKT in cultured fibroblasts (48). Notably, we observed no difference in total SRC and p-SRC between parental HCA-7 and HCA-7P8 cells, further supporting a selective contribution of ERK2 in the PLAC8-induced EMT.
Figure 7. PLAC8 induces EMT through ERK2 activation.

(A) Total and activated EMT-related kinases were assessed by immunoblotting. Although both p-ERK1 (slower migrating, higher band) and p-ERK2 (faster migrating, lower band) were increased in HCA-7P8 cells, ERK2 phosphorylation was much stronger. Total ERK1/2 proteins were expressed at similar levels in HCA-7 and HCA-7P8 cells. Total AKT and p-AKT were slightly increased, whereas total SRC and p-SRC (Y416) were unchanged in PLAC8-overexpressing HCA-7 cells. (B) Immunoblotting of HCA-7P8 cells infected with nontargeting shRNA vector control (CTL), or shRNAs targeting ERK1 or ERK2, respectively. (C) Representative DIC images from shERK1 and shERK2 cells grown on coverslips for 5 days showed that knockdown of ERK2, but not ERK1, resulted in reversion to smooth-edged colonies similar to parental HCA-7 cells. Scale bar: 500 μm. (D) Representative immunofluorescent images from shERK1 and shERK2 cells showed that knockdown of ERK2, but not ERK1, led to restoration of cell surface CDH1 and markedly reduced CDH3, VIM, and ZEB1. Scale bars: 50 μm.
To investigate the relative contribution of ERK2 to the HCA-7P8 EMT phenotype, we knocked down ERK1 or ERK2 using lentiviral-based shRNAs (targeting constructs are listed in Supplemental Table 2). Knockdown of ERK2 (shERK2-3), but not ERK1 (shERK1-1), caused HCA-7P8 cells to revert from colonies with irregular borders and protrusions to smooth-edged colonies (Figure 7, B and C). In contrast to ERK1 knockdown cells, ERK2 knockdown cells exhibited increased CDH1 cell surface immunofluorescence and markedly decreased CDH3, ZEB1, and VIM immunofluorescence (Figure 7D). In addition, administration of an ERK2-selective inhibitor, pyrazolylpyrrole, reverted HCA-7P8 cells from a mesenchymal to an epithelial morphology in a concentration-dependent manner and led to a marked increase in cell surface CDH1 (Supplemental Figure 7).
PLAC8 directly binds DUSP6 and inhibits its phosphatase activity.
To investigate the mechanism by which high levels of PLAC8 increase ERK2 activation, we examined dual-specificity phosphatases (DUSPs) that can dephosphorylate and inactivate ERK1/2. These include the nuclear phosphatase DUSP5 (49) and cytosolic phosphatases DUSP3 and DUSP6 (23, 50, 51). On the basis of the cytosolic localization of PLAC8 in CRC cells, we elected to study DUSP6 and DUSP3. To examine the effects of PLAC8 on DUSP6 and DUSP3 enzymatic activity, we performed in vitro phosphatase experiments using recombinant DUSP6 (Figure 8A) and DUSP3 (Supplemental Figure 8). Since the activity of DUSPs depends on binding to ERK2 (52), we added purified ERK2 protein to in vitro phosphatase assays. In the presence of purified recombinant maltose-binding protein–tagged (MBP-tagged) murine PLAC8, DUSP6 phosphatase activity was significantly reduced, as indicated by decreased hydrolysis (dephosphorylation) of a fluorescence substrate, 3-O-methylfluorescein phosphate. As a control, purified MBP did not alter DUSP6 phosphatase activity (Figure 8A, green circles). Similarly, purified human PLAC8 protein also inhibited DUSP6 phosphatase activity (H. Ma and R. Coffey, unpublished observations). In contrast, MBP-PLAC8 protein had minimal effect on DUSP3 phosphatase activity (Supplemental Figure 8), indicating selective inhibition of DUSP6 activity by PLAC8.
Figure 8. PLAC8 binds to DUSP6 and inhibits its phosphatase activity.

(A) PLAC8 inhibited DUSP6 phosphatase activity in vitro. DUSP6 phosphatase activity was measured by fluorescent intensity of the substrate 3-O-methylfluorescein phosphate. Fluorescent intensity increased over time in control samples (black squares). Addition of purified MBP-tagged mouse PLAC8 protein significantly reduced DUSP6 phosphatase activity (blue circles). However, addition of MBP itself did not significantly affect the activity. Phosphatase inhibitor cocktail was added as a positive control to completely abolish the activity (red squares). Data are presented as mean ± SEM from 4 independent experiments. *P < 0.05, ANOVA followed by t test. (B) Coimmunoprecipitation shows interaction between PLAC8 and DUSP6. HEK293T cells were transfected with the plasmids as labeled. PLAC8 was coimmunoprecipitated with an anti-Myc antibody from cells expressing Myc-tagged DUSP6, but not from cells expressing only PLAC8.
Next, we tested whether PLAC8 interacts with DUSP6 by coimmunoprecipitation. Untagged PLAC8 coimmunoprecipitated with Myc-tagged DUSP6 when cotransfected into HEK293 cells (Figure 8B). In addition, endogenous DUSP6 coimmunoprecipitated with PLAC8 from HCA-7 cells (H. Ma and R. Coffey, unpublished observations). Moreover, yeast 2-hybrid analysis showed that PLAC8 and DUSP6 directly interact (Supplemental Table 3 and Supplemental Figure 9). Taken together, these results indicate that PLAC8 overexpression can enhance ERK2 phosphorylation by directly binding to DUSP6, and inhibiting its phosphatase activity.
Knockdown of endogenous PLAC8 in SC cells restores cell surface CDH1 and reduces p-ERK2.
Having established the molecular and morphological effects of selectively overexpressing PLAC8 in HCA-7 cells, we returned to the study of HCA-7–derived CC (PLAC8-low) and SC (PLAC8-high) cells to test the consequences of knocking down PLAC8 in SC cells (Figure 2C). When injected subcutaneously, CDH1 was largely cytoplasmic in xenograft tumors from SC cells, but mainly on the membrane in CC-derived tumors (Supplemental Figure 10A). Stable knockdown of PLAC8 in SC cells resulted in restoration of cell surface CDH1 in xenograft tumors (Figure 9A). Similar results were also observed in 3D collagen culture (Supplemental Figure 10, B and C). These data support the post-transcriptional regulation of CDH1 by PLAC8. In addition, p-ERK2 was significantly reduced in xenografts from SC cells with PLAC8 knockdown by immunoblotting (Figure 9B), further suggesting that PLAC8 is a critical regulator of this unconventional EMT phenotype.
Figure 9. Depletion of endogenous PLAC8 in SC cells restores cell surface CDH1 and reduces ERK2 phosphorylation in xenografts.

(A) Control SC cells (CTL) and SC cells stably expressing PLAC8 shRNAs (sh1 and sh2) were subcutaneously injected into athymic nude mice. After 4 weeks, control SC cells formed less well-differentiated tumors with minimal CDH1 immunoreactivity (brown) at the membrane (left). In contrast, SC cells expressing PLAC8 shRNAs formed glandular tumors with large cysts with CDH1 immunoreactivity (brown) observed at the membrane (middle and right). Black box fields are magnified in dashed boxes. Scale bars: 100 μm (top), 20 μm (bottom). (B) Immunoblotting of p-ERK1 (higher band) and p-ERK2 (lower band) in xenograft tumors from control SC cells (CTL, left 3 lanes) and from SC cells stably expressing PLAC8 shRNAs (right 3 lanes). ACTB was used as a loading control.
Evidence of EMT in human CRC.
To relate the above findings to CRC, we used MultiOmyx, a novel immunofluorescence-based methodology that allows application and analysis of up to 60 primary antibodies in a single section (53, 54). In a representative medullary CRC tumor, PLAC8 expression was detected throughout the tumor (Figure 10, A and E). As expected, expression of the epithelial marker cytokeratin (CK) corresponded to the CDH1+ portion of the tumor (Figure 10, F and H), and expression of the mesenchymal marker VIM correlated with CDH3 expression (Figure 10, G and I). We focused on a region of the tumor containing an abrupt transition from CDH1 to CDH3 immunoreactivity (Figure 10, A and B color, F and G black and white). Notably, our analysis software revealed a CDH3+ region (Figure 10C) that contained a large number of cells with cytosolic PLAC8 expression (Cyt-PLAC8, blue, and Supplemental Figure 11). Examination of a subset of these Cyt-PLAC8+ cells (Figure 10D) revealed coexpression of both CK (false-colored red) and VIM (false-colored green). Coexpression of CK, CDH3, VIM, and Cyt-PLAC8 provides in vivo evidence that excess PLAC8 may be involved in EMT in human CRC.
Figure 10. Expression of PLAC8, CDH1, CDH3, CK, and VIM in a medullary CRC.

(A) Composite view of PLAC8 (white), CDH1 (red), CDH3 (green), CK (magenta), and VIM (blue) expression. (B) Transition from CDH1- to CDH3-expressing cells from boxed region in A (dotted line). (C) Cells within the CDH3+ (gray) region have cytosolic PLAC8 expression (false-colored, blue). (D) Expression of CK (false-colored, red), VIM (false-colored, green) and cytosolic PLAC8 expression (false-colored, blue) within the CDH3+ (gray) cells. Cells with cytosolic PLAC8 expression and coexpression of CK and VIM are boxed and enlarged in C and D. (E–I) Single-marker expression of panels composited in A. Scale bars in the insets of C and D: 25 μm; other scale bars: 75 μm.
Discussion
Previous studies have implicated PLAC8, a small cysteine-rich, evolutionarily conserved vertebrate protein (55–57), in multiple types of cancer, including CRC (7, 48, 58, 59). However, the molecular functions of PLAC8 in cancer remain to be defined. In this study, we show that excess PLAC8 promotes ERK2-dependent unconventional EMT through direct binding to DUSP6 and inhibition of its phosphatase activity.
We provide the first description of endogenous PLAC8 protein distribution, showing that both human PLAC8 and zebrafish Plac8.1 localize to the apical domain of normal differentiated gut epithelium. Future studies will address the regulation of PLAC8 subcellular localization and its function at the apical domain and in the cytoplasm. It is interesting to note that cytosolic PLAC8 is a feature of tumors with microsatellite instability (MSI) and MSI CRC–derived cell lines, which are characterized by frequent somatic mutations (60). Both mucinous and medullary CRCs tend to be MSI, and KM12C, LoVo, and HCA-7 cell lines were derived from MSI CRCs. It will be important to determine whether excess PLAC8 is a common feature of MSI CRCs and whether cytosolic PLAC8 correlates with increased p-ERK2 in this subset of CRCs. If so, we hypothesize that PLAC8 is normally tethered at the subapical plasma membrane by proteins that become mutated in cancer; in this setting, PLAC8 is released into the cytoplasm, where it takes on its neomorphic function to bind and inactivate DUSP6, increasing p-ERK2 and leading to an EMT-like phenotype.
Considerable evidence supports an important role for EMT in cancer progression (8, 9). Classic EMT is a transcriptional program in which CDH1 expression is suppressed, while CDH2 and mesenchymal genes, such as VIM, are induced. Here, we describe an unconventional EMT that occurs in the presence of excess, mislocalized PLAC8. This EMT is characterized by a cadherin switch, where cell surface CDH1 is reduced in a post-transcriptional manner and CDH3 is transcriptionally upregulated; there is no change in CDH2 expression. The characterization of the complex cellular phenotype of cells undergoing EMT was demonstrated using MultiOmyx technology, whereby colocalization of the 5 proteins of interest (PLAC8, VIM, CK, CDH1, and CDH3) was determined at a single-cell level in situ. Visualizing the patterns of expression for these 5 proteins with the color-coding method reveals the dynamic nature of this process at the invasive front of a medullary CRC. Overexpression of CDH3 has been implicated in CRC progression, although upregulation of CDH3 is not a classical feature of EMT. Expression of CDH3 (61, 62) in cancer cells promotes cell motility, migration, and invasion, potentially by interfering with CTNND1 binding to CDH1 (63) or promoting cytoplasmic accumulation of CTNND1 (64). CDH3 binding CTNND1 through the juxtamembrane domain may be crucial for induction of invasion (65, 66) by preventing CDH1 from binding to and stabilizing CTNND1 (67).
We identified enhanced p-ERK2 as a mediator of many of the EMT-related effects of excess PLAC8. Previous studies have linked p-ERK2 to EMT through transcriptional upregulation of ZEB1, ZEB2, and FRA1 (22). In our system, PLAC8 overexpression did not affect FRA1 levels (Y. Wang and R. Coffey, unpublished observations). We show that knockdown of ERK2 (but not ERK1) in HCA-7P8 cells restored cell surface CDH1, indicating that CDH1 relocalization away from the membrane is downstream of ERK2 phosphorylation. Similar results were also seen using a selective ERK2 inhibitor (Supplemental Figure 7), further supporting that ERK2 phosphorylation regulates subcellular localization of CDH1. Mechanistically, we found PLAC8 directly interacts with DUSP6 and inhibits its phosphatase activity. We also identified increased p-ERK in zebrafish embryos overexpressing Plac8.1 (Supplemental Figure 12), further linking the studies in zebrafish and CRC cells.
The precise mechanism(s) through which active ERK2 reduces cell surface CDH1 remains to be elucidated. We hypothesize that p-ERK2 could destabilize the CDH1-catenin complex through multiple possible mechanisms. PLAC8-induced p-ERK2 could activate CK2α kinase, which phosphorylates CTNNA1 at S64, resulting in dissociation of the CTNNA1-CTNNB1 complex (68). This would lead to destabilization of CDH1 at the membrane and resultant cytoplasmic accumulation. It is also possible that PLAC8 overexpression activates AKT, which phosphorylates CTNNB1 at S552, disrupting the CDH1-CTNNB1 interaction (69). In support of PLAC8-induced disruption of membranous cadherin-catenin complexes, we observed increased cytosolic CTNND1 and CDH1 expression in HCA-7P8 cells (Figure 6C). PLAC8 knockdown restored cell surface localization of both proteins. Knockdown of CBLL1, the E3-ubiquitin ligase for CDH1 (70), did not affect protein levels or subcellular distribution of CDH1 (C. Li and R. Coffey, unpublished observations). Furthermore, no CDH1 mobility shift was observed by immunoblotting of PLAC8-overexpressing cell lysates (C. Li and R. Coffey, unpublished observations). These observations indicate that ubiquitylation by CBLL1 or ectodomain cleavage of CDH1 is not mechanistically tied to CDH1 subcellular localization. Future studies will be needed to determine the precise mechanisms by which p-ERK2 regulates CDH1 subcellular localization upon PLAC8 overexpression.
We observed a dynamic pattern of endogenous Plac8.1 distribution in the course of zebrafish embryogenesis. Plac8.1 was detected in largely cytoplasmic puncta at blastula stages, gradually accumulating near cell membranes in mesenchymal cells that become more tightly packed and acquire epithelial characteristics during the course of gastrulation (31, 32, 71), with expression strongly enriched at the apical cell membranes in the developing gut (Figure 3). This pattern of intracellular Plac8.1 in zebrafish parallels our observations for human PLAC8, which was found exclusively at the apical domain of fully differentiated normal colonic epithelium (Figure 1, A and B) and moderately differentiated adenocarcinomas (Figure 1D). In poorly differentiated carcinomas where it was overexpressed, PLAC8 frequently showed cytosolic distribution (Figure 1, F and H). It will be instructive to examine the localization of PLAC8 protein in adipocytes and dendritic cells given its role in brown fat differentiation and immune function (3–5).
We noted that the effects of Plac8 overexpression on cell migration are different in our 2 model systems. Plac8.1 overexpression in zebrafish embryos resulted in decreased mesenchymal cell migration (Figure 4, D and E); in contrast, PLAC8-overexpressing HCA-7 cells detached and migrated faster compared with control cells (Figure 5B). This difference is likely due to the different modes of mesenchymal cell migration in zebrafish embryos and cultured human epithelial cells. Mesodermal cells of zebrafish gastrulae move as individuals on the surfaces of other cells, and reduced or excess Cdh1 impairs cell migration (34, 37, 72–75). In contrast, cancer cells can invade and migrate as individual cells after detaching from epithelia, which is facilitated by loss of membrane adhesion molecules, including CDH1 (76).
Our work also introduces a new 3D system for studying CRC. Pioneering work by the laboratories of Mina Bissell and Joan Brugge has shown the biological relevance of studying breast cancer cells in 3D rather than on plastic (77, 78). Such 3D model systems for CRC are limited and have relied largely on Caco-2 cells (79). Similar to Caco-2 cells, HCA-7 cells form a uniform polarizing monolayer when cultured on Transwell filters (80). HCA-7–derived CC and SC cells display 2 distinct morphologies and behaviors when cultured in type I collagen. We believe this will be a useful and highly tractable in vitro model system to study colon cancer cell behavior and to identify molecules, like PLAC8, that contribute to tumor progression.
Methods
Plasmids, transfection, and infection of human cell lines.
Expression vectors for human PLAC8 (pcDNA3.1-PLAC8, pcDNA3.1-PLAC8-FLAG, pRetroX-Tight-Pur-PLAC8, and pcDNA3.1-PLAC8-EGFP) were cloned from full-length cDNA (OriGene). For knockdown experiments, shRNA lentivirus (Supplemental Table 2) was packaged in HEK293 cells that were cotransfected with pCMV-dR8.2 dvpr and pMD2.G plasmids (81). Lentivirus-containing media were filtered through 0.45-μm cellulose acetate syringe filters (VWR Scientific) before infection. Lentivirus-infected cells were cultured in DMEM (Corning cellgro) supplemented with 0.5 μg/ml puromycin.
Antibody generation, immunofluorescence, and immunohistochemistry.
Anti–human PLAC8 and anti–zebrafish Plac8.1 antibodies were generated by immunization of rabbits with KLH-conjugated peptides of amino acid sequences from the C-terminus of human PLAC8 (CQIKRDINRRRAMRTF) or zebrafish Plac8.1 (CQLKRDIDIRKSNGTLKL), respectively (Covance Inc.). Specificity of both anti-PLAC8 and anti-Plac8.1 antibodies was validated using FLAG-tagged and untagged peptides. Additional validation was performed by shRNA or morpholino knockdown in mammalian cells and zebrafish, respectively (Supplemental Figure 2). For CDH1 immunofluorescence, cells were fixed in HistoChoice Tissue Fixative (Sigma-Aldrich, H2904) for 15 minutes. Cells for all other immunofluorescence assays were fixed in 4% PFA, then permeabilized with 0.5% Triton X-100 for 10 minutes, stained with appropriate antibodies, and followed by confocal microscopic analysis. Whole-mount immunofluorescence of zebrafish embryos was performed as previously described (82). For immunohistochemistry, tissue sections were deparaffinized and antigen retrieval was performed using Target Antigen Retrieval Solution (Dako, S1699) for 20 minutes. Sections were then incubated with primary antibodies (Supplemental Table 4) overnight at room temperature. Secondary antibodies used for immunofluorescence and immunohistochemistry include HRP- or Cy3-conjugated donkey anti-mouse or anti-rabbit IgGs (Jackson ImmunoResearch), and Alexa 488– or Alexa 568–conjugated goat anti-mouse or anti-rabbit IgGs (Life Technologies). All other chemicals were purchased from Sigma-Aldrich unless otherwise stated.
Immunoblotting.
Cells were lysed in either cell lysis buffer (25 mM Tris HCl, 150 mM NaCl, 0.5% Nonidet P-40, 0.5% sodium deoxycholate, 1 mM DTT, and 2% BSA) or M-PER (Pierce) with protease inhibitor cocktail (Sigma-Aldrich, P2714). For PLAC8 immunoblotting, tissues or cultured cells were lysed in 8 M urea SDS sample buffer (2% SDS, 0.125 M Tris-HCl [pH 6.8], 8 M urea, 10% BME). Zebrafish embryos were manually dechorionated and homogenized in NP-40 lysis buffer (1% Nonidet P-40, 50 mM Tris-HCl [pH 7.4], 150 mM NaCl, 2 mM EDTA, 50 mM NaF, and 10% glycerol). See complete unedited blots in the supplemental material.
2D and 3D cell culture.
HCA-7, SW480, SW620, KM12C, KM12SM, and LoVo cells and all their derivatives were grown in DMEM supplemented with 10% bovine growth serum, glutamine, nonessential amino acids, 100 U/ml penicillin, and 100 μg/ml streptomycin (HyClone) at 37°C and 5% CO2. For soft agar culture, cells were grown on plastic for 4 days before being plated in 6-well dishes in triplicate at 0.5 × 10⁴ cells/ml in 0.4% type VII agarose (Sigma-Aldrich) over a hardened layer of 0.8% agarose. Colonies were counted (Oxford Optronix GelCount) after 13–25 days. 3D collagen cultures were set up using 3 layers of type I collagen (PureCol, Advanced BioMatrix) in 12-well dishes in triplicates. Top and bottom layers consisted of 400 μl per well of collagen diluted to 2 mg/ml in medium. The middle layers consisted of 400 μl per well of 2 mg/ml collagen in medium and contained 5,000 cells/ml. One milliliter medium was added on top of each collagen sandwich. Medium was changed every 2–3 days. Colonies were counted (Oxford Optronix GelCount) after 14–18 days. Colonies were either fixed in 4% PFA for immunofluorescence or lysed for immunoblotting post-counting.
Magnetically attachable stencil invasion assay.
The assay was performed as previously described (39). Briefly, a magnetically attachable stencil was placed onto 12-well dishes, previously coated with monomeric collagen (0.1 mg/ml collagen I). HCA-7C and HCA-7P8 cells were seeded at high density. After 48 hours, the stencil was removed and cell movement was monitored by time-lapse microscopy.
TMA construction and TMA slide preparation.
The TMA was constructed on a manual Beecher arrayer and consisted of 1-mm cores in triplicates from paraffin blocks of primary CRCs from 84 patients. A variety of CRC subtypes (mucinous, medullary, and signet ring cell carcinomas) from all 4 cancer stages were included. Ten cores of normal colonic mucosa were included as controls. Freshly cut 5-μm paraffin sections were used for immunohistochemistry.
Mouse xenografts.
For SC and CC cells, 4 × 10⁶ cells of each cell line in 100 μl PBS suspensions were injected subcutaneously in both flanks. Tumors were harvested 56 days after injection. The harvested tumors were fixed in 10% formalin for paraffin embedding or snap-frozen. For KM12SM pLKO.1 shRNA vector control, KM12SM pLKO.1-PLAC8-929 shRNA cells, LoVo pLKO.1 shRNA vector control, and LoVo pLKO.1-PLAC8-929 shRNA cells, 2 × 10⁶ cells of each cell line in 100 μl serum-free DMEM were injected subcutaneously in 1 flank of each nude mouse. The lengths and widths of tumors were measured twice weekly with an external caliper. Tumor volumes were calculated using the modified ellipsoid formula, volume = 1/2 (length × width2) (83, 84).
Identification and cloning of zebrafish plac8 homologs.
Zebrafish plac8 homologs were identified using TLBSTN algorithm (Basic Local Alignment Search Tool, http://blast.ncbi.nlm.nih.gov/) with human PLAC8 (AAH12205.1) and mouse Plac8 (NP_631937.1) protein sequences. Candidate genes were further screened and validated by syntenic analysis. Two previously uncharacterized genes from the zebrafish gene collection (ZGC), Zgc114201 and Zgc158845, were renamed as plac8.1 and plac8.2, respectively. The expression constructs pCS2-Plac8.1, pCS2-Plac8.1-EGFP, or pCS2-Plac8.1-mCherry and pCS2-Plac8.1-mt3-EGFP were subcloned from plac8.1 cDNA (Open Biosystems).
Zebrafish embryo injection.
Sense-capped RNA was synthesized by the mMESSAGE mMACHINE RNA synthesis kit (Ambion) from enzyme-treated and linearized plasmid templates. The synthesized RNA was purified and examined with both spectrometry and agarose gel electrophoresis to ensure expected molecular weight and integrity before injection. Embryos were injected at the 1-cell stage, unless mosaic injection is noted. For mosaic injection, single cells of 32-cell-stage embryos were injected.
Whole-mount ISH of zebrafish.
The full-length coding sequence of plac8.1 was used to generate digoxigenin-labeled sense and antisense RNA probes. The digoxigenin-labeled probe used to detect ntl expression was from published studies (33). The labeled probes were examined with spectrometry and agarose gel electrophoresis to ensure integrity and expected molecular weight. For whole-mount ISH, zebrafish embryos of desired stages were fixed in 4% PFA. The subsequent steps for whole-mount ISH were performed as previously described (85). Micrographs of whole-mount embryos were collected with a Discovery V12 stereomicroscope with an AxioCam MRc camera and AxioVision software (Carl Zeiss MicroImaging).
Time-lapse imaging and analysis.
Multi-Z-plane differential interference contrast (DIC) time-lapse images were collected with a Quorum WaveFX-X1 spinning disc confocal system (Quorum Technologies) equipped with MetaMorph software (Molecular Devices). Zebrafish embryos were dechlorinated in 0.3× Danieau at 60% epiboly (about 7 hours post-fertilization [hpf]). Embryos were then mounted in glass-bottom dishes (MatTek) with 0.75% low-melt agarose (Lonza), with the lateral mesoderm close to the glass for time-lapse imaging with a ×10 objective (86). Mesodermal cells were imaged from 70% epiboly (7.5 hpf) to 75% epiboly (8 hpf) at 0.5-minute intervals for 30 minutes with 2 μm Z increments using a ×40 water-immersion objective. The collected time-lapse images were processed using MetaMorph software. Cell morphometric analysis and cell movement tracking were performed manually using ImageJ. Statistical analysis and data plotting were performed with Prism software (GraphPad Software Inc.). The angle data were plotted with Rose.Net software ( http://mypage.iu.edu/~tthomps/programs/).
RNA isolation, qRT-PCR, and qPCR array analysis.
Total RNA from human cells or zebrafish embryos was extracted with TRIzol Reagent (Invitrogen), digested with DNase, and further purified using the RNeasy Mini Kit (Qiagen). cDNA was generated with SuperScript II reverse transcriptase (Life Technologies). qRT-PCR was performed in triplicate using the StepOnePlus Real-Time PCR System (Applied Biosystems) in 3 independent experiments. Each 20-μl reaction contained 0.1 μM primers (for sequence information see Supplemental Table 5A), 4 mM MgCl2, and EXPRESS SYBR GreenER Supermix with Premixed ROX (Life Technologies, A10315) and was run under the following conditions: 95°C 2 minutes, 95°C 15 seconds, 58°C 45 seconds for 45 cycles followed by melting curve validation. Human EMT RT2 Profiler PCR Array (Qiagen, PAHS-090Z) was used for screening by qRT-PCR according to the manufacturer’s instructions.
Genotyping.
The cdh1vu44 and wild-type cdh1 alleles were distinguished by a PCR-generated restriction fragment length polymorphism method. PCR products from VU44 primers (Supplemental Table 5B) were digested with DdeI and resolved by agarose gel electrophoresis. The cdh1vu44 allele produced products of 104 bp and 216 bp, whereas the wild-type cdh1 allele produced a single product of 310 bp.
ERK2 inhibitor treatments.
HCA-7P8 cells plated on coverslips were treated with ERK2-selective inhibitor, pyrazolylpyrrole, at a concentration of 10 or 100 nM from day 1 for 5 days. Cells were fixed in HistoChoice fixative for 15 minutes and then permeabilized using 0.5% Triton X-100 PBS for 10 minutes, followed by DIC microscopy or immunofluorescence.
Serial multiplexed immunofluorescence microscopy (MultiOmyx).
The MultiOmyx platform allows a standard FFPE tissue section to be processed and stained repetitively with Cy3-, Cy5-, and Cy7-conjugated antibodies separately or simultaneously as recently described (refs. 53, 54, and see Supplemental Table 6 for specific antibody-dye combinations and staining sequence). Image capture was performed, as previously described (54), using an automated epifluorescent Olympus IX-81 microscope outfitted with software developed at GE Global Research for reimaging of same fields of view. Image stacks were then registered, using DAPI stains collected at each round of imaging, and autofluorescence was removed as previously described (53, 54). Composite image overlays were generated by the importing of grayscale TIFF images into .ZVI format (AxioVision 4.6, Carl Zeiss Microscopy) and unique pseudocolors assigned to the respective images. Images were analyzed and false-colored using visualization software as previously described (54). The threshold for cytoplasmic PLAC8 expression was set to 10% of the cell population using software as previously described (54). The threshold of the other markers was set to include all positively expressing cells. Images for PLAC8+ cells were then overlaid with cells coexpressing VIM and CK or CDH1 and CDH3.
Immunoprecipitation.
HEK293 cells were transfected with Lipofectamine 2000 (Life Technologies). Cells were lysed in NP-40 lysis buffer 24 hours after transfection. Soluble lysates were precleared with protein G Sepharose Beads (Life Technologies), then 2.5 μg anti-Myc (9E10) antibody or anti-GFP antibody (Life Technologies, A-11122) was added. After overnight incubation at 4°C, Dynabeads Protein G (Life Technologies) were used to precipitate immunocomplex for immunoblotting analysis.
Yeast 2-hybrid.
The full-length cDNA of PLAC8 was cloned to pGADT7, and the full-length cDNA of DUSP6 was cloned into pGBKT7 vector of Matchmaker yeast 2-hybrid system (Clontech). The yeast strain AH109 (Clontech) was transformed with 1 μg DNA using the lithium acetate method (87). After transformation, yeast cells were streaked on selection SD-LW (lacking leucine and tryptophan), SD-HLW (lacking histidine, leucine, and tryptophan), and SD-AHLW (lacking alanine, histidine, leucine, and tryptophan) agar plates and incubated for 3 days at 30°C.
In vitro phosphatase activity assay.
Recombinant full-length DUSP6 and DUSP3 proteins were purchased from Creative BioMart. Phosphatase activity was measured using 0.1 mg/ml 3-O-methylfluorescein phosphate as the substrate in a 96-well plate assay with a BioTek Synergy 4 plate reader (excitation 485 nm, emission 528 nm) (88, 89). The phosphatase buffer contained 50 mM Tris-HCl (pH 8.2), 100 mM NaCl, 1 mM DTT, and 10% glycerol. For DUSP3 phosphatase activity assay, a final concentration of 0.22 μM DUSP3 was mixed with 1.2 μM of MBP-PLAC8 or MBP protein in a final volume of 100 μl in phosphatase assay buffer. PhosSTOP phosphatase inhibitor cocktail tablets (Roche) were used as a control (1 tablet was dissolved in 7 ml PBS buffer, and 5 μl was used). For DUSP6 phosphatase activity assay, a final concentration of 0.25 μM DUSP6 was mixed with 0.625 μM ERK2 protein and 1.2 μM of MBP-PLAC8 or MBP protein in a final volume of 100 μl in phosphatase assay buffer.
Statistics.
ANOVA, 2-tailed Student’s t test, and Mann-Whitney U test were used to determine statistical significance. P values less than 0.05 were considered significant. Calculations were performed using GraphPad for Mac, Matlab 2010 for Mac, and R 2.15 (64-bit for Mac).
Study approval.
All human samples used in this study were considered surgical waste and exempt from IRB approval. All protocols and experiments performed in mice were approved by the Vanderbilt University Medical School (Nashville, TN). All protocols and experiments performed in zebrafish were approved by the Washington University School of Medicine (St. Louis, MO) and Vanderbilt University Medical School (Nashville, TN).
Supplementary Material
Acknowledgments
We thank J.A. Marrs for gifts of antibodies; G.D. Longmore, S.K. Dutcher, P.V. Bayly, A.B. Reynolds, J.G. Patton, J.T. Gamse, D.S. Sepich, and R.S. Gray for critical comments and discussions; E.A. Sanders, S. Canter, A. Bradshaw, and H. Beck for excellent zebrafish care; Vanderbilt Antibody and Protein Resource core laboratory for generating the anti-PLAC8 and anti-Plac8.1 antibodies, and for providing purified MBP-mPLAC8 and MBP proteins; Sireesha Kaanumalle and Sean Dinn for antibody conjugation; Elizabeth Collins for multiplex staining; and Emily Poulin for editorial assistance. This work is supported by the National Cancer Institute (CA46413, CA174377 to R.J. Coffey), the Gastrointestinal Specialized Program of Research Excellence (P50-CA095103 to R.J. Coffey), and the NIH Common Fund Single Cell Analysis Program (RO1-CA174377 to M.J. Gerdes and R.J. Coffey, T32-CA119925 to A.E. Powell, 5T32-CA009582-25 to A. Starchenko, P30-CA68485 to Vanderbilt Antibody and Protein Resource core laboratory, and GM55101 to L. Solnica-Krezel).
Footnotes
Conflict of interest: Vidya Kamath, Keyur Desai, and Michael J. Gerdes are affiliated with GE Global Research Center, Niskayuna, New York, USA, and are current employees of General Electric Company.
Citation for this article:J Clin Invest. 2014;124(5):2172–2187. doi:10.1172/JCI71103.
Cunxi Li’s present address is: Molecular Cytogenetics Laboratory, Beijing Jiaen Hospital, Beijing, China.
References
- 1.Rissoan MC, et al. Subtractive hybridization reveals the expression of immunoglobulin-like transcript 7, Eph-B1, granzyme B, and 3 novel transcripts in human plasmacytoid dendritic cells. Blood. 2002;100(9):3295–3303. doi: 10.1182/blood-2002-02-0638. [DOI] [PubMed] [Google Scholar]
- 2.Galaviz-Hernandez C, et al. Plac8 and Plac9, novel placental-enriched genes identified through microarray analysis. Gene. 2003;309(2):81–89. doi: 10.1016/S0378-1119(03)00508-0. [DOI] [PubMed] [Google Scholar]
- 3.Ledford JG, Kovarova M, Koller BH. Impaired host defense in mice lacking ONZIN. J Immunol. 2007;178(8):5132–5143. doi: 10.4049/jimmunol.178.8.5132. [DOI] [PubMed] [Google Scholar]
- 4.Ledford JG, Kovarova M, Jania LA, Nguyen M, Koller BH. ONZIN deficiency attenuates contact hypersensitivity responses in mice. Immunol Cell Biol. 2012;90(7):733–742. doi: 10.1038/icb.2011.107. [DOI] [PMC free article] [PubMed] [Google Scholar]
- 5.Jimenez-Preitner M, et al. Plac8 is an inducer of C/EBPbeta required for brown fat differentiation, thermoregulation, and control of body weight. Cell Metab. 2011;14(5):658–670. doi: 10.1016/j.cmet.2011.08.008. [DOI] [PubMed] [Google Scholar]
- 6.Jimenez-Preitner M, Berney X, Thorens B. Plac8 is required for white adipocyte differentiation in vitro and cell number control in vivo. PLoS One. 2012;7(11):e48767. doi: 10.1371/journal.pone.0048767. [DOI] [PMC free article] [PubMed] [Google Scholar]
- 7.McMurray HR, et al. Synergistic response to oncogenic mutations defines gene class critical to cancer phenotype. Nature. 2008;453(7198):1112–1116. doi: 10.1038/nature06973. [DOI] [PMC free article] [PubMed] [Google Scholar]
- 8.Thiery JP, Acloque H, Huang RY, Nieto MA. Epithelial-mesenchymal transitions in development and disease. Cell. 2009;139(5):871–90. doi: 10.1016/j.cell.2009.11.007. [DOI] [PubMed] [Google Scholar]
- 9.Kalluri R, Weinberg RA. The basics of epithelial-mesenchymal transition. J Clin Invest. 2009;119(6):1420–1428. doi: 10.1172/JCI39104. [DOI] [PMC free article] [PubMed] [Google Scholar]
- 10.Brabletz T, Jung A, Spaderna S, Hlubek F, Kirchner T. Opinion: migrating cancer stem cells — an integrated concept of malignant tumour progression. Nat Rev Cancer. 2005;5(9):744–749. doi: 10.1038/nrc1694. [DOI] [PubMed] [Google Scholar]
- 11.Nieto MA. Epithelial plasticity: a common theme in embryonic and cancer cells. Science. 2013;342(6159):1234850. doi: 10.1126/science.1234850. [DOI] [PubMed] [Google Scholar]
- 12.Valastyan S, Weinberg RA. Tumor metastasis: molecular insights and evolving paradigms. Cell. 2011;147(2):275–292. doi: 10.1016/j.cell.2011.09.024. [DOI] [PMC free article] [PubMed] [Google Scholar]
- 13.Smith SC, Theodorescu D. Learning therapeutic lessons from metastasis suppressor proteins. Nat Rev Cancer. 2009;9(4):253–264. doi: 10.1038/nrc2594. [DOI] [PMC free article] [PubMed] [Google Scholar]
- 14.Nieto MA, Sargent MG, Wilkinson DG, Cooke J. Control of cell behavior during vertebrate development by Slug, a zinc finger gene. Science. 1994;264(5160):835–839. doi: 10.1126/science.7513443. [DOI] [PubMed] [Google Scholar]
- 15.Brabletz T, et al. Invasion and metastasis in colorectal cancer: epithelial-mesenchymal transition, mesenchymal-epithelial transition, stem cells and beta-catenin. Cells Tissues Organs. 2005;179(1–2):56–65. doi: 10.1159/000084509. [DOI] [PubMed] [Google Scholar]
- 16.Kang Y, Massague J. Epithelial-mesenchymal transitions: twist in development and metastasis. Cell. 2004;118(3):277–279. doi: 10.1016/j.cell.2004.07.011. [DOI] [PubMed] [Google Scholar]
- 17.Thiery JP, Sleeman JP. Complex networks orchestrate epithelial-mesenchymal transitions. Nat Rev Mol Cell Biol. 2006;7(2):131–142. doi: 10.1038/nrm1835. [DOI] [PubMed] [Google Scholar]
- 18.Baum B, Settleman J, Quinlan MP. Transitions between epithelial and mesenchymal states in development and disease. Semin Cell Dev Biol. 2008;19(3):294–308. doi: 10.1016/j.semcdb.2008.02.001. [DOI] [PubMed] [Google Scholar]
- 19.Park J, et al. Down-regulation of P-cadherin with PF-03732010 inhibits cell migration and tumor growth in gastric cancer. Invest New Drugs. 2012;30(4):1404–1412. doi: 10.1007/s10637-011-9710-9. [DOI] [PubMed] [Google Scholar]
- 20.Sun L, et al. P-cadherin promotes liver metastasis and is associated with poor prognosis in colon cancer. Am J Pathol. 2011;179(1):380–390. doi: 10.1016/j.ajpath.2011.03.046. [DOI] [PMC free article] [PubMed] [Google Scholar]
- 21.Hardy RG, et al. Aberrant P-cadherin expression is an early event in hyperplastic and dysplastic transformation in the colon. Gut. 2002;50(4):513–519. doi: 10.1136/gut.50.4.513. [DOI] [PMC free article] [PubMed] [Google Scholar]
- 22.Shin S, Dimitri CA, Yoon SO, Dowdle W, Blenis J. ERK2 but not ERK1 induces epithelial-to-mesenchymal transformation via DEF motif-dependent signaling events. Mol Cell. 2010;38(1):114–127. doi: 10.1016/j.molcel.2010.02.020. [DOI] [PMC free article] [PubMed] [Google Scholar]
- 23.Muda M, et al. MKP-3, a novel cytosolic protein-tyrosine phosphatase that exemplifies a new class of mitogen-activated protein kinase phosphatase. J Biol Chem. 1996;271(8):4319–4326. doi: 10.1074/jbc.271.8.4319. [DOI] [PubMed] [Google Scholar]
- 24.Powell AE, et al. The pan-ErbB negative regulator Lrig1 is an intestinal stem cell marker that functions as a tumor suppressor. Cell. 2012;149(1):146–158. doi: 10.1016/j.cell.2012.02.042. [DOI] [PMC free article] [PubMed] [Google Scholar]
- 25.Leibovitz A, et al. Classification of human colorectal adenocarcinoma cell lines. Cancer Res. 1976;36(12):4562–4569. [PubMed] [Google Scholar]
- 26.Kitadai Y, et al. Regulation of carcinoembryonic antigen expression in human colon carcinoma cells by the organ microenvironment. Am J Pathol. 1996;149(4):1157–1166. [PMC free article] [PubMed] [Google Scholar]
- 27.Drewinko B, Romsdahl MM, Yang LY, Ahearn MJ, Trujillo JM. Establishment of a human carcinoembryonic antigen-producing colon adenocarcinoma cell line. Cancer Res. 1976;36(2 pt 1):467–475. [PubMed] [Google Scholar]
- 28.Santoriello C, Zon LI. Hooked! Modeling human disease in zebrafish. J Clin Invest. 2012;122(7):2337–2343. doi: 10.1172/JCI60434. [DOI] [PMC free article] [PubMed] [Google Scholar]
- 29.Moreno-Hagelsieb G, Latimer K. Choosing BLAST options for better detection of orthologs as reciprocal best hits. Bioinformatics. 2008;24(3):319–324. doi: 10.1093/bioinformatics/btm585. [DOI] [PubMed] [Google Scholar]
- 30.Woods IG, et al. A comparative map of the zebrafish genome. Genome Res. 2000;10(12):1903–1914. doi: 10.1101/gr.10.12.1903. [DOI] [PMC free article] [PubMed] [Google Scholar]
- 31.Concha ML, Adams RJ. Oriented cell divisions and cellular morphogenesis in the zebrafish gastrula and neurula: a time-lapse analysis. Development. 1998;125(6):983–994. doi: 10.1242/dev.125.6.983. [DOI] [PubMed] [Google Scholar]
- 32.Sepich DS, Usmani M, Pawlicki S, Solnica-Krezel L. Wnt/PCP signaling controls intracellular position of MTOCs during gastrulation convergence and extension movements. Development. 2011;138(3):543–552. doi: 10.1242/dev.053959. [DOI] [PMC free article] [PubMed] [Google Scholar]
- 33.Schulte-Merker S, van Eeden FJ, Halpern ME, Kimmel CB, Nusslein-Volhard C. no tail (ntl) is the zebrafish homologue of the mouse T (Brachyury) gene. Development. 1994;120(4):1009–1015. doi: 10.1242/dev.120.4.1009. [DOI] [PubMed] [Google Scholar]
- 34.Lin F, et al. Gα12/13 regulate epiboly by inhibiting E-cadherin activity and modulating the actin cytoskeleton. J Cell Biol. 2009;184(6):909–921. doi: 10.1083/jcb.200805148. [DOI] [PMC free article] [PubMed] [Google Scholar]
- 35.Babb SG, Marrs JA. E-cadherin regulates cell movements and tissue formation in early zebrafish embryos. Dev Dyn. 2004;230(2):263–277. doi: 10.1002/dvdy.20057. [DOI] [PubMed] [Google Scholar]
- 36.Shimizu T, et al. E-cadherin is required for gastrulation cell movements in zebrafish. Mech Dev. 2005;122(6):747–763. doi: 10.1016/j.mod.2005.03.008. [DOI] [PubMed] [Google Scholar]
- 37.Kane DA, McFarland KN, Warga RM. Mutations in half baked/E-cadherin block cell behaviors that are necessary for teleost epiboly. Development. 2005;132(5):1105–1116. doi: 10.1242/dev.01668. [DOI] [PubMed] [Google Scholar]
- 38.McFarland KN, Warga RM, Kane DA. Genetic locus half baked is necessary for morphogenesis of the ectoderm. Dev Dyn. 2005;233(2):390–406. doi: 10.1002/dvdy.20325. [DOI] [PubMed] [Google Scholar]
- 39.Ashby WJ, Zijlstra A. Established and novel methods of interrogating two-dimensional cell migration. Integr Biol (Camb). 2012;4(11):1338–1350. doi: 10.1039/c2ib20154b. [DOI] [PMC free article] [PubMed] [Google Scholar]
- 40.Piepenhagen PA, Nelson WJ. Defining E-cadherin-associated protein complexes in epithelial cells: plakoglobin, β-, and γ-catenin are distinct components. J Cell Sci. 1993;104(pt 3):751–762. doi: 10.1242/jcs.104.3.751. [DOI] [PubMed] [Google Scholar]
- 41.Soini Y. Tight junctions in lung cancer and lung metastasis: a review. Int J Clin Exp Pathol. 2012;5(2):126–136. [PMC free article] [PubMed] [Google Scholar]
- 42.Masuda R, Semba S, Mizuuchi E, Yanagihara K, Yokozaki H. Negative regulation of the tight junction protein tricellulin by snail-induced epithelial-mesenchymal transition in gastric carcinoma cells. Pathobiology. 2010;77(2):106–113. doi: 10.1159/000278293. [DOI] [PubMed] [Google Scholar]
- 43.Ohkubo T, Ozawa M. The transcription factor Snail downregulates the tight junction components independently of E-cadherin downregulation. J Cell Sci. 2004;117(pt 9):1675–1685. doi: 10.1242/jcs.01004. [DOI] [PubMed] [Google Scholar]
- 44.Javle MM, et al. Epithelial-mesenchymal transition (EMT) and activated extracellular signal-regulated kinase (p-Erk) in surgically resected pancreatic cancer. Ann Surg Oncol. 2007;14(12):3527–3533. doi: 10.1245/s10434-007-9540-3. [DOI] [PubMed] [Google Scholar]
- 45.Larue L, Bellacosa A. Epithelial-mesenchymal transition in development and cancer: role of phosphatidylinositol 3′ kinase/AKT pathways. Oncogene. 2005;24(50):7443–7454. doi: 10.1038/sj.onc.1209091. [DOI] [PubMed] [Google Scholar]
- 46.Grille SJ, et al. The protein kinase Akt induces epithelial mesenchymal transition and promotes enhanced motility and invasiveness of squamous cell carcinoma lines. Cancer Res. 2003;63(9):2172–2178. [PubMed] [Google Scholar]
- 47.Guarino M. Src signaling in cancer invasion. J Cell Physiol. 2010;223(1):14–26. doi: 10.1002/jcp.22011. [DOI] [PubMed] [Google Scholar]
- 48.Rogulski K, et al. Onzin, a c-Myc-repressed target, promotes survival and transformation by modulating the Akt-Mdm2-p53 pathway. Oncogene. 2005;24(51):7524–7541. doi: 10.1038/sj.onc.1208897. [DOI] [PubMed] [Google Scholar]
- 49.Kwak SP, Dixon JE. Multiple dual specificity protein tyrosine phosphatases are expressed and regulated differentially in liver cell lines. J Biol Chem. 1995;270(3):1156–1160. doi: 10.1074/jbc.270.3.1156. [DOI] [PubMed] [Google Scholar]
- 50.Todd JL, Tanner KG, Denu JM. Extracellular regulated kinases (ERK) 1 and ERK2 are authentic substrates for the dual-specificity protein-tyrosine phosphatase VHR. A novel role in down-regulating the ERK pathway. J Biol Chem. 1999;274(19):13271–13280. doi: 10.1074/jbc.274.19.13271. [DOI] [PubMed] [Google Scholar]
- 51.Keyse SM. Dual-specificity MAP kinase phosphatases (MKPs) and cancer. Cancer Metastasis Rev. 2008;27(2):253–261. doi: 10.1007/s10555-008-9123-1. [DOI] [PubMed] [Google Scholar]
- 52.Camps M, et al. Catalytic activation of the phosphatase MKP-3 by ERK2 mitogen-activated protein kinase. Science. 1998;280(5367):1262–1265. doi: 10.1126/science.280.5367.1262. [DOI] [PubMed] [Google Scholar]
- 53.Nelson DA, et al. Quantitative single cell analysis of cell population dynamics during submandibular salivary gland development and differentiation. Biol Open. 2013;2(5):439–447. doi: 10.1242/bio.20134309. [DOI] [PMC free article] [PubMed] [Google Scholar]
- 54.Gerdes MJ, et al. Highly multiplexed single-cell analysis of formalin-fixed, paraffin-embedded cancer tissue. Proc Natl Acad Sci U S A. 2013;110(29):11982–11987. doi: 10.1073/pnas.1300136110. [DOI] [PMC free article] [PubMed] [Google Scholar]
- 55.Libault M, Stacey G. Evolution of FW2.2-like (FWL) and PLAC8 genes in eukaryotes. Plant Signal Behav. 2010;5(10):1226–1228. doi: 10.4161/psb.5.10.12808. [DOI] [PMC free article] [PubMed] [Google Scholar]
- 56.Song WY, Hortensteiner S, Tomioka R, Lee Y, Martinoia E. Common functions or only phylogenetically related? The large family of PLAC8 motif-containing/PCR genes. Mol Cells. 2011;31(1):1–7. doi: 10.1007/s10059-011-0024-8. [DOI] [PMC free article] [PubMed] [Google Scholar]
- 57.Guo M, et al. Cell Number Regulator1 affects plant and organ size in maize: implications for crop yield enhancement and heterosis. Plant Cell. 2010;22(4):1057–1073. doi: 10.1105/tpc.109.073676. [DOI] [PMC free article] [PubMed] [Google Scholar]
- 58.Hughes L, O’Brien SL, Gallagher WM, McDonnell S. DNA microarray-based transcriptomic profiling of an isogenic cell culture model of breast tumour cell invasion. Anticancer Res. 2007;27(3A):1353–1359. [PubMed] [Google Scholar]
- 59.Uehara H, Takahashi T, Izumi K. Induction of retinol-binding protein 4 and placenta-specific 8 expression in human prostate cancer cells remaining in bone following osteolytic tumor growth inhibition by osteoprotegerin. Int J Oncol. 2013;43(2):365–374. doi: 10.3892/ijo.2013.1954. [DOI] [PMC free article] [PubMed] [Google Scholar]
- 60.Abdel-Rahman WM, et al. Spectral karyotyping suggests additional subsets of colorectal cancers characterized by pattern of chromosome rearrangement. Proc Natl Acad Sci U S A. 2001;98(5):2538–2543. doi: 10.1073/pnas.041603298. [DOI] [PMC free article] [PubMed] [Google Scholar]
- 61.Paredes J, et al. Epithelial E- and P-cadherins: role and clinical significance in cancer. Biochim Biophys Acta. 2012;1826(2):297–311. doi: 10.1016/j.bbcan.2012.05.002. [DOI] [PubMed] [Google Scholar]
- 62.Mandeville JA, et al. P-cadherin as a prognostic indicator and a modulator of migratory behaviour in bladder carcinoma cells. BJU Int. 2008;102(11):1707–1714. doi: 10.1111/j.1464-410X.2008.08115.x. [DOI] [PubMed] [Google Scholar]
- 63.Paredes J, Correia AL, Ribeiro AS, Milanezi F, Cameselle-Teijeiro J, Schmitt FC. Breast carcinomas that co-express E- and P-cadherin are associated with p120-catenin cytoplasmic localisation and poor patient survival. J Clin Pathol. 2008;61(7):856–862. doi: 10.1136/jcp.2007.052704. [DOI] [PubMed] [Google Scholar]
- 64.Taniuchi K, et al. Overexpressed P-cadherin/CDH3 promotes motility of pancreatic cancer cells by interacting with p120ctn and activating rho-family GTPases. Cancer Res. 2005;65(8):3092–3099. doi: 10.1158/0008.5472.CAN-04-3646. [DOI] [PubMed] [Google Scholar]
- 65.Paredes J, et al. P-cadherin is up-regulated by the antiestrogen ICI 182,780 and promotes invasion of human breast cancer cells. Cancer Res. 2004;64(22):8309–8317. doi: 10.1158/0008-5472.CAN-04-0795. [DOI] [PubMed] [Google Scholar]
- 66.Cheung LW, Leung PC, Wong AS. Cadherin switching and activation of p120 catenin signaling are mediators of gonadotropin-releasing hormone to promote tumor cell migration and invasion in ovarian cancer. Oncogene. 2010;29(16):2427–2440. doi: 10.1038/onc.2009.523. [DOI] [PubMed] [Google Scholar]
- 67.Ireton RC, et al. A novel role for p120 catenin in E-cadherin function. J Cell Biol. 2002;159(3):465–476. doi: 10.1083/jcb.200205115. [DOI] [PMC free article] [PubMed] [Google Scholar]
- 68.Ji H, et al. EGF-induced ERK activation promotes CK2-mediated disassociation of α-catenin from β-catenin and transactivation of β-catenin. Mol Cell. 2009;36(4):547–559. doi: 10.1016/j.molcel.2009.09.034. [DOI] [PMC free article] [PubMed] [Google Scholar]
- 69.Fang D, et al. Phosphorylation of β-catenin by AKT promotes beta-catenin transcriptional activity. J Biol Chem. 2007;282(15):11221–11229. doi: 10.1074/jbc.M611871200. [DOI] [PMC free article] [PubMed] [Google Scholar]
- 70.Fujita Y, et al. Hakai, a c-Cbl-like protein, ubiquitinates and induces endocytosis of the E-cadherin complex. Nat Cell Biol. 2002;4(3):222–231. doi: 10.1038/ncb758. [DOI] [PubMed] [Google Scholar]
- 71.Sepich DS, Solnica-Krezel L. Analysis of cell movements in zebrafish embryos: morphometrics and measuring movement of labeled cell populations in vivo. Methods Mol Biol. 2005;294:211–33. doi: 10.1385/1-59259-860-9:211. [DOI] [PubMed] [Google Scholar]
- 72.Lin F, et al. Essential roles of Gα12/13 signaling in distinct cell behaviors driving zebrafish convergence and extension gastrulation movements. J Cell Biol. 2005;169(5):777–787. doi: 10.1083/jcb.200501104. [DOI] [PMC free article] [PubMed] [Google Scholar]
- 73.Speirs CK, et al. Prostaglandin Gβγ signaling stimulates gastrulation movements by limiting cell adhesion through Snai1a stabilization. Development. 2010;137(8):1327–1337. doi: 10.1242/dev.045971. [DOI] [PMC free article] [PubMed] [Google Scholar]
- 74.von der Hardt S, et al. The Bmp gradient of the zebrafish gastrula guides migrating lateral cells by regulating cell-cell adhesion. Curr Biol. 2007;17(6):475–487. doi: 10.1016/j.cub.2007.02.013. [DOI] [PubMed] [Google Scholar]
- 75.Barone V, Heisenberg CP. Cell adhesion in embryo morphogenesis. Curr Opin Cell Biol. 2012;24(1):148–153. doi: 10.1016/j.ceb.2011.11.006. [DOI] [PubMed] [Google Scholar]
- 76.Friedl P. Prespecification and plasticity: shifting mechanisms of cell migration. Curr Opin Cell Biol. 2004;16(1):14–23. doi: 10.1016/j.ceb.2003.11.001. [DOI] [PubMed] [Google Scholar]
- 77.Hall HG, Farson DA, Bissell MJ. Lumen formation by epithelial cell lines in response to collagen overlay: a morphogenetic model in culture. Proc Natl Acad Sci U S A. 1982;79(15):4672–4676. doi: 10.1073/pnas.79.15.4672. [DOI] [PMC free article] [PubMed] [Google Scholar]
- 78.Debnath J, Brugge JS. Modelling glandular epithelial cancers in three-dimensional cultures. Nat Rev Cancer. 2005;5(9):675–688. doi: 10.1038/nrc1695. [DOI] [PubMed] [Google Scholar]
- 79.Jaffe AB, Kaji N, Durgan J, Hall A. Cdc42 controls spindle orientation to position the apical surface during epithelial morphogenesis. J Cell Biol. 2008;183(4):625–633. doi: 10.1083/jcb.200807121. [DOI] [PMC free article] [PubMed] [Google Scholar]
- 80.Coffey RJ, et al. Epidermal growth factor receptor activation induces nuclear targeting of cyclooxygenase-2, basolateral release of prostaglandins, and mitogenesis in polarizing colon cancer cells. Proc Natl Acad Sci U S A. 1997;94(2):657–662. doi: 10.1073/pnas.94.2.657. [DOI] [PMC free article] [PubMed] [Google Scholar]
- 81.Meylan E, et al. Requirement for NF-κB signalling in a mouse model of lung adenocarcinoma. Nature. 2009;462(7269):104–107. doi: 10.1038/nature08462. [DOI] [PMC free article] [PubMed] [Google Scholar]
- 82.Topczewska JM, Topczewski J, Shostak A, Kume T, Solnica-Krezel L, Hogan BL. The winged helix transcription factor Foxc1a is essential for somitogenesis in zebrafish. Genes Dev. 2001;15(18):2483–93. doi: 10.1101/gad.907401. [DOI] [PMC free article] [PubMed] [Google Scholar]
- 83.Euhus DM, Hudd C, LaRegina MC, Johnson FE. Tumor measurement in the nude mouse. J Surg Oncol. 1986;31(4):229–234. doi: 10.1002/jso.2930310402. [DOI] [PubMed] [Google Scholar]
- 84.Tomayko MM, Reynolds CP. Determination of subcutaneous tumor size in athymic (nude) mice. Cancer Chemother Pharmacol. 1989;24(3):148–154. doi: 10.1007/BF00300234. [DOI] [PubMed] [Google Scholar]
- 85.Thisse C, Thisse B. High-resolution in situ hybridization to whole-mount zebrafish embryos. Nat Protoc. 2008;3(1):59–69. doi: 10.1038/nprot.2007.514. [DOI] [PubMed] [Google Scholar]
- 86.Sepich DS, Calmelet C, Kiskowski M, Solnica-Krezel L. Initiation of convergence and extension movements of lateral mesoderm during zebrafish gastrulation. Dev Dyn. 2005;234(2):279–292. doi: 10.1002/dvdy.20507. [DOI] [PubMed] [Google Scholar]
- 87.Hinnen A, Hicks JB, Fink GR. Transformation of yeast. Proc Natl Acad Sci U S A. 1978;75(4):1929–1933. doi: 10.1073/pnas.75.4.1929. [DOI] [PMC free article] [PubMed] [Google Scholar]
- 88.Lazo JS, et al. Discovery and biological evaluation of a new family of potent inhibitors of the dual specificity protein phosphatase Cdc25. J Med Chem. 2001;44(24):4042–4049. doi: 10.1021/jm0102046. [DOI] [PubMed] [Google Scholar]
- 89.Lazo JS, Nunes R, Skoko JJ, Queiroz de Oliveira PE, Vogt A, Wipf P. Novel benzofuran inhibitors of human mitogen-activated protein kinase phosphatase-1. Bioorg Med Chem. 2006;14(16):5643–5650. doi: 10.1016/j.bmc.2006.04.036. [DOI] [PubMed] [Google Scholar]
Associated Data
This section collects any data citations, data availability statements, or supplementary materials included in this article.