

Abstract
A single G protein–coupled receptor (GPCR) can activate multiple signaling cascades based on the binding of different ligands. The biological relevance of this feature in immune regulation has not been evaluated. The chemokine-binding GPCR CXCR3 is preferentially expressed on CD4+ T cells, and canonically binds 3 structurally related chemokines: CXCL9, CXCL10, and CXCL11. Here we have shown that CXCL10/CXCR3 interactions drive effector Th1 polarization via STAT1, STAT4, and STAT5 phosphorylation, while CXCL11/CXCR3 binding induces an immunotolerizing state that is characterized by IL-10hi (Tr1) and IL-4hi (Th2) cells, mediated via p70 kinase/mTOR in STAT3- and STAT6-dependent pathways. CXCL11 binds CXCR3 with a higher affinity than CXCL10, suggesting that CXCL11 has the potential to restrain inflammatory autoimmunity. We generated a CXCL11-Ig fusion molecule and evaluated its use in the EAE model of inflammatory autoimmune disease. Administration of CXCL11-Ig during the first episode of relapsing EAE in SJL/J mice not only led to rapid remission, but also prevented subsequent relapse. Using GFP-expressing effector CD4+ T cells, we observed that successful therapy was associated with reduced accumulation of these cells at the autoimmune site. Finally, we showed that very low doses of CXCL11 rapidly suppress signs of EAE in C57BL/6 mice lacking functional CXCL11.
Introduction
EAE is an inflammatory autoimmune disease of the CNS that serves as a model for MS (1–4). In EAE and MS, CD4+ effector T cells, proliferating in response to myelin antigens, are likely to promote the development and progression of each disease (5–8). This includes IL-17hi Th17 cells, which direct tissue inflammation, and Th1 cells, which promote cellular immunity (5–9). The inflammatory reactivity of these effector T cells is tightly regulated by at least 2 major subsets of CD4+ T cells: FOXP3+CD25+ and FOXP3–IL-10hi (10–12). Based on their cytokine profile, FOXP3–CD4+ Tregs fall into 2 major subtypes: those that predominantly produce TGF-β (Th3) and display a major role in maintaining tolerance within the gut (13), and those that mostly secrete IL-10 (Tr1) (12).
Chemokines are small (∼8–14 kDa), structurally related chemotactic cytokines that regulate cell trafficking through interactions with specific 7-transmembrane GPCRs (14–16). One of the important features of GPCRs is their ability to transmit diverse signaling cascades upon binding different ligands (17–21). The relevance for the interplay between different chemokines binding different sites within the same receptor has not yet been explored.
Most attention has been drawn to the key role of these chemotactic mediators in promoting lymphocyte migration processes critical for the onset of inflammatory processes, with special interest in inflammatory autoimmune diseases, mainly MS and its experimental models (22–35). Recently, we challenged this concept and showed that the ubiquitous chemokine CXCL12 functions as an antiinflammatory mediator that polarizes IL-10–producing Tr1 cells during ongoing EAE (36). It remains unclear, however, whether CXCL12 represents a single case of an immunomodulatory chemokine with inflammation-suppressing activities.
CXCR3 is a chemokine receptor preferentially expressed on inflammatory effector T cells, including Th1 (37, 38) as well as IL-17–producing Th17 cells (39), and also on NK cells (38). 3 ligands bind this receptor: CXCL9 (MIG), CXCL10 (IP-10), and CXCL11 (I-TAC) (40). CXCL9 and CXCL10 bind a target epitope on CXCR3 that differs from the target of CXCL11 (40, 41). Importantly, CXCL11 binds CXCR3 with much higher affinity than it does CXCL9 and CXCL10, leading to receptor desensitization (40, 41), which makes it a potential antagonist of these 2 ligands. It should be noted, however, that CXCL11 binds a different binding site on CXCR3 than on CXCL9 and CXCL10 (40). We have previously shown that neutralizing antibodies against CXCL10 rapidly suppress ongoing EAE and adjuvant arthritis (42, 43), which suggests that CXCL10 is a proinflammatory chemokine in the pathogenesis of autoimmunity. Others using CXCL10-specific antibodies obtained similar results (33). Much less is known about the role of the other 2 CXCR3 ligands, CXCL9 and CXCL11, in the regulation of autoimmunity.
Here, we showed that whereas CXCL10 polarizes effector Th1 cells, CXCL11 not only polarizes naive T cells into IL-10hi Tregs (Tr1), but also repolarizes CXCR3+CD4+ EAE-associated effector T cells into IL-10hi Tregs. Moreover, we found that exogenous in vivo administration of CXCL11 suppresses ongoing EAE, while providing a prolonged state of disease resistance.
Results
CXCL11 polarizes Tr1-like cells in a CXCR3-dependent manner.
We initially established a model system with which to evaluate the effect of the CXCR3-binding chemokines CXCL9, CXCL10, and CXCL11 on the induction of CXCR3 desensitization. In these experiments, each chemokine was added 24 hours after combined anti-CD3/anti-CD28 activation of CD4+ T cells. At different time points, extracellular expression of CXCR3 was determined by flow cytometry. Throughout the study, we used chemokines below desensitization levels in all our in vitro assays.
We first quantified the kinetics of CXCR3 expression during T cell activation. CD4+ T cells were isolated (MACs MicroBeads) from the LNs of naive mice and activated with anti-CD3/anti-CD28. Flow cytometric analysis revealed that expression of this receptor gradually increased over the first 24 hours (Figure 1A). In a subsequent experiment, these cells were isolated from IL-10 GFP transgenic mice (44), subjected to anti-CD3/anti-CD28 mAb activation, and, 24 hours later, supplemented with CXCL10, CXCL11, or CXCL9. After an additional 48 hours, cells were subjected to flow cytometry analysis. Whereas CXCL10 skewed T cell polarization into IL-17hiIFN-γlo Th17 cells (from 2.6% to 7.8%) and IFN-γhiIL-4lo Th1 cells (from 12.7% to 20.8%), CXCL11 polarized these cells into IL-10hi Tr1-like cells (from 0.7% to 13.8%) and reciprocally decreased polarization of Th1 and Th17 CD4+ T cells. Addition of CXCL9 to these cultured T cells polarized them to a Th1/Th17 phenotype, as did CXL10 (data not shown). In all these experiments, we verified that chemokine levels (100 ng/ml; R&D Systems) were below the levels required for CXCR3 desensitization (data not shown). Comprehensive analysis of all 3 independent experiments is shown in Supplemental Figure 2 (supplemental material available online with this article; doi: 10.1172/JCI71951DS1).
Figure 1. Distinct CXCR3 ligands differentially polarize CD4+ T cells in a CXCR3-dependent manner.

(A) CXCR3 expression on CD4+CD3+ cells increased over the first 24 hours of anti-CD3/anti-CD28 activation, as detected by flow cytometry. (B) CD4+ T cells were anti-CD3/anti-CD28 activated in cultures supplemented with CXCL10 or CXCL11, and IL-4, IL-17, and IFN-γ were detected by flow cytometry. CXCL10 polarized IFN-γhiIL-4lo Th1 cells, whereas CXCL11 polarized IL-10hi Tr1 cells and IFN-γloIL-4hi Th2 cells. (C) After anti-CD3/anti-CD28 activation, CD4+ T cells were analyzed for CXCR3 and FOXP3 expression. A small portion of CXCR3+CD4+ T cells were FOXP3+ (3.3%). (D) 24 hours after anti-CD3/anti-CD28 activation of CD4+ T cells, cultures were supplemented with CXCL10 or CXCL11. 48 hours later, IL-10 was determined by flow cytometry. CXCL11 did not induce IL-10 production in FOXP3+CD4+ cells. (E) CD4+ T cells from SJL/J mice were anti-CD3/anti-CD28–activated; 24 hours later, cultures were supplemented with CXCL11 or CXCL10. 48 hours later, cytokine levels were determined by ELISA. CXCL11 induced IL-10 production, whereas CXCL10 induced IFN-γ production. (F) Freshly isolated human CD4+ T cells from healthy donors were activated with anti-CD3/anti-CD28. After 24 hours, cultures were supplemented with CXCL10 or CXCL11 together with anti-CXCR3 blocking mAb, anti-CXCR7 blocking mAb (R&D), PBS, or isotype-matched control IgG. 48 hours later, IL-10 and IL-4 levels were recorded. In all experiments, recombinant chemokines were added at 100 ng/ml (R&D systems). Data (mean ± SEM of triplicates) are from 1 of 3 independent experiments with similar results. *P < 0.001.
We next monitored the expression of CXCR3 on FOXP3+ and FOXP3– T cells (gated on CD3 and CD4). We observed distinct populations of CXCR3+FOXP3+ and CXCR3+FOXP3– CD4+ T cells (3.3% and 11.9%, respectively; Figure 1C). However, CXCL11 upregulated IL-10 only in CXCR3+FOXP3– CD4+ T cells (Figure 1D). The above experiments were initially conducted in C57BL/6 mice, due to the availability of GFP–IL-10 transgenic mice, which were advantageous for monitoring transcription of IL-10. These flow cytometric observations were also confirmed by measurement of IL-10 levels in the supernatants of cultured cells (ELISA for IL-10; data not shown). WT C57BL/6 mice display a shift in the open reading frame of the CXCL11-encoding gene (insertion of 2 bases after nucleotide 39), resulting in the translation of a chimeric protein lacking the critical CXC motif (45). Thus, we extended the above in vitro experiment to SJL/J mice. Addition of CXCL11 (but not CXCL10) to mitogen-activated CD4+ T cells from SJL/J mice (50 ng/well, 24 hours after initial activation) led to a significant increase in IL-10 production compared with controls (132 ± 8 vs. 25 ± 3 pg/ml, P < 0.001); conversely, CXCL10 induced IFN-γ production in these cells (312 ± 34 vs. 187 ± 15 pg/ml, P < 0.001; Figure 1E). Before exploring the clinical implications of these observations in experimental models of MS, we studied their potential relevance to the clinical setting. Human peripheral blood lymphocytes were subjected to anti-CD3/anti-CD28–induced activation in cultures supplemented with human recombinant CXCL11 or CXCL10 (50 ng/well, 24 hours after initial activation); 48 hours later, levels of IL-10 and IFN-γ were measured by ELISA. Whereas CXCL11 induced elevated production of IL-10 (from 36 ± 5 to 192 ± 30 pg/ml, P < 0.001), but not IFN-γ, CXCL10 induced a significant elevation in IFN-γ (P < 0.001), but not IL-10 (Figure 1F). CXCL11 binds 2 alternative receptors, CXCR3 (40) and CXCR7 (46). Moreover, CXCL12, the only known chemokine that also induces IL-10 in CD4+ T cells (36), also binds CXCR7, as well as CXCR4 (46). As blocking mAbs against human CXCR3 and CXCR7 are available (R&D Systems), we used them to determine whether CXCL11-induced IL-10 and CXCL10-induced IFN-γ were CXCR3 and/or CXCR7 dependent. The above-described CXCL11-induced elevation in IL-10 was entirely reversed by blocking antibodies against CXCR3 (from 192 ± 30 to 47 ± 5 pg/ml, P < 0.001; Figure 1F). Similarly, the upregulated production of CXCL10-induced IFN-γ was reversed by blockade of this receptor (Figure 1F). Blockade of CXCR7 had no effect on these properties (Figure 1F). Taken together, these results indicated that CXCL11 polarizes IL-10hiCD4+ Tr1-like cells in a CXCR3-dependent manner in both mice and humans. It has been suggested previously that CXCR7 is also expressed in an intracellular manner in CD4+ T cells (47). In order to evaluate the possibility that CXCR3 chemokines may be acting via intracellular binding to CXCR7, we used shRNA technology to knock down CXCR7 expression. Blockade of as much as 80% of the transcription of CXCR7 in CD4+ T cells undergoing anti-CD3/anti-CD28–induced activation had no effect on the induction of IL-10 by CXCL11 (Supplemental Figure 3). This strongly suggests that CXCR7 is not involved in CXCL11-induced IL-10 production.
CXCR3 ligands induce diverse signaling for cytokine production and chemotaxis via CXCR3.
Previous studies demonstrated that a unique feature of GPCRs is their capability to induce a variety of signaling cascades via activation of the same receptor (17, 18, 20, 21, 48). These findings are in accordance with the previous observation that CXCL12-induced cell migration, via CXCR4, is independent of its ability to induce cytokine production via the same receptor (49). Thus, pertussis toxin (PTX) inhibited GαI-dependent migration induced by CXCL12 via CXCR4, but not its ability to induce cytokine production in a JAK-STAT–dependent manner via the same receptor (49). We explored the relevance of these findings for the interplay between the classic CXCR3 ligands and their receptor; in particular, we tested whether CXCL10 and CXCL11 could trigger IFN-γ or IL-10 production independently of their ability to induce chemotaxis. In order to differentiate the effects on chemotaxis and cytokine production, we used PTX, a toxin that inhibits chemokine-induced GαI-dependent migration, but does not affect proinflammatory gene expression (50). Under conditions in which PTX entirely blocked CXCL10- and CXCL11-induced cell migration (CXCL11, migration index reduced from 9 ± 0.8 to 2.5 ± 0.3, P < 0.001; CXCL10, migration index reduced from 9.2 ± 0.83 to 2.2 ± 0.16, P < 0.001; Figure 2A), this blockade had no effect on IL-10 induction by CXCL11 or IFN-γ by CXCL10 (Figure 2B). These observations were in accordance with prior reports that PTX blocks CXCL12-induced migration (via CXCR4), but not JAK-STAT signaling for cytokine production (49).
Figure 2. CXCL10 and CXCL11 polarize Th1 and Tr1 cells in a GαI-independent manner.

(A and B) PTX inhibited CXCL10- and CXCL11-induced migration of anti-CD3–activated CD4+ T cells in Transwell chemotaxis chambers (A; P < 0.001), but not the ability of CXCL11 to elicit IL-10 or of CXCL10 to induce IFN-γ (B; P < 0.001 for both). (C) 2 × 10⁶ CD4+ T cells were activated with anti-CD3/anti-CD28. After 24 hours, cultures were supplemented with 20 ng/ml CXCL11 and/or 0–100 ng/ml CXCL10. IL-10 levels in supernatants were recorded by ELISA after 72 hours. CXL10 did not antagonize IL-10 production induced by CXCL11. Data (mean ± SEM of triplicates) are from 1 of 3 independent experiments with similar results. *P < 0.001.
Finally, we determined whether different concentrations of CXCL10 block the induction of IL-10hi Tr1 cells by CXCL11 in vitro. In 3 independent experiments, CXCL10 did not block CXCL11 (Figure 2C), due to different binding sites within the same receptor (40).
CXCL10 and CXCL11 induce differential STAT-dependent signaling cascades in CD4+ T cells.
We used 2 complementary approaches to delineate the STAT proteins that participate in CXCL10 and CXCL11 signaling cascades. 24 hours after anti-CD3/anti-CD28–induced activation of primary mouse T cells, cultures were supplemented with each of the above chemokines (20 μg/ml). At different time points, STAT protein phosphorylation was determined by 2 independent techniques: flow cytometry and Western blot analysis. Both showed that, whereas CXCL10 phosphorylated STAT1, STAT4, and STAT5, CXCL11 phosphorylated STAT3 and STAT6 (Figure 3, A and B). CXCL9 stimulation induced the same phosphorylation pattern of STAT proteins as CXCL10 (data not shown). Further exploration of the differential signaling cascades induced by CXCL10 and CXCL11 showed that CXCL11, but not CXCL10, induced phosphorylation of p70 S6K and the mTOR cascade (Figure 3C). To further validate these observations, we used commercial inhibitors of STAT1, STAT3, and STAT6. STAT6 and STAT3 inhibitors blocked the elicited production of IL-10 in the presence of CXCL11 (without inhibitors, increase from 165 ± 15 to 447 ± 35 pg/ml, P < 0.001; with STAT3 and STAT6 inhibitors, 149 ± 15 and 219 ± 22 pg/ml, respectively; both P < 0.001 vs. no inhibitor; Figure 4A). The STAT1 inhibitor, in contrast, had no effect on the elicited production of IL-10 in the presence of CXCL11 (Figure 1A). Reciprocally, STAT1 inhibitor, but not STAT6 or STAT3 inhibitors, blocked the induction of IFN-γ by CXCL10 (without inhibitors, increase from 565 ± 25 pg/ml to 945 ± 55 pg/ml, P < 0.01; with STAT1 inhibitor, decrease to 612 ± 12 and 219 ± 22 pg/ml, P < 0.01 vs. no inhibitor; Figure 4B).
Figure 3. CXCL10 and CXCL11 polarize Th1 and Tr1 by inducing diverse STAT-dependent pathways.

CD4+ T cells were isolated from LNs of naive mice (MACs MicroBeads) and activated with anti-CD3/anti-CD28; 24 hours later, cultures were supplemented with CXCL10 or CXCL11 (100 ng/ml, R&D). (A) After 1, 5, and 15 minutes, cells were subjected to flow cytometry for various STAT proteins. (B and C) After 0, 10, 30, and 60 minutes, cells were subjected to Western blot analysis comparing the phosphorylation level of various STAT proteins (B) or of other intracellular mediators, including Akt, p70S6K, and mTOR (C). Results shown in B and C are from the same experiment; separation was done only for didactical reasons.
Figure 4. CXCL10 and CXCL11 induce differential STAT-dependent signaling cascades in CD4+ T cells and differentially polarize CD4+ subsets.

(A and B) Inhibitors of STAT3 and STAT6 arrested CXCL11-induced IL-10 production, whereas blockade of STAT1 reduced CXCL10-induced IFN-γ. CD4+ T cells were isolated from LNs of naive mice (MACs MicroBeads), activated with anti-CD3/anti-CD28; 24 hours later, cultures were supplemented with CXCL11 (A) or CXCL10 (B) (100 ng/ml, R&D). 1 hour before, chemokines were added, and cultures were supplanted with STAT1, STAT3, or STAT6 inhibitors (see Methods) and incubated for an additional 48 hours. Supernatant was collected for ELISA analysis. (C and D) CXCL10 and CXCL11 differentially polarized CD4+ subsets. CD4+ T cells were isolated from LNs of naive mice (MACs MicroBeads) and activated with anti-CD3/anti-CD28; 24 hours later, cultures were supplemented with CXCL10 or CXCL11 (100 ng/ml, R&D systems). 48 hours later, cells were harvested and subjected to real-time PCR analysis for transcription of T-bet, GATA-3, and RORγT (C) and of IL-21, AhR, and c-Maf (D). Transcription levels were normalized to β2-microglobulin expression. Data (mean ± SEM of triplicates) are from 1 of 3 independent experiments with similar results. †P < 0.05, #P < 0.01, *P < 0.001.
CXCL11 not only induces IL-10 in CD4+ T cells, but also skews their polarization into Tr1-like cells, whereas CXCL10 polarizes Th1 and Th17.
To determine whether CXCL11 directs the polarization of Tr1 cells, or instead induces IL-10 in CD4+ T cells without skewing their polarization into Tr1-like cells, CD4+ T cells from naive mice were activated (by anti-CD3/anti-CD28) in the presence of CXCL10 or CXCL11, and real-time PCR analyses of various transcription factors, intracellular proteins, and receptors associated with the polarization of each subtype were performed in 3 independent experiments, which yielded similar observations. Addition of CXCL10 to cultured CD4+ T cells undergoing anti-CD3/anti-CD28–induced activation led to increased transcription of T-bet and RORγT and decreased transcription of GATA-3 (all P < 0.001; Figure 4C). This observation suggested that CXCL10 skews polarization of CD4+ T cells into Th1/Th17. In contrast, CXCL11 led to decreased transcription of RORγT (P < 0.05), but somehow not T-bet (Figure 4C), indicative of decreased polarization of Th17, as well as increased transcription of the aryl hydrocarbon receptor (AhR), c-Maf, LAG-3, and CD49b (all P < 0.001; Figure 4D), which have previously been associated with Tr1 polarization (51, 52). We did not record any significant change in the level of expression of IL-21. Taken together, these results suggest that whereas CXCL10 polarizes effector Th1 and Th17 cells, CXCL11 instead polarizes Tr1-like cells.
CXCL11-Ig suppresses EAE while selecting IL-10hi Tregs that transfer disease suppression.
First, we generated recombinant fusion proteins composed of murine CXCL11 or CXCL10 linked to the murine IgG1 heavy chain Fc (referred to herein as CXCL11-Ig and CXCL10-Ig, respectively; Supplemental Figure 1A) that would preserve the biological properties of each chemokine. This strategy is commonly used to stabilize and prolong the in vivo half-life of soluble proteins (53). Before exploring their ability to interfere in the regulation of ongoing EAE, we verified that: (a) each recombinant fusion chemokine preserved its initial target recognition pattern and the competence to attract CXCR3+ T cells in a Transwell bicameral system, and (b) this migration could be inhibited by chemokine-specific antibodies (Supplemental Figure 1B). We then determined whether CXCL11-Ig retained other biological activities of CXCL11, particularly the ability to induce IL-10 in CD4+ T cells undergoing activation. Both CXCL11 (R&D) and CXCL11-Ig similarly induced IL-10 (350 ± 30 pg/ml and 390 ± 40 pg/ml, compared with 39 ± 5 pg/ml, P < 0.001; Supplemental Figure 1C).
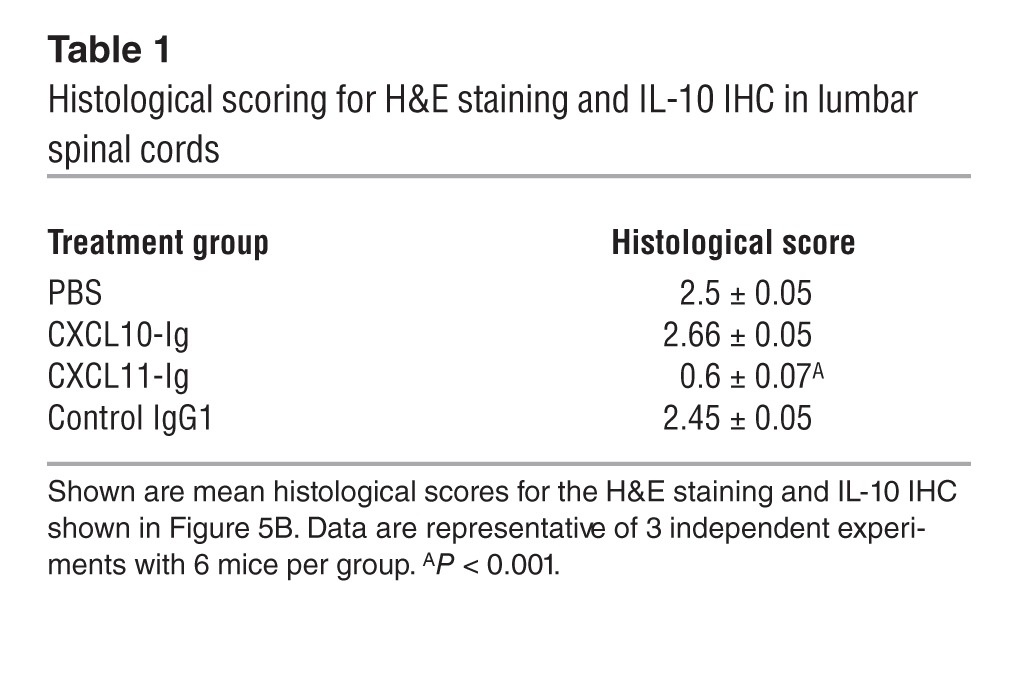
The ability of each fusion protein to affect the dynamics of ongoing EAE was then tested. SJL/J mice were subjected to active induction of EAE and separated at the onset of disease into 4 groups of 6 mice each that were treated every other day beginning at the time of disease onset with CXCL11-Ig, CXCL10-Ig, control IgG1 (100 μg/mouse i.p.), or PBS. Mice were followed for the progression of the first episode of EAE by an observer blinded to the experimental protocol. Whereas mice injected with CXCL11-Ig rapidly entered remission, control animals continued to develop severe disease that persisted for 12 days (first episode) (day 19 mean maximal EAE score, 3.66 ± 0.13 vs. 1 ± 0, P < 0.001; Figure 5A). Histological analysis of the lumbar spinal cord at day 19 confirmed these observations, demonstrating a marked reduction in the mean histopathologic score of mice treated with CXCL11-Ig (0.6 ± 0.07 vs. 2.5 ± 0.05, P < 0.001; Table 1). Immunohistochemistry (IHC) revealed a marked increase in IL-10–producing leukocytes within the CNS of mice treated with CXCL11-Ig (Figure 5B). We isolated these cells from the CNS of each group, and CD4+ T cells were subjected to flow cytometric analysis of IFN-γ vs. IL-4, IFN-γ vs. IL-17, and IL-10 vs. IL-4 (gated on CD3+CD4+). Administration of CXCL11-Ig skewed CD4+ T cell polarization from Th1 (1.7%, vs. 10.7% with IgG1 control) and Th17 (1.21%, vs. 2.46%) to IL-10hi Tr1-like (6.4%, vs. 1.25%) and IL-4hiIL-10lo Th2 (6.3%, vs. 0.17%) cells (Figure 5C). In contrast, CXCL10 skewed the CD4+ T cell subset toward a Th1 phenotype (15.8%, vs. 10.7% with IgG1 control) and, to a lesser extent, into a Th17 phenotype (2.74%, vs. 2.46% with IgG1; comprehensive analysis of all 3 independent experiments showed 3.19% ± 0.43% vs. 2.41% ± 0.33%, P < 0.05; Supplemental Figure 2). It should be noted, however, that at this stage of disease in EAE mice, the major effector CD4+ T cell response had already been shifted from Th17 to Th1 (9). Similar results were obtained from cervical LN cells and spleen cells. In both instances, administration of CXCL11-Ig led to the same shift from Th1 to Tr1-like cells (data not shown). Comprehensive analysis of all 3 independent experiments is shown in Supplemental Figure 2.
Figure 5. CXCL11-Ig suppresses ongoing EAE while selecting IL-10hi Tregs that transfer disease suppression.

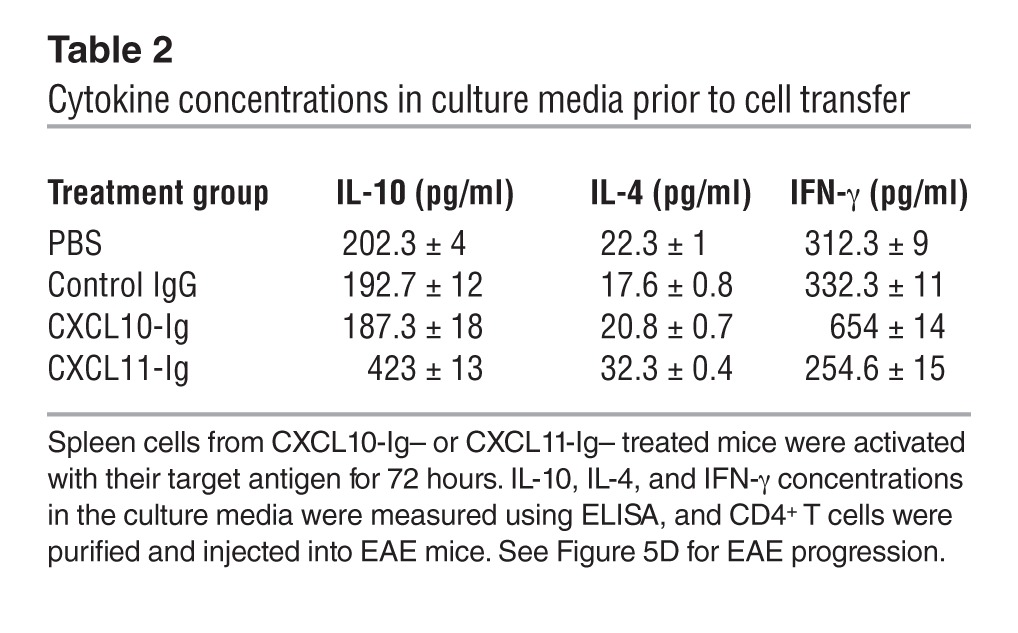
(A) CXCL11-Ig suppressed ongoing EAE. EAE was induced in SJL/J mice. At disease onset, mice were separated into 4 groups of 6 each and treated every other day with CXCL11-Ig, CXCL10-Ig, control IgG1 (100 μg/mouse i.p.), or PBS and followed for the progression of the first episode of EAE by an observer blinded to the experimental protocol. (B) Histological analyses and IL-10 IHC in lumbar spinal cords of representative mice at day 19 (disease peak). Original magnification, ×40 (naive); ×100 (all other H&E); ×400 (all other IHC). See Table 1 for histological scores. (C) Disease suppression was associated with skewing CD4+ T cell subsets into IL-10hi and IL-4hi phenotype. At the peak of disease, CD3+CD4+ T cells from the CNS of each group were subjected to flow cytometry analysis of IFN-γ, IL-4, IL-17, and IL-10. (D) CD4+ T cells from protected mice transferred disease suppression. Adoptive transfer of CD4+ T cells from EAE donors treated with CXCL11-Ig, CXCL10-Ig, control IgG, or PBS to recipient EAE mice was performed at onset of active disease. Prior to transfer, levels of key cytokines were determined (see Table 2), after in vitro activation with target antigen. Data (mean ± SEM of triplicates) are from 1 of 3 independent experiments with similar results. *P < 0.001.
Table 1.
Histological scoring for H&E staining and IL-10 IHC in lumbar spinal cords
To further elucidate whether suppression of EAE after CXCL11-Ig administration is associated with skewing of CD4+ T cell polarization toward Tr1 cells, we conducted a set of adoptive transfer experiments in which groups of donor SJL/J mice were subjected to active induction of EAE and, at the onset of disease, treated as described above (see Figure 5A). After the second administration of either CXCL11-Ig or CXCL10-Ig, spleen cells were isolated and cocultured in the presence of their target antigen for 3 days, then purified (CD4+ purification; MACs MicroBeads) and transferred to recipient SJL/J mice (20 × 106 cells/mouse) at the onset of their active disease. Before cell transfer, production levels of key cytokines demonstrated a significant skewing toward IL-10 production in cultured cells from CXCL11-Ig–treated mice (423 ± 13 vs. 202 ± 4 pg/ml, P < 0.001; Table 2). These recipient mice (6 per group) were followed for the progression of the first episode of EAE by an observer blinded to the experimental protocol; 3 independent experiments were performed, yielding similar observations. Administration of CD4+ T cells from mice treated with CXCL11-Ig, but not from control EAE mice, led to rapid suppression of disease (day 13 mean maximal EAE score, 1.3 ± 0.2 vs. 3.0 ± 0.2, P < 0.001; Figure 5D).
Table 2.
Cytokine concentrations in culture media prior to cell transfer
CXCL11 redirects the polarization of effector T cells into IL-10hi Tr1 cells and suppresses EAE in an IL-10–dependent manner.
Would CXCL11 redirect the polarization of effector T cells into IL-10hi Tr1 cells? Primary CD4+ T cells were obtained from pre-EAE mice (day 9) and cocultured with their target antigen in the presence or absence of CXCL11 or CXCL10 (R&D), added 24 hours later. CXCL11 skewed CD4+ T cell polarization into IL-10hi Tr1-like cells (from 1.74% to 14.2%) and to IL-4hiIL-10lo Th2 cells (from 0.58% to 5.49%) (Figure 6A). Notably, the level of IL-4hiIL-10hi cells also increased, from 0.46% to 2.92%. Comprehensive analysis of all 3 independent experiments is presented in Supplemental Figure 2.
Figure 6. CXCL11 redirects the polarization of effector T cells into IL-10hi Tr1 cells and provides long-lasting EAE resistance.

(A) CD4+ T cells from pre-EAE mice (day 9) were activated with target antigen and 20 ng/ml CXCL11 or CXCL10 (R&D; added 24 hours later). 48 hours later, CD4+ T cells were separated (MACs MicroBeads) and analyzed for IL-4 and IL-10 production. (B) 20 × 106 of these cells were transferred to SJL/J EAE mice at disease onset. (C) Recipient mice (6 per group) administered CD4+ T cells from CXCL11-Ig–treated donors were repeatedly injected with anti–IL-4 or anti–IL-10 neutralizing mAbs (PeproTec; 100 μg/mouse) or PBS. (D) SJL/J EAE mice were administered anti–IL-10, isotype-matched IgG, or PBS on day 9. (E) Donor C57BL/6 WT or Il10–/– mice were immunized with MOG35–55/CFA to induce EAE. On days 3, 5, 7, and 9, mice were treated with CXCL11-Ig (100 μg/mouse) or PBS. On day 11, CD4+ T cells were isolated and 20 × 106 were transferred to WT EAE mice (6 per group). (F) EAE was induced in SJL/J mice. At disease onset, mice were separated into 3 groups (10 per group); treated every other day with CXCL11-Ig, CXCL10-Ig, or isotype-matched IgG (100 μg/mouse); and followed for progression of the first EAE episode and development of a second episode. Data (mean ± SEM) are from 1 of 3 (B, C, and F) or 2 (D and E) independent experiments with similar results. †P < 0.05, #P < 0.01, *P < 0.001.
We then determined whether these cells would suppress EAE in adoptive transfer experiments, and whether targeting IL-10 or IL-4 would reverse this suppression. In adoptive transfer experiments, these cells were transferred to SJL/J mice at the onset of their active disease (20 × 106 cells/mouse). Disease was rapidly suppressed with administration of CD4+ T cells that were activated in the presence of CXCL11 (day 13 mean EAE score, 2.83 ± 0.18 vs. 1.33 ± 0.23, P < 0.01), but not CXCL10 or PBS (Figure 6B). In a subsequent experiment conducted under the same protocol, mice receiving CD4+ T cells from CXCL11-Ig–treated donors were repeatedly injected with neutralizing mAbs against IL-4 or IL-10 (PeproTec; 100 μg/mouse) or vehicle control and followed for disease development and progression. Whereas neutralization of IL-4 did not reverse disease suppression, targeting IL-10 partially reversed this effect: mice treated with CXCL11-Ig plus anti–IL-10 displayed a significantly increased form of disease compared with mice treated with CXCL11-Ig alone (day 13 mean EAE score, 2.83 ± 0.18 vs. 1.33 ± 0.23, P < 0.01; Figure 6C). Moreover, IL-10 neutralization could not fully reverse the therapeutic effect of CXCL11-Ig (day 13 mean EAE score, 2.83 ± 0.18 vs. 3.66 ± 0.23, P < 0.05; Figure 6C). Thus, we cannot yet exclude the possibility that IL-10–independent mechanisms contribute to the suppressive effect of these Tr1-like cells.
Next, SJL/J mice developing EAE were administered anti–IL-10 mAbs (according the protocol of Figure 6C) or isotype-matched IgG or PBS beginning on day 9 and followed for the dynamics of disease; 2 independent experiments were performed, yielding similar observations. Targeting IL-10 significantly enhanced the severity of disease (day 14, P < 0.05; day 17, P < 0.01; Figure 6D) as well as its duration. This finding implies an important role of endogenous IL-10 in the regulation of disease. It is therefore likely that part of the disease reversal shown in Figure 6C is due to this neutralization. In order to focus on the direct effect of CXCL11-Ig therapy on the activity of IL-10–producing T cells and its therapeutic relevance, we applied an adoptive transfer setup in which donor WT C57BL/6 mice and reciprocal donor IL-10 knockout mice (Il10–/–) were immunized with myelin oligodendrocyte glycoprotein epitope 35–55 (MOG35–55) in CFA to induce EAE. On days 3, 5, 7, and 9, these mice were treated with CXCL11-Ig (100 μg/mouse) or a control solution. On day 11, donor mice were sacrificed, and CD4+ T cells were separated (MACs MicroBeads) and transferred to reciprocal WT mice (20 × 106 cells/mouse) with established, ongoing disease (day 11). Mice were monitored daily for clinical score; 2 independent experiments were performed, yielding similar results. Adoptive transfer of CD4+ T cells from WT mice treated with CXCL11-Ig, but not from reciprocal Il10–/– mice, significantly suppressed disease (day 23 mean maximum EAE score, WT, 3.5 ± 0.66; CXCL11-Ig–treated Il10–/– donor T cells, 3.3 ± 0.5, CXCL11-Ig–treated WT donor T cells, 1.1 ± 0.16, P < 0.01; Figure 6E).
Administration of CXCL11-Ig during the first episode of EAE prevents subsequent disease relapse.
SJL/J mice were subjected to active induction of EAE. At disease onset, animals were separated into 3 groups of 10 mice each that were treated every other day beginning at disease onset with CXCL11-Ig, CXCL10-Ig, or isotype-matched control IgG (100 μg/mouse). Mice were followed by an observer blinded to the experimental protocol for the progression of the first episode of EAE and for the development of a second episode; 3 independent experiments were performed, yielding similar observations. Administration of CXCL11-Ig at the onset of the first episode of illness suppressed the development of disease during this episode (day 13 mean maximal EAE score, 1 ± 0 vs. 2.8 ± 0.2, P < 0001; Figure 6F) and entirely prevented a subsequent relapse compared with control animals (0 of 10 vs. 4 of 10, P < 0.0001). In 3 independent experiments, relapse incidence was 0 of 40 in CXCL11-Ig–treated mice, compared with 12 of 40 in control mice (P < 0.0001).
CXCL11-Ig based therapy affects recruitment of CD4+ T cells to the CNS and the cervical LN, but not the spleen, of EAE mice.
Donor GFP-actin reporter mice were subjected to active induction of EAE (MOG35–55 in CFA). On day 9, draining LNs were harvested, and T cells were purified (CD3+; MACs MicroBeads) and directly transferred (20 × 106 cells/mouse) to recipient WT mice at the onset of disease (day 11). Mice were treated on days 11 and 13 with CXCL11-Ig (100 μg/mouse), PBS, or isotype-matched IgG. On day 14, recipient mice were sacrificed, and cervical LNs, spinal cord, and spleen cells were analyzed for relative accumulation of donor CD4+ T cells. As demonstrated by representative results from a single mouse, therapy reduced the relative accumulation of CD4+ T cells in the cervical LNs that drain the CNS and in the spinal cord, but not in the spleen (spinal cord, 3.3% vs. 6.49%; cervical LN, 3.01% vs. 9.74%; spleen, 2.2% vs. 2.56%; Figure 7A). Comprehensive analysis of all mice is shown in Supplemental Figure 2.
Figure 7. Effects of CXCL11 therapy on CD4+ T cell recruitment and EAE suppression.

(A) CXCL11-Ig–based therapy affected recruitment of CD4+ T cells to the CNS and cervical LN, but not the spleen, of EAE mice. CD3+ T cells from donor GFP–β-actin reporter EAE mice were purified (MACs MicroBeads) and directly transferred to recipient WT mice (20 × 106 cells/mouse) at disease onset (day 11). These mice were then treated (days 11 and 13) with CXCL11-Ig (100 μg/mouse), PBS, or isotype-matched IgG. On day 14, recipient mice were sacrificed, and cervical LN, spinal cord (SC), and spleen cells were analyzed for relative donor CD4+ T cell accumulation. Shown are data from a single representative mouse (see Supplemental Figure 2 for comprehensive analysis of all mice). (B) Low-dose administration of CXCL11 preferentially suppressed EAE in C57BL/6 mice. At disease onset, C57BL/6 and SJL/J mice were subjected on alternating days to low-dose administration of 4 or 40 μg/kg BW of CXCL11 (R&D) (∼0.08 and ∼0.8 μg/mouse, respectively) and followed for disease development and progression. Data (mean ± SEM) are from 1 of 3 independent experiments with similar results. *P < 0.001.
It is possible that part of the success of CXCL11-Ig therapy is due to its affect on T cell recruitment at the autoimmune site and the LNs that drain this site. This does not invalidate our observation that CXCL11-Ig polarized IL-10–producing Tregs, but suggests an additional mechanism that might also participate in CXCL11-Ig–based therapy.
Mice lacking CXCL11 display higher sensitivity to CXCL11 therapy.
WT C57BL/6 mice display a shift in the open reading frame of the gene encoding CXCL11 (insertion of 2 bases after nucleotide 39), resulting in the translation of a chimeric protein lacking the critical CXC motif (45). After confirming this observation (data not shown), we thought it would be interesting to determine whether, in the absence of natural CXCL11, these mice would display higher sensitivity to CXCL11 administration during EAE compared with SJL/J mice, which are CXCL11+. Thus, at disease onset, C57BL/6 and SJL/J mice were subjected to low-dose administration of 4 or 40 μg/kg BW CXCL11 (R&D; ∼0.08 and ∼0.8 μg/mouse, respectively) every other day, and disease development and progression was followed; 3 independent experiments were performed, yielding similar results. Administration of 40 μg/kg BW CXCL11 markedly suppressed the disease in C57BL/6 mice (day 19 mean maximal EAE score, 1.36 ± 0.166 vs. 3.66 ± 0.3, P < 0.001), whereas it did not have any notable effect on the manifestation of disease in SJL/J mice (Figure 7B).
Discussion
The Lefkowitz group has previously raised the notion that different ligands binding the same GPCR may induce diverse signaling cascades, resulting in distinct biological activities (20, 54, 55). Even though the mechanistic basis of this feature is not fully understood, its biological and clinical implications are highly significant (20). Our present study explored, for the first time, the biological consequences of these findings in chemokine regulation of inflammatory autoimmunity (30, 32).
Remarkably, despite the redundancy in the chemotactic properties of CXCR3-binding chemokines, the neutralization of a single key chemokine, such as CCL2, CCL3, CCL5, or CXCL10, rapidly suppresses chronic inflammatory processes such as autoimmune disease (42, 43, 56, 57). In our view, a partial explanation of this paradox is that in addition to their migratory properties, some key chemokines contribute to other biological activities. For example, CXCL10 not only attracts CXCR3+ effector T cells to inflammatory sites, but also polarizes CXCR3+ nonpolarized CD4+ T cells into effector Th1/Th17 cells; thus, its targeted neutralization during inflammatory autoimmunity suppresses disease (42, 43). Another example is the mobilization of CCR2+ macrophages from the bone marrow to inflammatory sites via CCL2 (58), which may explain why targeting this axis suppresses autoimmunity (30, 32, 56). Paradoxically, even though CXCL10 polarizes CD4+ T cells into effector Th1 subsets and recruits these T cells to inflammatory sites via CXCR3, mice lacking this receptor tend to develop more severe forms of autoimmunity (59, 60). Our present study informed these issues by demonstrating that 1 of the 3 CXCR3 ligands displayed antiinflammatory properties, and its administration during ongoing EAE therefore suppressed the disease. 2 different mechanisms are likely to promote this property of CXCL11. The first includes receptor internalization, a well-established mechanism by which different chemokines regulate each other’s biological activity. That is, once a given chemokine binds its cognate receptor with high affinity, it often leads to the internalization or the desensitization of the receptor, making it inaccessible to other cognate ligands. CXCL11 binds CXCR3 with a much higher affinity than the other 2 CXCR3 ligands, CXCL10 and CXCL9 (41), both of which promote effector T cell polarization to enhance inflammation (42, 43). Here, we provide conclusive evidence that CXCL11 drives its own unique signaling cascades critical for FOXP3– Treg expansion. Whereas CXCL10 (and possibly CXCL9) drives Th1/Th17 polarization by signaling via STAT4 (and perhaps STAT5), CXCL11 not only competes with these proinflammatory activities, but can directly activate, via STAT3, mTOR, and STAT6 pathways, leading to enhanced polarization of FOXP3–IL-10hi– and IL-4hi–producing Tregs. This may explain, at least in part, why NOD mice lacking CXCR3 display more severe type I diabetes (60). It still remains ambiguous why CXCR3-deficient C57BL/6 mice, despite lacking functional CXCL11, display more severe EAE than WT animals (59).
Our findings of increased transcription of GATA-3 and c-Maf together with AhR, as well as LAG-3 and CD49b, represent key indicators that CXCL11 drives Th2/Tr1 polarization, rather then merely being involved in increasing IL-4 and IL-10 in CD4+ T cells (51, 52, 61). This may also explain the ability of CD4+ T cells selected in the presence of CXCL11 to transfer EAE resistance and provide long-term disease suppression in a relapsing form of disease (Figure 4, E and F).
CXCL10-Ig also elicited IFN-γ in CD4+ T cells, similar to CXCL10 (Supplemental Figure 1D). Nevertheless, administration of CXCL10-Ig did not result in enhanced induction of IFN-γ (Figure 5C). Why so? We believe that under our working conditions, administration of exogenous CXCL10-Ig cannot override endogenous CXCL10. We have previously shown that targeting CXCL10 in vivo blocks Th1 and skews the polarization into Th2, thus suppressing ongoing EAE (42), as well as adjuvant-induced arthritis (43). This implies a key role of this chemokine in driving IFN-γhi–producing CD4+ T cells. CXCL11 is likely to be more potent due to its relatively higher binding affinity to CXCR3 (40, 41).
It thus appears that different ligands binding the same GPCR induce different biological activities (20, 54), and, conversely, that a single GPCR ligand may induce different signaling cascades via its receptor, by mechanisms that are currently under investigation (62, 63). As for chemokines, Vila-Coro et al. previously showed that CXCL12-induced chemotaxis via CXCR4 is independent of its ability to induce cytokine production via the same receptor, which is directed by JAK-STAT phosphorylation (49). Similar to this, CXCL11 and CXCL10 also induced STAT-dependent signaling for cytokines via CXCR3, independent of their ability to induce chemotaxis via the same receptor (Figure 2).
CXCL11 binds 2 alternative receptors, CXCR3 (40) and CXCR7 (46). Moreover, CXCL12, the only known chemokine that also induces IL-10 production by CD4+ T cells (36), also binds CXCR7 (as well as CXCR4) (46). It is possible that CXCR7 is involved in the polarization of Tr1 cells by each of these chemokines. Our results showed that neutralizing mAbs against CXCR7 could not block CXCL11-induced polarization of CD4+ T cells into Tr1 (Figure 1F). Nevertheless, this observation does not exclude the possibility that the CXCL11 and CXCL12 signaling cascades include internalization of each chemokine via CXCR3 and CXCR4, respectively. Under such a scenario, each chemokine could bind intracellular CXCR7, as part of a signaling cascade resulting in IL-10 induction in these CXCR7+ target cells. To further explore this possibility, we used shRNA technology to markedly reduce CXCR7 transcription in these cells. Even under these conditions, CXCL11 clearly induced IL-10 production in CD4+ T cells, comparable to its effect in control CXCR7+ cells (Supplemental Figure 3). Taken together, our results strongly suggest that CXCL11 induces Tr1 cells via binding to CXCR3 and that this induction is CXCR7 independent.
CXCL11-Ig effectively suppressed macrophage-associated inflammatory cytokines that are well associated with the polarization of Th1 (IL-12) and Th17 (IL-23), resulting in reduced polarization of Th1 and Th17 in CXCL11-Ig–treated mice; this may explain, at least in part, the long-lasting protective effect of CXCL11-Ig that could be transferred by these cells. However, under our experimental conditions, addition of CXCL11 to peritoneal macrophages undergoing LPS-induced activation did not suppress IL-12/IL-23 production by these cells (data not shown). Thus, the main suppressor function of CXCL11 is likely the expansion of IL-10–producing Tregs, which in turn suppresses the expansion and effector functions of Th1 and Th17 (as recently demonstrated by Chaudhry et al.; ref. 64), rather than directly competing with CXCL10-driven Th1 and Th17 expansion. Moreover, our results in vitro (Figure 2C) suggest that CXCL10, at different doses, cannot inhibit CXCL11-induced IL-10 production by T cells, probably due to different binding sites of these ligands within the same receptor (CXCR3) (40).
What, then, are the advantages and disadvantages of CXCL11-Ig–based therapy over targeting inflammatory process by neutralizing inflammatory cytokines/chemokines or anti–adhesion molecule–based therapy? Rather than inhibiting inflammatory autoimmune disease, via directly neutralizing key inflammatory cytokines/chemokines or their target receptors and/or by inhibiting migration of inflammatory cells to their target organs, we propose to exploit the natural ability of CXCL11 to induce Treg production and function, using recombinant CXCL11-Ig as a powerful peripheral inducer of functional Tregs. Induction of these Tregs during ongoing EAE appeared to provide a longer state of disease suppression, including preventing upcoming relapse in remitting disease. Our results provide the first example of a delicate balance between distinct ligands for a shared GPCR, which determines the fate of T cell differentiation in the context of an autoimmune disease.
Adoptive transfer experiments of labeled T cells showed that CXCL11-Ig–based therapy also reduced T cell migration to the autoimmune site and the LNs that drain this site. It is thus possible that in addition to skewing T cell polarization into Tr1 cells, the alteration in T cell migration may also contribute to the therapeutic effect of CXCL11. Hence, it should be noted that all our attempts to treat ongoing EAE in Il10–/– mice totally failed (G. Wildbaum and N. Karin, unpublished observations), which nevertheless implies a pivotal role of this cytokine in CXCL11-Ig–based therapy.
A potential advantage of the fusion protein is that it is likely to have a longer in vivo half-life while maintaining the basic features of the recombinant protein (Supplemental Figure 1). It is likely that administration of low doses of the recombinant CXCL11 (R&D) would not be effective in SJL/J mice, as it would be masked by the natural endogenous chemokine. However, WT C57BL/6 mice lack this endogenous chemokine, which may explain why low-dose CXCL11 was so effective in these mice (Figure 7B).
Finally, in preliminary experiments, we observed that administration of CXCL11-Ig to SJL/J mice during ongoing EAE was highly effective at a dose of 100 μg/mouse (Figure 5A). At doses below 50 μg/mouse, it was not effective at all (data not shown). According to this calculation, an effective clinical dose is anticipated to be 5 mg/kg BW. The observed heightened sensitivity of C57BL/6 mice is likely secondary to the absence of endogenous CXCL11; therefore, the SJL/J model is probably a more relevant model for human therapies that are based on CXCL11-Ig. Whether these findings with CXCR3 and its distinct ligands can be extended to other different autoimmune diseases, as well as to other chronic inflammatory processes, remains to be investigated.
Methods
Animals.
6-week-old female SJL/J mice, as well as C57BL/6 WT mice, were purchased from Harlan and maintained under specific pathogen–free conditions in our animal facility. IL-10 GFP mice had been previously developed to sensitively track IL-10 production in vivo and in vitro (65). C57BL/6 Il10–/– mice and C57BL/6 GFP actin-β reporter mice were purchased from JAX lab.
Peptide antigens.
Proteolipid protein epitope 139–151 (PLP139–151) and MOG35–55 were synthesized by the PAN facility of the Beckman Center of Stanford University. After purification by HPLC, the sequence was confirmed by amino acid analysis, and the correct mass was checked by mass spectroscopy. Purification of the peptides used in the current study was >95%.
Recombinant proteins and antibodies.
Recombinant CXCL9, CXCL10, and CXCL11 were purchased from R&D Systems. Neutralizing mAbs against murine IL-10 and anti–IL-4 were purchased from R&D Systems.
EAE induction.
Active EAE was induced in SJL/J mice by injection of PLP139–151 in CFA (66) and in C57BL/6 mice by injection of MOG35–55 in CFA. Animals were then monitored daily for clinical signs by an observer blinded to the treatment protocol. EAE was scored as follows: 0, clinically normal; 1, flaccid tail; 2, hind limb paralysis; 3, total hind limb paralysis, accompanied by apparent front limb paralysis; 4, total hind limb and front limb paralysis; 5, death.
Adoptive transfer and cell separation.
Mice were subjected to active EAE induction. On day 9, draining LN cells (DLNCs) or spleen cells were isolated and cocultured with their target antigen (for C57BL/6 MOG35–55, 50 μg/ml) for 72 hours. Next, CD4+ T cells or total CD3+ cells were isolated using MACs MicroBeads separation reagents (Miltenyi Biotec; for CD4+ T cells, CD4+; for pan CD3+ T cells, CD3+ separation kit; catalog no. 130-094-973). The purity of the different isolated cell populations was determined by flow cytometry and was >95%. In experiments in which adoptive transfer was conducted without in vitro culturing, cell separation was applied immediately after cell harvesting (20 × 106 cells/mouse).
Preparation of cell lysates and Western blotting.
T cells treated for the indicated times were quickly placed on ice and washed with ice-cold PBS. Cells were lysed in RIPA buffer (PBS containing 1% Nonidet P-40, 0.1% SDS, 1 mM Na3VO4, 1 mM PMSF, 0.05% [w/v] aprotinin). Insoluble proteins were discarded by high-speed centrifugation at 4°C. Protein concentration in the supernatant was measured in triplicate by Nanodrop. Equal amounts of total cellular proteins were separated by SDS-PAGE and blotted to nitrocellulose membrane. Antibodies recognizing p70K, mTOR, Akt, and phospho-AktSer473 (Cell Signaling Technology) were used in combination with a goat anti-rabbit HRP-conjugated secondary antibody (Jackson Immunoresearch Laboratories). Immunoblot analysis of total and phosphorylated STAT1, STAT3, STAT4, STAT5, and STAT6 was conducted after immunoprecipitation. Briefly, 150 μg of total cellular proteins were incubated with anti-STAT antibodies and protein A–sepharose for 2 hours at 4°C. Immunobeads were washed twice in lysis buffer and once in 20 mM Tris-HCl (pH 7.4) with 1 mM Na3VO4, resuspended, and analyzed by Western blot as described above.
Phospho-epitope staining for flow cytometry.
T cells were activated using anti-CD3/anti-CD28. 24 hours later, CXCL10 and CXCL11 (10 ng/ml) was added for 0, 1, 5, and 15 minutes. Cells were then fixed, permeabilized using PFA and methanol as previously described (67), and stained for STAT1 (Alexa Fluor 647–conjugated mouse anti-STAT1, catalog no. 612597), STAT3 (Alexa Fluor 647–conjugated mouse anti-STAT3, catalog no. 557815), STAT4 (Alexa Fluor 647–conjugated mouse anti-STAT4, catalog no. 558137; P-STAT Rabbit mAb, catalog no. 082012), STAT5 (Alexa Fluor 488–conjugated mouse anti-STAT5, catalog no. 612598), and STAT6 (Alexa Fluor 647–conjugated mouse anti-STAT6, catalog no. 558242). Cells were also stimulated for 20 minutes with the appropriate cytokines as positive controls: for STAT1 phosphorylation, IFN-γ (1,000 U/ml); for STAT3 phosphorylation, IL-6 (100 ng/ml); for STAT4 phosphorylation, IFN-γ (1,000 U/ml); for STAT5 phosphorylation, GM-CSF (25 ng/ml); for STAT6 phosphorylation, IL-4 (100 ng/ml).
Inhibition of STAT phosphorylation.
Naive CD4 T cells were stimulated with anti-CD3/anti-CD28. After 24 hours of stimulation, 20 μM STAT3 inhibitor (CP 690550; Santa Cruz, catalog no. sc-202818), 30 μM STAT6 inhibitor (static; Santa Cruz, catalog no. sc-207457), and 40 μM STAT1 inhibitor (fludarabine; Santa Cruz, catalog no. sc-204755) were added, 1 hour before addition of the chemokines CXCL10 and CXCL11 (R&D; 20 ng/ml). Cells were incubated for an additional 48 hours, and supernatant was collected for ELISA.
RNA extraction and real-time PCR.
RNA was extracted using TriReagent (Sigma-Aldrich), according to the manufacturer’s instructions, and reverse transcribed with Moloney murine leukemia virus RT (Promega) using random primers (Amersham Biosciences). Quantitative PCR was performed with Absolute Blue SYBR-Green ROX Mix (Thermo Scientific, ABgene) according to the manufacturer’s instructions, with the Rotor-GeneTM 6000 system (Corbett Research) and its software, version 1.7. Transcript amounts were normalized to that of β2-microglobulin. Melting curves were determined to ensure the amplification of a single product. Primers used for this reaction were as follows: β2-microglobulin, 5′-TTCTGGTGCTTGTCTCACTGA-3′ and 5′-CAGTATGTTCGGCTTCCCATTC-3′; IL-21, 5′-GGACCCTTGTCTGTCTGGTAG-3′ and 5′-TGTGGAGCTGATAGAAGTTCAGG-3′; AhR, 5′-GGTGCCTGCTGGATAATTCATCTG-3′ and 5′-CGTCCTTCTTCATCCGTCAGTG-3′; c-Maf, 5′-AGCAGTTGGTGACCATGTCG-3′ and 5′-TGGAGATCTCCTGCTTGAGG-3′; CD49b, 5′-GTCTGGCGTATAATGTTGGC-3′ and 5′-CTTGTGGGTTCGTAAGCTGCT-3′; LAG-3, 5′-CTGGGACTGCTTTGGGAAG-3′ and 5′-GGTTGATGTTGCCAGATAACCC-3′; GATA-3, 5′-GAAGGCATCCAGACCCGAAAC-3′ and 5′-ACCCATGGCGGTGACCATGC-3′; RORγT, 5′-ACCTCTTTTCACGGGAGGA-3′ and 5′-TCCCACATCTCCCACATTG-3′; T-bet, 5′-CGGAGCGGACCAACAGCATCGTTTC-3′ and 5′-CAGGGTAGCCATCCACGGGCGGGT-3′.
Construction of CXCL11-Ig and CXCL10-Ig.
cDNA encoding the constant region (Hinge-CH2-CH3) of mouse IgG1 Fc was generated by RT-PCR on RNA extracted from mouse spleen cells that were cultured for 4 days with LPS and IL-4. Primers used for this reaction were 5′-CTCGAGGTGCCCAGGGATTGTGGTTG-3′ and 5′-GGGCCCTTTACCAGGAGAGTGGGAGA-3′. PCR products were digested with XhoI and ApaI and ligated into mammalian expression/secretion vector pSecTag2/Hygro B (Invitrogen). The following sets of primers were used to generate cDNA encoding mouse CXCL11-Ig and CXCL10-Ig from RNA extracted from mouse splenocytes: CXCL11-Ig, 5′-GCTAGCATGAACAGGAAGGTCACAGCCATAGC-3′ (sense) and 5′-CTCGAGCATGTTTTGACGCCTTAAAAAATT-3′ (antisense); CXCL10-Ig, 5′-GCTAGCATGAACCCAAGTGCTGCCGTCATTTT-3′ (sense) and 5′-CTCGAGAGGAGCCCTTTTAGACCTTTTTTG-3′ (antisense). PCR products were digested with NheI and XhoI and subcloned into the vector containing the mouse IgG1 fragment. Since alterations in the amino acid sequence at the N terminus of chemokines might change their properties, NheI was selected for the cloning procedure, and the original murine κ chain leader sequence found in pSecTag2/Hygro B was accordingly replaced by mouse CXCL11 or CXCL10 leader sequence. The fused fragments were sequenced by dideoxynucleotide sequencing in our facility (Sequins version 2; Upstate Biotechnology).
Expression and purification of CXCL11-Ig and CXCL10-Ig fusion proteins.
Expression and purification of CXCL11-Ig and CXCL10-Ig fusion proteins was carried out using CHO dhfr–/– (DG44) cells (provided by L. Chasin, Columbia University, New York, New York, USA) as previously described (68). Fusion proteins were expressed as a disulphide-linked homodimer similar to IgG1 and had a molecular weight of ∼72 kDa, consisting of 2 identical 36-kDa subunits. The fusion proteins were purified from the culture medium by High-Trap protein G affinity column (GE Healthcare).
Cytokine determination in cultured primary cells.
Spleen or LN cells were cultured under humidified 7.5% CO2 atmosphere at 37°C and stimulated with 50 μg/ml MOG35–55 peptide. 10 × 106 cells were cultured in 24-well plates in the presence of 100 ng/ml chemokine or PBS for 72 hours. Supernatants were collected, and cytokine levels were measured using standard ELISA. mIL-2, mIL-4, mIL-10, mIL-12, mIL-17, mTNF-α, mIFN-γ, and hIL-10 ELISA kits were purchased from BioLegend. mIL-23 ELISA kit was purchased from eBioscience. mTGF-β ELISA kit was purchased from BD Biosciences.
Migration assay.
106 MOG-specific effector CD4+ cells (∼90% Th1) were loaded in the upper chamber of a 6.5-mm diameter, 5-μm-pore polycarbonate Transwell culture insert (Costar). The lower chamber contained 10 ng/ml recombinant chemokine (R&D Systems) or 100 ng/ml CXCL11-Ig or CXCL10-Ig fusion protein. Incubation of cells was carried out at 37°C in 7.5% CO2 for 2 hours. Migrated cells were collected and counted using a FACS Calibur (BD Biosciences).
PTX inhibition of GαI-dependent activities.
CD4+ cells were isolated from naive mice and subjected to anti-CD3/anti-CD28 activation for 24 hours. Cells were then treated with PTX (10 × 106 cells/ml) for 16 hours, followed by addition of either CXCL10 or CXCL11 (10 nM). Cells were incubated for 48 hours at 37°C in a 7% CO2 atmosphere, and supernatants were collected for ELISA.
Flow cytometry analysis.
Flow cytometry analysis was conducted according to a protocol previously described in detail (69). For intracellular staining of cytokines, all conjugated antibodies were purchased from BioLegend.
shRNA-mediated knockdown of CXCR7.
CXCR7 knockdown was performed with lentiviral shRNA (MISSION; Sigma-Aldrich). The lentiviral particles were produced by calcium chloride–mediated transfection of HEK-293T cells. Transfected cells were cultured for 48 hours at 37°C in a humidified incubator, and the virus-rich supernatant was collected and filtered with a 0.45-mm diameter pore filter and used immediately for transduction. For CD4+ T cell transduction, freshly purified CD4+ T cells were isolated and incubated in 24-well plates coated with polybrene (10 μg/ml; American Bioanalytical) and anti-CD3/anti-CD28 antibodies under skewing conditions for 8 hours. Medium was then replaced with fresh skewing medium with or without CXCL11 for the next 48 hours. The following shRNA sequences were used: CCGGCCCTCTCCTTCATCTACATTTCTCGAGAAATGTAGATGAAGGAGAGGGTTTTT, CCGGCCCACTGTCTACTCAGGAAATCTCGAGATTTCCTGAGTAGACAGTGGGTTTTT, CCGGCTTCACTATCATTGCGATCTTCTCGAGAAGATCGCAATGATAGTGAAGTTTTT, CCGGGCCTGGCAACTACTCTGACATCTCGAGATGTCAGAGTAGTTGCCAGGCTTTTT, CCGGGCAAGATCACACACCTCATTTCTCGAGAAATGAGGTGTGTGATCTTGCTTTTT (Sigma-Aldrich; NM_007722.2-249s1c1, SHCLNV-NM_007722).
Histopathology.
The lumbar spinal cord was dissected, fixed in 4% paraformaldehyde, dehydrated, and embedded in paraffin. 5-μm sections were stained with H&E. Each section was evaluated for tissue damage and mononuclear infiltration using the following scale: 0, no mononuclear cell infiltration; 1, 1–5 perivascular lesions per section, with minimal parenchymal infiltration; 2, 5–10 perivascular lesions per section, with parenchymal infiltration; 3, >10 perivascular lesions per section, with extensive parenchymal infiltration. Mean histological score ± SEM was calculated for each treatment group.
IHC.
Lumbar spinal cord were dissected, fixed in 4% paraformaldehyde, dehydrated, and embedded in paraffin. 5-μm sections were mounted on Superfrost slides and blocked using normal donkey serum (Jackson ImmunoResearch Laboratories). Slides were then subjected to IHC using goat anti–IL-10 antibody (R&D Systems). Donkey anti-goat biotinylated antibody (Jackson ImmunoResearch Laboratories) was used as a secondary antibody, followed by streptavidin-conjugated peroxidase (Zymed Labratories Inc.). DAB (Zymed Labratories Inc.) was then used as a substrate.
Statistics.
Significance of differences was examined using 2-tailed Student’s t test. A P value less than 0.05 was considered statistically significant.
Study approval.
All animal studies were conducted according the NIH guideline and were reviewed and approved by the Technion Israel Institute of Technology Committee for the Supervision of Animal Experiments.
Supplementary Material
Acknowledgments
This study was supported by the Israel Science Foundation (ISF) and by the Technion VPR fund for medical research.
Footnotes
Conflict of interest: The authors have declared that no conflict of interest exists.
Citation for this article:J Clin Invest. 2014;124(5):2009–2022. doi:10.1172/JCI71951.
Christopher L. Karp’s present address is: The Bill & Melinda Gates Foundation, Seattle, Washington, USA.
References
- 1.Miller SD, Karpus WJ, Davidson TS. Experimental autoimmune encephalomyelitis in the mouse. Curr Protoc Immunol. 2010;Chapter 15:Unit 15.1. doi: 10.1002/0471142735.im1501s88. [DOI] [PubMed] [Google Scholar]
- 2.Steinman L. Multiple sclerosis: a two-stage disease. Nat Immunol. 2001;2(9):762–764. doi: 10.1038/ni0901-762. [DOI] [PubMed] [Google Scholar]
- 3.Wekerle H, Kojima K, Lannes-Vieira J, Lassmann H, Linington C. Animal models for multiple sclerosis. Ann Neurol. 1994;36(suppl):S47–S53. doi: 10.1002/ana.410360714. [DOI] [PubMed] [Google Scholar]
- 4.Raine CS. Multiple sclerosis: a pivotal role for the T cell in lesion development. Neuropathol Appl Neurobiol. 1991;17(4):265–274. doi: 10.1111/j.1365-2990.1991.tb00724.x. [DOI] [PubMed] [Google Scholar]
- 5.Luger D, et al. Either a Th17 or a Th1 effector response can drive autoimmunity: conditions of disease induction affect dominant effector category. J Exp Med. 2008;205(4):799–810. doi: 10.1084/jem.20071258. [DOI] [PMC free article] [PubMed] [Google Scholar]
- 6.Bettelli E, Kuchroo VK. IL-12- and IL-23-induced T helper cell subsets: birds of the same feather flock together. J Exp Med. 2005;201(2):169–171. doi: 10.1084/jem.20042279. [DOI] [PMC free article] [PubMed] [Google Scholar]
- 7.Cua DJ, et al. Interleukin-23 rather than interleukin-12 is the critical cytokine for autoimmune inflammation of the brain. Nature. 2003;421(6924):744–748. doi: 10.1038/nature01355. [DOI] [PubMed] [Google Scholar]
- 8.Steinman L. A brief history of T(H)17, the first major revision in the T(H)1/T(H)2 hypothesis of T cell-mediated tissue damage. Nat Med. 2007;13(2):139–145. doi: 10.1038/nm1551. [DOI] [PubMed] [Google Scholar]
- 9.Wildbaum G, Zohar Y, Karin N. Antigen-specific CD25- Foxp3- IFN-γ(high) CD4+ T cells restrain the development of experimental allergic encephalomyelitis by suppressing Th17. . Am J Pathol. 2010;176(6):2764–2775. doi: 10.2353/ajpath.2010.090855. [DOI] [PMC free article] [PubMed] [Google Scholar]
- 10.Sakaguchi S. Naturally arising Foxp3-expressing CD25+CD4+ regulatory T cells in immunological tolerance to self and non-self. . Nat Immunol. 2005;6(4):345–352. doi: 10.1038/ni1178. [DOI] [PubMed] [Google Scholar]
- 11.Shevach EM. Mechanisms of foxp3+ T regulatory cell-mediated suppression. . Immunity. 2009;30(5):636–645. doi: 10.1016/j.immuni.2009.04.010. [DOI] [PubMed] [Google Scholar]
- 12.Groux H, et al. A CD4+ T-cell subset inhibits antigen-specific T-cell responses and prevents colitis. . Nature. 1997;389(6652):737–742. doi: 10.1038/39614. [DOI] [PubMed] [Google Scholar]
- 13.Chen Y, Kuchroo VK, Inobe J, Hafler D, Weiner HL. Regulatory T-cell clones induced by oral tolerance: suppression of autoimmune encephalomyelitis. Science. 1994;265(5176):1237–1240. doi: 10.1126/science.7520605. [DOI] [PubMed] [Google Scholar]
- 14.Zlotnic A, Yoshei O. Chemokines: A new clasification system and their role in immunity. Immunity. 2000;12(2):121–127. doi: 10.1016/S1074-7613(00)80165-X. [DOI] [PubMed] [Google Scholar]
- 15.Proudfoot AE. chemokine receptors: A multifaceted therapeutic targets. Nat Rev Immunol. 2002;2(2):106–115. doi: 10.1038/nri722. [DOI] [PMC free article] [PubMed] [Google Scholar]
- 16.Luster AD. Chemokines — chemotactic cytokines that mediate inflammation. N Engl J Med. 1998;338(7):436–445. doi: 10.1056/NEJM199802123380706. [DOI] [PubMed] [Google Scholar]
- 17.Liu JJ, Horst R, Katritch V, Stevens RC, Wuthrich K. Biased signaling pathways in β2-adrenergic receptor characterized by 19F-NMR. Science. 2012;335(6072):1106–1110. doi: 10.1126/science.1215802. [DOI] [PMC free article] [PubMed] [Google Scholar]
- 18.Blattermann S, et al. A biased ligand for OXE-R uncouples Gα and Gβγ signaling within a heterotrimer. Nat Chem Biol. 2012;8(7):631–638. doi: 10.1038/nchembio.962. [DOI] [PubMed] [Google Scholar]
- 19.Rajagopal S, et al. β-Arrestin- but not G protein-mediated signaling by the “decoy” receptor CXCR7. Proc Natl Acad Sci U S A. 2010;107(2):628–632. doi: 10.1073/pnas.0912852107. [DOI] [PMC free article] [PubMed] [Google Scholar]
- 20.Reiter E, Ahn S, Shukla AK, Lefkowitz RJ. Molecular mechanism of β-arrestin-biased agonism at seven-transmembrane receptors. Annu Rev Pharmacol Toxicol. 2012;52:179–197. doi: 10.1146/annurev.pharmtox.010909.105800. [DOI] [PMC free article] [PubMed] [Google Scholar]
- 21.Zimmerman B, et al. Differential β-arrestin-dependent conformational signaling and cellular responses revealed by angiotensin analogs. Sci Signal. 2012;5(221):ra33. doi: 10.1126/scisignal.2002522. [DOI] [PubMed] [Google Scholar]
- 22.Kantor R, Bakhanashvili M, Achiron A. A mutated CCR5 gene may have favorable prognostic implications in MS. Neurology. 2003;61(2):238–240. doi: 10.1212/01.WNL.0000069921.20347.9E. [DOI] [PubMed] [Google Scholar]
- 23.Liu MT, Keirstead HS, Lane TE. Neutralization of the chemokine CXCL10 reduces inflammatory cell invasion and demyelination and improves neurological function in a viral model of multiple sclerosis. J Immunol. 2001;167(7):4091–4097. doi: 10.4049/jimmunol.167.7.4091. [DOI] [PubMed] [Google Scholar]
- 24.Liu MT, Armstrong D, Hamilton TA, Lane TE. Expression of Mig (monokine induced by interferon-γ) is important in T lymphocyte recruitment and host defense following viral infection of the central nervous system. J Immunol. 2001;166(3):1790–1795. doi: 10.4049/jimmunol.166.3.1790. [DOI] [PubMed] [Google Scholar]
- 25.Ransohoff RM, Kivisakk P, Kidd G. Three or more routes for leukocyte migration into the central nervous system. Nat Rev Immunol. 2003;3(7):569–581. doi: 10.1038/nri1130. [DOI] [PubMed] [Google Scholar]
- 26.Rottman JB, Slavin AJ, Silva R, Weiner HL, Gerard CG, Hancock WW. Leukocyte recruitment during onset of experimental allergic encephalomyelitis is CCR1 dependent. Eur J Immunol. 2000;30(8):2372–2377. doi: 10.1002/1521-4141(2000)30:8<2372::AID-IMMU2372>3.0.CO;2-D. [DOI] [PubMed] [Google Scholar]
- 27.Sorensen TL, et al. Expression of specific chemokines and chemokine receptors in the central nervous system of multiple sclerosis patients. J Clin Invest. 1999;103(6):807–815. doi: 10.1172/JCI5150. [DOI] [PMC free article] [PubMed] [Google Scholar]
- 28.Balashov KE, Rottman JB, Weiner HL, Hancock WW. CCR5(+) and CXCR3(+) T cells are increased in multiple sclerosis and their ligands MIP-1alpha and IP-10 are expressed in demyelinating brain lesions. Proc Natl Acad Sci U S A. 1999;96(12):6873–6878. doi: 10.1073/pnas.96.12.6873. [DOI] [PMC free article] [PubMed] [Google Scholar]
- 29.Huang D, et al. Chemokines and chemokine receptors in inflammation of the nervous system: manifold roles and exquisite regulation. Immunol Rev. 2000;177:52–67. doi: 10.1034/j.1600-065X.2000.17709.x. [DOI] [PubMed] [Google Scholar]
- 30.Huang DR, Wang J, Kivisakk P, Rollins BJ, Ransohoff RM. Absence of monocyte chemoattractant protein 1 in mice leads to decreased local macrophage recruitment and antigen-specific T helper cell type 1 immune response in experimental autoimmune encephalomyelitis. J Exp Med. 2001;193(6):713–726. doi: 10.1084/jem.193.6.713. [DOI] [PMC free article] [PubMed] [Google Scholar]
- 31.Godiska R, Chantry D, Dietsch GN, Gray PW. Chemokine expression in murine experimental allergic encephalomyelitis. J Neuroimmunol. 1995;58(2):167–176. doi: 10.1016/0165-5728(95)00008-p. [DOI] [PubMed] [Google Scholar]
- 32.Izikson L, Klein RS, Charo IF, Weiner HL, Luster AD. Resistance to experimental autoimmune encephalomyelitis in mice lacking the CC chemokine receptor (CCR)2. J Exp Med. 2000;192(7):1075–1080. doi: 10.1084/jem.192.7.1075. [DOI] [PMC free article] [PubMed] [Google Scholar]
- 33.Fife BT, et al. CXCL10 (IFN-γ-inducible protein-10) control of encephalitogenic CD4+ T cell accumulation in the central nervous system during experimental autoimmune encephalomyelitis. . J Immunol. 2001;166(12):7617–7624. doi: 10.4049/jimmunol.166.12.7617. [DOI] [PubMed] [Google Scholar]
- 34.Fife BT, Paniagua MC, Lukacs NW, Kunkel SL, Karpus WJ. Selective CC chemokine receptor expression by central nervous system-infiltrating encephalitogenic T cells during experimental autoimmune encephalomyelitis. J Neurosci Res. 2001;66(4):705–714. doi: 10.1002/jnr.10037. [DOI] [PubMed] [Google Scholar]
- 35.Karpus WJ, Lukacs NW, McRae BL, Strieter RM, Kunkel SL, Miller SD. An important role for the chemokine macrophage inflammatory protein-1 α in the pathogenesis of the T cell-mediated autoimmune disease, experimental autoimmune encephalomyelitis. J Immunol. 1995;155(10):5003–5010. [PubMed] [Google Scholar]
- 36.Meiron M, Zohar Y, Anunu R, Wildbaum G, Karin N. CXCL12 (SDF-1α) suppresses ongoing experimental autoimmune encephalomyelitis by selecting antigen-specific regulatory T cells. J Exp Med. 2008;205(11):2643–2655. doi: 10.1084/jem.20080730. [DOI] [PMC free article] [PubMed] [Google Scholar]
- 37.Qin S, et al. The chemokine receptors CXCR3 and CCR5 mark subsets of T cells associated with certain inflammatory reactions. J Clin Invest. 1998;101(4):746–754. doi: 10.1172/JCI1422. [DOI] [PMC free article] [PubMed] [Google Scholar]
- 38.Sallusto F, Lenig D, Mackay CR, Lanzavecchia A. Flexible programs of chemokine receptor expression on human polarized T helper 1 and 2 lymphocytes. J Exp Med. 1998;187(6):875–883. doi: 10.1084/jem.187.6.875. [DOI] [PMC free article] [PubMed] [Google Scholar]
- 39.Nakae S, Iwakura Y, Suto H, Galli SJ. Phenotypic differences between Th1 and Th17 cells and negative regulation of Th1 cell differentiation by IL-17. J Leukoc Biol. 2007;81(5):1258–1268. doi: 10.1189/jlb.1006610. [DOI] [PubMed] [Google Scholar]
- 40.Colvin RA, Campanella GS, Sun J, Luster AD. Intracellular domains of CXCR3 that mediate CXCL9, CXCL10, and CXCL11 function. J Biol Chem. 2004;279(29):30219–30227. doi: 10.1074/jbc.M403595200. [DOI] [PubMed] [Google Scholar]
- 41.Colvin RA, Campanella GS, Manice LA, Luster AD. CXCR3 requires tyrosine sulfation for ligand binding and a second extracellular loop arginine residue for ligand-induced chemotaxis. Mol Cell Biol. 2006;26(15):5838–5849. doi: 10.1128/MCB.00556-06. [DOI] [PMC free article] [PubMed] [Google Scholar]
- 42.Wildbaum G, Netzer N, Karin N. Plasmid DNA encoding IFN-gamma-inducible protein 10 redirects antigen-specific T cell polarization and suppresses experimental autoimmune encephalomyelitis. J Immunol. 2002;168(11):5885–5892. doi: 10.4049/jimmunol.168.11.5885. [DOI] [PubMed] [Google Scholar]
- 43.Salomon I, Netzer N, Wildbaum G, Schif-Zuck S, Maor G, Karin N. Targeting the function of IFN-γ-inducible protein 10 suppresses ongoing adjuvant arthritis. J Immunol. 2002;169(5):2685–2693. doi: 10.4049/jimmunol.169.5.2685. [DOI] [PubMed] [Google Scholar]
- 44.Sun J, Madan R, Karp CL, Braciale TJ. Effector T cells control lung inflammation during acute influenza virus infection by producing IL-10. Nat Med. 2009;15(3):277–284. doi: 10.1038/nm.1929. [DOI] [PMC free article] [PubMed] [Google Scholar]
- 45.Sierro F, et al. Disrupted cardiac development but normal hematopoiesis in mice deficient in the second CXCL12/SDF-1 receptor, CXCR7. Proc Natl Acad Sci U S A. 2007;104(37):14759–14764. doi: 10.1073/pnas.0702229104. [DOI] [PMC free article] [PubMed] [Google Scholar]
- 46.Burns JM, et al. A novel chemokine receptor for SDF-1 and I-TAC involved in cell survival, cell adhesion, and tumor development. J Exp Med. 2006;203(9):2201–2213. doi: 10.1084/jem.20052144. [DOI] [PMC free article] [PubMed] [Google Scholar]
- 47.Hartmann TN, et al. A crosstalk between intracellular CXCR7 and CXCR4 involved in rapid CXCL12-triggered integrin activation but not in chemokine-triggered motility of human T lymphocytes and CD34+ cells. . J Leukoc Biol. 2008;84(4):1130–1140. doi: 10.1189/jlb.0208088. [DOI] [PubMed] [Google Scholar]
- 48.Drury LJ, et al. Monomeric and dimeric CXCL12 inhibit metastasis through distinct CXCR4 interactions and signaling pathways. Proc Natl Acad Sci U S A. 2011;108(43):17655–17660. doi: 10.1073/pnas.1101133108. [DOI] [PMC free article] [PubMed] [Google Scholar]
- 49.Vila-Coro AJ, Rodriguez-Frade JM, Martin De Ana A, Moreno-Ortiz MC, Martinez AC, Mellado M. The chemokine SDF-1α triggers CXCR4 receptor dimerization and activates the JAK/STAT pathway. FASEB J. 1999;13(13):1699–1710. [PubMed] [Google Scholar]
- 50.Smit MJ, et al. CXCR3-mediated chemotaxis of human T cells is regulated by a Gi- and phospholipase C-dependent pathway and not via activation of MEK/p44/p42 MAPK nor Akt/PI-3 kinase. Blood. 2003;102(6):1959–1965. doi: 10.1182/blood-2002-12-3945. [DOI] [PubMed] [Google Scholar]
- 51.Gagliani N, et al. Coexpression of CD49b and LAG-3 identifies human and mouse T regulatory type 1 cells. Nat Med. 2013;19(6):739–746. doi: 10.1038/nm.3179. [DOI] [PubMed] [Google Scholar]
- 52.Apetoh L, et al. The aryl hydrocarbon receptor interacts with c-Maf to promote the differentiation of type 1 regulatory T cells induced by IL-27. Nat Immunol. 2010;11(9):854–861. doi: 10.1038/ni.1912. [DOI] [PMC free article] [PubMed] [Google Scholar]
- 53.Finck BK, Linsley PS, Wofsy D. Treatment of murine lupus with CTLA4Ig. Science. 1994;265(5176):1225–1227. doi: 10.1126/science.7520604. [DOI] [PubMed] [Google Scholar]
- 54.Luttrell LM, et al. β-Arrestin-dependent formation of β2 adrenergic receptor-Src protein kinase complexes. Science. 1999;283(5402):655–661. doi: 10.1126/science.283.5402.655. [DOI] [PubMed] [Google Scholar]
- 55.Samama P, Cotecchia S, Costa T, Lefkowitz RJ. A mutation-induced activated state of the β2-adrenergic receptor. Extending the ternary complex model. J Biol Chem. 1993;268(7):4625–4636. [PubMed] [Google Scholar]
- 56.Izhak L, et al. A novel recombinant fusion protein encoding a 20-amino acid residue of the third extracellular (E3) domain of CCR2 neutralizes the biological activity of CCL2. J Immunol. 2009;183(1):732–739. doi: 10.4049/jimmunol.0802746. [DOI] [PubMed] [Google Scholar]
- 57.Sapir Y, Vitenshtein A, Barsheshet Y, Zohar Y, Wildbaum G, Karin N. A fusion protein encoding the second extracellular domain of CCR5 arrests chemokine-induced cosignaling and effectively suppresses ongoing experimental autoimmune encephalomyelitis. J Immunol. 2010;185(4):2589–2599. doi: 10.4049/jimmunol.1000666. [DOI] [PubMed] [Google Scholar]
- 58.Serbina NV, Pamer EG. Monocyte emigration from bone marrow during bacterial infection requires signals mediated by chemokine receptor CCR2. Nat Immunol. 2006;7(3):311–317. doi: 10.1038/ni1309. [DOI] [PubMed] [Google Scholar]
- 59.Liu L, et al. Severe disease, unaltered leukocyte migration, and reduced IFN-γ production in CXCR3–/– mice with experimental autoimmune encephalomyelitis. . J Immunol. 2006;176(7):4399–4409. doi: 10.4049/jimmunol.176.7.4399. [DOI] [PubMed] [Google Scholar]
- 60.Frigerio S, et al. Beta cells are responsible for CXCR3-mediated T-cell infiltration in insulitis. Nat Med. 2002;8(12):1414–1420. doi: 10.1038/nm1202-792. [DOI] [PubMed] [Google Scholar]
- 61.Guo L, Hu-Li J, Paul WE. Probabilistic regulation of IL-4 production in Th2 cells: accessibility at the Il4 locus. Immunity. 2004;20(2):193–203. doi: 10.1016/S1074-7613(04)00025-1. [DOI] [PubMed] [Google Scholar]
- 62.Irannejad R, et al. Conformational biosensors reveal GPCR signalling from endosomes. Nature. 2013;495(7442):534–538. doi: 10.1038/nature12000. [DOI] [PMC free article] [PubMed] [Google Scholar]
- 63.Lohse MJ, Calebiro D. Cell biology: receptor signals come in waves. Nature. 2013;495(7442):457–458. doi: 10.1038/nature12086. [DOI] [PubMed] [Google Scholar]
- 64.Chaudhry A, et al. Interleukin-10 signaling in regulatory T cells is required for suppression of Th17 cell-mediated inflammation. Immunity. 2011;34(4):566–578. doi: 10.1016/j.immuni.2011.03.018. [DOI] [PMC free article] [PubMed] [Google Scholar]
- 65.Madan R, et al. Nonredundant roles for B cell-derived IL-10 in immune counter-regulation. J Immunol. 2009;183(4):2312–2320. doi: 10.4049/jimmunol.0900185. [DOI] [PMC free article] [PubMed] [Google Scholar]
- 66.McRae BL, Vanderlugt CL, Dal Canto MC, Miller SD. Functional evidence for epitope spreading in the relapsing pathology of experimental autoimmune encephalomyelitis. J Exp Med. 1995;182(1):75–85. doi: 10.1084/jem.182.1.75. [DOI] [PMC free article] [PubMed] [Google Scholar]
- 67.Krutzik PO, Nolan GP. Intracellular phospho-protein staining techniques for flow cytometry: monitoring single cell signaling events. Cytometry A. 2003;55(2):61–70. doi: 10.1002/cyto.a.10072. [DOI] [PubMed] [Google Scholar]
- 68.Carothers AM, Urlaub G, Mucha J, Grunberger D, Chasin LA. Point mutation analysis in a mammalian gene: rapid preparation of total RNA, PCR amplification of cDNA, and Taq sequencing by a novel method. Biotechniques. 1989;7(5):494–496. [PubMed] [Google Scholar]
- 69.Schif-Zuck S, et al. Targeted overexpression of IL-18 binding protein at the central nervous system overrides flexibility in functional polarization of antigen-specific Th2 cells. J Immunol. 2005;174(7):4307–4315. doi: 10.4049/jimmunol.174.7.4307. [DOI] [PubMed] [Google Scholar]
Associated Data
This section collects any data citations, data availability statements, or supplementary materials included in this article.