

Abstract
In this article we develop a model of the relationship between crash risk and a driver’s situation awareness. We consider a driver’s situation awareness to reflect the dynamic mental model of the driving environment and to be dependent upon several psychological processes including Scanning the driving environment, Predicting and anticipating hazards, Identifying potential hazards in the driving scene as they occur, Deciding on an action, and Executing an appropriate Response (SPIDER). Together, SPIDER is important for establishing and maintaining good situation awareness of the driving environment and good situation awareness is important for coordinating and scheduling the SPIDER-relevant processes necessary for safe driving. An Order-of-Processing (OP) model makes explicit the SPIDER-relevant processes and how they predict the likelihood of a crash when the driver is or is not distracted by a secondary task. For example, the OP model shows how a small decrease in the likelihood of any particular SPIDER activity being completed successfully (because of a concurrent secondary task performance) would lead to a large increase in the relative risk of a crash.
INTRODUCTION
A driver’s situation awareness reflects the dynamic mental model of the driving environment (e.g., Durso, Rawson, & Girotto, 2007; Endsley, 1995; Gugerty, in press; Horrey, Wickens, & Consalus, 2007). Situation awareness in driving is dependent upon several psychological processes including Scanning specific areas for indications of threats (potential or actual), Predicting where threats might materialize if they are not visible (e.g., anticipate hazards), Identifying threats and threatening scenarios when they occur, Deciding whether an action is necessary and what action is necessary based on the identification of a threat, and Executing appropriate Responses (e.g., hazard mitigation) – SPIDER for short. As illustrated in Figure 1, there is a reciprocal relationship between SPIDER and situation awareness – SPIDER is important for establishing and maintaining good situation awareness and good situation awareness is important for coordinating and scheduling the SPIDER-relevant processes. In this paper, we sketch out a theoretical model of the relationship between SPIDER, situation awareness, and motor vehicle crash risk.
Figure 1.
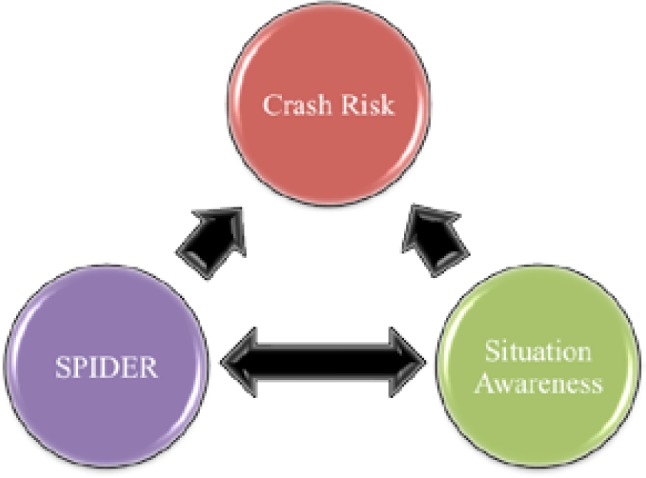
A model depicting the relationship between SPIDER-related processes, situation awareness, and crash risk.
We consider SPIDER to be an active set of psychological proceeses that have been empirically demonstrated to be dependent on limited capacity attention (Kahenamen, 1973). Following Endsley (1995), we consider situation awareness to be a psychological state that is mediated by these SPIDER-related psychological processes. If drivers engage in secondary activities, attention may be diverted from driving, thereby impairing performance (Regan and Strayer, in press). For example, when a driver talks on a cellular phone, visual scanning is disrupted (Recarte & Nunes, 2000; Tsai et al., 2007; Victor, Harbluk, & Engström, 2005; Reimer, 2009), prediction of hazards is impaired (Taylor et al., 2013; Strayer et al., 2013), identification of objects and events in the driving environment is retarded (Strayer & Drews, 2007; Strayer, Drews, & Johnston, 2003), decision for action is altered (Cooper et al., 2009, Drews, Pasupathi, & Strayer, 2008), and apropriate reactions are delayed (Caird et al., 2008; Horrey & Wickens, 2006). Empirical studies have thus established that the psychological processes reflected in SPIDER are compromised by the diversion of attention from driving (Strayer, et al., 2013).
A number of models of crash risk have been developed over the years. Early models related crash risk to factors other than the driver. Typically, such models are macroscopic in nature, quantifying relations between crashes and traffic flow at a single site (e.g., Gwyn, 1967; Joshua & Garber, 1990). More recent models are more microscopic (e.g., Persaud & Mucsi 1995), attempting to quantify the relation between crashes and both traffic condition variables (e.g., level of service) and geometric characteristics (e.g., number of lanes). However, there are very few models of crash risk that take into account driver behaviors. The few macroscopic behavioral models that exist relate factors such as duration of glances away from the forward roadway to crash risk (Horrey & Wickens, 2007; Liang, Lee & Yekhshatyan, 2012). In this paper we propose a microscopic model that relates a driver’s actions (SPIDER-related processes) in a particular situation to crash risk where the outcome of each of the actions depends and informs the driver’s situation awareness. Only by doing so can we fully understand how distraction influences each of these latent cognitive processes involved in hazard anticipation, hazard mitigation and attention maintenance, an understanding of which can ultimately drive the design of interfaces and other technologies to reduce the effects of distraction.
An example scenario can help make clear the details of the microscopic behavioral model that we are proposing. Suppose that a driver is approaching a curve in the road with a Stop Sign Ahead (SSA) Sign just before the driver enters the curve (Figure 2). Further, suppose that bushes hide the Stop Sign until the driver is almost at the intersection. Then, a driver is fully situationally aware if s/he both has processed the SSA Sign and the Stop Sign and made the appropriate reaction (i.e., stopped). Of course, not all drivers will be fully situationally aware. The changes in situational awareness can be related to the likelihood that the activities complete successfully at each stage of processing (SPIDER). The sequence of activities determines, in turn, the risk of a crash.
Figure 2.

Curve with Stop Sign Ahead Sign and Stop Sign at intersection. The Stop Sign Ahead Sign is visible before the driver enters the curve; the Stop Sign is not yet visible at the end of the curve.
OP Diagram
We now describe the detailed cognitive processing that occurs in a scenario like the one just described. An Order-of-Processing (OP) Diagram can make clear the steps that a driver completes (or does not complete) as he or she passes the SSA Sign and then encounters the Stop Sign itself (Schweickert, Fisher and Sung, 2012). Each of the states (boxes) in the OP diagram consists of a current set of activities (listed in the top half of each state) and an indication of the level of situation awareness (identified in the bottom half). There are four possible activities in the upper half of each state (scanning, prediction, identification, deciding, and execution of a response). There are four possible states of situation awareness listed in the bottom half of each state (SA-, SA-/-, SA+ and SA+/+). Dashed lines connect states in which the activity in the upper half was not completed successfully. Solid lines connect states in which the activity in the upper half was completed successfully.
Scanning for Stop Sign Ahead Sign (s-1)
Return to the example of the driver entering a curve and the construction of an OP diagram for the driver’s processing of information in the curve. The first question is whether the driver scans for the SSA Sign. The driver begins in state s-1 by scanning (or not) for the SSA Sign. It is assumed that the situation awareness (SA) level at this point in time is at some predetermined level, what will be referred to as baseline. Baseline SA is highlighted in yellow in Figure 3. If the driver successfully glances at the SSA sign, the driver then needs to predict (s-2), and identify (s-3) the fact that a Stop Sign will occur somewhere downstream, decide to scan for the Stop Sign (s-4), and actually execute the scan (t-1). The SA level is increased (SA+) and this is highlighted in green in state t-1 because the driver is now aware of a specific aspect of the situation of which s/he was not previously aware that can impact safety.
Figure 3.

Scanning the Stop Sign Ahead Sign: OP Diagram
At any point, the driver could fail to complete the activity in the upper half of a state, in which case the driver would not be aware of the SSA Sign and therefore the SA level would decrease (SA-, highlighted in orange). This failure can occur in any of states s-1, s-2, s-3, and, s-4, leading to state r-1.
Scanning for Stop Sign after Failing to Identify Stop Sign Ahead Sign (r-1)
If the driver failed to notice the SSA Sign (state r-1 in Figure 3; continued in Figure 4), then the driver will be less aware that a Stop Sign is ahead and could easily be obscured by bushes or geometry. Thus, the driver is less likely to be on the alert for a Stop Sign. However, the driver could still glance at the Stop Sign, predicted perhaps by the roadway geometry (r-2), identify that s/he needed to stop (r-3), decide to stop (r-4), and execute a stop (r-5), as depicted in Figure 4. After the decision is made to stop (r-4), the SA increases in state r-5 because now the driver is aware of the Stop Sign and has acted upon it. However, the driver may still not be cognizant of the fact that this is a situation in which other drivers may unaware of the Stop Sign because they failed to detect the SSA Sign. Thus, the final SA is yellow (baseline). It is important to know that others may not see the SSA Sign because this could lead to a rear-end collision. If the driver does not see the SSA Sign or the Stop Sign (r-6), then the driver is aware neither of the cross traffic nor the potential threats from the rear. Thus, the situation awareness is at its lowest possible level (highlighted in red).
Figure 4.

Scanning the Stop Sign Given Failure to See and Process the Stop Sign Ahead Sign: OP Diagram
Scanning for Stop Sign After Identifying Stop Sign Ahead Sign (t-1)
Finally, the driver might well have predicted and identified the SSA Sign and acted accordingly (t-1, Figure 3; continued in Figure 5). If everything continues to go well, the driver will be aware not only of the SSA Sign but also the Stop Sign and therefore should be maximally situationally aware (t-5; highlighted in blue). As before, some one or the other of the steps can fail, in which case the driver would miss the Stop Sign (t-6).
Figure 5.

Scanning the Stop Sign Given Stop Sign Ahead Sign has been Processed: OP Diagram
Predicting Likelihood of a Crash When Not Distracted
Note that the likelihood of a crash is presumably a function of the likelihood of the particular terminal state. So, for example, the likelihood of a crash is largest in state r-6 where both the SSA Sign and Stop Sign have been missed. The table below indicates what has and has not been missed for each of the terminal states:
Table 1.
Terminal States
| State | Stop Sign Ahead Sign | Stop Sign |
|---|---|---|
| r-6 | missed | missed |
| r-5 | missed | processed |
| t-6 | processed | missed |
| t-5 | processed | processed |
It is a simple matter using the OP diagram to predict the likelihood of a crash based on the driver’s relative level of situational awareness from the above figures if one is willing to make certain simplifying assumptions. Perhaps the most critical is the assumption that the probability that a driver is in a state, say k, given that the driver was in states j1,...,jn prior to arriving in state k, depends only on the immediately preceding state, jn, not on the n-1 prior states, jn-1,..., j1. For example, the probability that the driver reaches state t-5, given that the driver occupied states t-4, t-3, t-2, and, t-1 depends only on the probability that the driver occupied state t-4, i.e.,
| Equation 1 |
The second simplifying assumption is that the probability that a process h is executed successfully in state k is a function of the level of situation awareness in the previous state j where, ordinally,
| Equation 2 |
So, for example, if h is the activity of identifying a stimulus, given that it has been scanned and predicted, then we would want our transition probabilities to be ordered as follows:
| Equation 3 |
This is enough to compute the probability that a driver is in any one of the terminal states, r-5, r-6, t-5 or t-6 given that one can assign numbers to the various transition probabilities for each of the activities h. Normally, one would fit the model to some data and find the maximum likelihood estimate for each transition probability. But, in our case, absent relevant data, for purposes of illustration we can estimate the transition probabilities in Equation 2 for each of the activities h. Again, keeping things simple, for any activity h, one and the same number can be assigned to the conditional probability that the activity is completed successfully, given the level of situation awareness in the previous state.
So, for example, for h = {Scan SSA, Predict SSA, Identify SSA,, Decide Scan}, we can assign one and the same number to the probability that the activity is completed, given level SA of situation awareness. Say that this probability is .96. Then,
Similarly, we can assign the following transition probabilities for any activity h:
We would expect drivers to complete some activity h, given their situation awareness had increased, with a probability greater than this probability when their situation awareness level was at baseline.
The probability that a driver is in a terminal state is then simply the sum of the probabilities of all paths that lead to that terminal state. So, for example, consider the terminal state r-1. A partial list of the paths is given below:
| Equation 4 |
Because it is assumed that the probability that an activity h in state k completes successfully is a function only of the situation awareness of the driver in the previous state j, the probability of any particular path can then be rewritten as a product of conditional probabilities. For example,
| Equation 5 |
If one computed the probability of all paths leading to the terminal state r-6 as above, one would obtain as a final probability 0.131129. From Table 1 we see that in terminal state r-6 the driver has missed both the SSA Sign and the Stop Sign. Thus, the probability of a crash for a driver in terminal state r-6 is relatively high. Note that the probability that a driver is in a crash is not the same as the probability that the driver is in state r-6. The probability of a crash depends at the very least on the presence of other vehicles. One can perform similar calculations to obtain the probability that the driver is in each of the other terminal states.
Predicting Likelihood of a Crash When Distracted
Ideally, one wants to predict not just the probability of a crash, but the extent to which distraction increases the likelihood of a crash. Let’s assume that when the driver is distracted the transition probabilities are decreased only by 5%. Then it is easy to show that the probability of a driver being in terminal state r-6 more than doubles, to 0.275668. In other words, the small decrease in the likelihood that the driver is successful at completing any one activity cascades throughout the entire systems in ways that are severe, at least when it comes to the effects of distraction.
Predicting the Effects of Distraction: The Relative Risk and the Odds Ratio
Typically, one reports the effects of distraction either as the relative risk or as the odds ratio. Since we do not know the function that relates the probability of being in a particular state to the probability of a crash, we cannot predict either without making some assumptions. Consider just the relative risk (RR) for individuals in terminal state r-6. This is computed as follows:
| Equation 6 |
If we assume that the functions f and g are identical and simply one and the same linear function of the probability that a driver is in terminal state r-6, then the relative risk is easily computed. In the above example, the 5% decrease in the likelihood of any particular activity being completed successfully would lead to a relative risk of 2.102 simply by substituting into Equation 6 the example probabilities computed above.
Limitations and Discussion
It is clear from the above discussion that a number of simplifying assumptions need to be made in order to obtain predictions from the model. However, in a laboratory setting these predictions can be tested and the estimates of the transition probabilities can be refined with appropriate experimental controls in place. It is almost certainly not the case that the probability of a given activity completing successfully depends only on the level of situation awareness of the prior state. Moreover, on the roadway the SPIDER-related processes may operate in parallel and be more interactive. Understanding these temporal dynamics and contingencies will be important for model refinement; however, the essential point is that the driver’s current state of situation awareness is mediated by SPIDER-related psychological processes, which have been shown to be sensitive to secondary-task interference. The modeling is important because it illustrates how relatively small decreases in the likelihood of a SPIDER process being successfully completed can cascade into a large relative risk of a crash.
The OP modeling of situation awareness developed in this article is consistent with earlier approaches that consider situation awareness to be a state of knowledge pertaining to “knowing what is going on” in dynamic environments (e.g., Endsley, 1995). For Endsley, situation awareness involves the processes of perception of elements in the current situation, comprehension of the current situation, and prediction of future states. In this context, even small lapses in situation awareness can lead to poor performance. It should be evident that the SPIDER-related processes used in the OP model to predict situation awareness and crash risk overlap with those described by Endsley (1995).
Our modeling extends the earlier work on situation awareness by identifying the processes related to driving with greater specificity, documenting how these processes are adversely affected by concurrent secondary tasks, and formalizing the model to demonstrate how small changes in the successful completion of a process can translate into large decrements in driver performance. The modeling effort is particularly informative because it may be counterintuitive how small changes in the component processes can cascade into large impairments in performance.
An interesting theoretical question that the model could answer is which processing activity is most affected by distraction. A corollary question of important applied interest is how one might then either train or educate drivers to overcome the effects of driving-related distraction (perhaps through self-regulation to avoid engaging in the distracting activity when operating the vehicle) or apply sensors in the vehicle that were targeted at identifying the points in time when distraction was most likely to carry additional risk. It may also be possible to use the model and appropriate physiological metrics obtained from the driver (e.g. eye movements, heart rate, etc.) to develop a real-time assessment of the drivers’ situation awareness of the driving environment and alert the driver to potential hazards if they are not sufficiently aware of them.
As the modeling of situation awareness in driving progresses, it will be important to consider the expertise of the driver. Driving is a skill that improves with practice and novice drivers have not yet developed the expertise in deploying the SPIDER-related processes that are necessary for safe driving. Consequently, novice drivers are often more susceptible to secondary-task activities that divert attention from driving and thereby compromise their situation awareness (Durbin, McGehee, et al, in this special issue).
Acknowledgments
This paper was written as part of the Engaged Driving Initiative (EDI) created by State Farm Mutual Automobile Insurance Company (State Farm®). The EDI Expert Panel was administered by the Association for the Advancement of Automotive Medicine (AAAM) and chaired by Susan Ferguson, Ph.D., President, Ferguson International LLC. The views presented in this paper are those of the author(s) and are not necessarily the views of State Farm, AAAM or Ferguson International LLC.
REFERENCES
- Caird JK, Chisholm SL, Edwards CJ, Creaser JI. The effect of yellow light onset time on older and younger drivers' perception response time (PRT) and intersection behavior. Transportation Research Part F: Traffic Psychology and Behaviour. 2007;10:383–396. [Google Scholar]
- Cooper JM, Vladisavljevic I, Medeiros-Ward N, Martin PT, Strayer DL. Near the tipping point of traffic stability: An investigation of driving while conversing on a cell phone in simulated highway traffic of varying densities. Human Factors. 2009;51:261–268. doi: 10.1177/0018720809337503. [DOI] [PubMed] [Google Scholar]
- Drews FA, Pasupathi M, Strayer DL. Passenger and cell-phone conversation during simulated driving. Journal of Experimental Psychology: Applied. 2008;14:392–400. doi: 10.1037/a0013119. [DOI] [PubMed] [Google Scholar]
- Durso F, Rawson K, Girotto S. Comprehension and situation awareness. In: Durso FT, Nickerson R, Dumais ST, Lewandowsky S, Perfect T, editors. The Handbook of Applied Cognition. 2nd. Chicester: Wiley; 2007. [Google Scholar]
- Endsley MR. Towards a theory of situation awareness in dynamic systems. Human Factors. 1995;37(1):32–64. [Google Scholar]
- Gugerty L. Situation awareness in driving. In: Lee J, Rizzo M, Fisher D, Caird J, editors. Handbook for Driving Simulation in Engineering, Medicine and Psychology. CRC Press; in press. [Google Scholar]
- Gwynn DW. “Relationship of Accident Rates and Accident Involvements with Hourly Volumes.”. Traffic Quarterly. 1967;23:407–418. [Google Scholar]
- Horrey WJ, Wickens CD. Examining the impact of cell phone conversations on driving using meta-analytic techniques. Human Factors. 2006;48:196–205. doi: 10.1518/001872006776412135. [DOI] [PubMed] [Google Scholar]
- Horrey WJ, Wickens CD. In-Vehicle Glance Duration Distributions, Tails, and Model of Crash Risk. Transportation Research Record. 20072018:22–28. [Google Scholar]
- Horrey WJ, Wickens CD, Consalus KP. Modeling driversí visual attention allocation while interacting with in-vehicle technologies. Journal of Experimental Psychology: Applied. 2006;12(2):67–78. doi: 10.1037/1076-898X.12.2.67. [DOI] [PubMed] [Google Scholar]
- Joshua S, Garber N. “Estimating Truck Accident Rate and Involvements Using Linear and Poisson Regression Models.”. Transportation Planning and Technology. 1990;15:41–58. [Google Scholar]
- Kahneman D. Attention and effort . Englewood Cliffs, NJ: Prentice-Hall; 1973. [Google Scholar]
- Liang Y, Lee JD, Yekhshatyan L. How dangerous is looking away from the road? Algorithms predict crash risk from glance patterns in naturalistic driving. Human Factors. 2012;54:1104–1116. doi: 10.1177/0018720812446965. [DOI] [PubMed] [Google Scholar]
- Persaud BN, Mucsi K. Microscopic accident potential models for two-lane rural roads. Transportation Research Record. 1995;1485:134–139. [Google Scholar]
- Recarte MA, Nunes LM. Effects of verbal and spatial-imagery tasks on eye fixations while driving. Journal of Experimental Psychology: Applied. 2000;6:31–43. doi: 10.1037//1076-898x.6.1.31. [DOI] [PubMed] [Google Scholar]
- Reimer B. Impact of cognitive task complexity on drivers’ visual tunneling. Transportation Research Record: Journal of the Transportation Research Board. 2009;2138(-1):13–19. [Google Scholar]
- Regan MA, Strayer DL. Towards an understanding of driver inattention: taxonomy and theory. Annals of Advances in Automotive Medicine. 2014;58:7–15. In Press. [PMC free article] [PubMed] [Google Scholar]
- Schweickert R, Fisher DL, Sung K. Discovering Cognitive Architecture by Selectively Influencing Mental Processes. Vol. 4. Singapore: World Scientific; 2012. (Advanced Series in Mathematical Psychology). [Google Scholar]
- Strayer DL, Cooper JM, Turrill J, Coleman J, Medeiros-Ward N, Biondi F. Measuring cognitive distraction in the automobile. AAA Foundation for Traffic Safety 2013 [Google Scholar]
- Strayer DL, Drews FA. Cell-phone induced inattention blindness. Current Directions in Psychological Science. 2007;16:128–131. [Google Scholar]
- Strayer DL, Drews FA, Johnston WA. Cell phone induced failures of visual attention during simulated driving. Journal of Experimental Psychology: Applied. 2003;9:23–52. doi: 10.1037/1076-898x.9.1.23. [DOI] [PubMed] [Google Scholar]
- Taylor T, Pradhan AK, Divekar G, Romoser M, Muttart J, Gomes R, Fisher DL. The view from the road; the contribution of on-road glance-monitoring technologies to understanding driver behavior. Accident Analysis and Prevention. 2013 doi: 10.1016/j.aap.2013.02.008. [DOI] [PubMed] [Google Scholar]
- Tsai Y, Viirre E, Strychacz C, Chase B, Jung T. Task performance and eye activity: Predicting behavior relating to cognitive workload. Aviation, Space, and Environmental Medicine. 2007;5:B176–b185. [PubMed] [Google Scholar]
- Victor TW, Harbluk JL, Engström JA. Sensitivity of eye-movement measures to in-vehicle task difficulty. Transportation Research Part F: Traffic Psychology and Behavior. 2005;8:167–190. [Google Scholar]