

Abstract
Carbohydrates participate in almost every aspect of biology from protein sorting to modulating cell differentiation and cell–cell interactions. To date, the majority of data gathered on glycan expression has been obtained via analysis with either anti-glycan antibodies or lectins. A detailed understanding of the specificities of these reagents is critical to the analysis of carbohydrates in biological systems. Glycan microarrays are increasingly used to determine the binding specificity of glycan-binding proteins (GBPs). In this study, six different glycan microarray platforms with different modes of glycan presentation were compared using five well-known lectins; concanavalin A, Helix pomatia agglutinin, Maackia amurensis lectin I, Sambucus nigra agglutinin and wheat germ agglutinin. A new method (universal threshold) was developed to facilitate systematic comparisons across distinct array platforms. The strongest binders of each lectin were identified using the universal threshold across all platforms while identification of weaker binders was influenced by platform-specific factors including presentation of determinants, array composition and self-reported thresholding methods. This work compiles a rich dataset for comparative analysis of glycan array platforms and has important implications for the implementation of microarrays in the characterization of GBPs.
Keywords: comparison, glycan microarray, lectin, presentation
Introduction
Glycan-binding proteins (GBPs), also referred to as carbohydrate-binding proteins, mediate a broad range of biological processes through interactions with glycans, including bacterial infection, inflammation and metastasis (Varki et al. 2009). On all known cell types, glycans cover the majority of the cell surface (Lanctot et al. 2007). Discovering the binding specificities for GBPs is crucial to understanding their biological roles and to our use of these proteins as analytical reagents (Kuno et al. 2005; Pilobello et al. 2005, 2007; Stowell et al. 2008, 2010). Glycan microarrays, in which libraries of natural or synthetic glycans are immobilized onto a solid support, are a powerful method for determining the binding specificities of GBPs (Fukui et al. 2002; Stallforth et al. 2008; Liu et al. 2009; Oyelaran et al. 2009; Smith et al. 2010; Heimburg-Molinaro et al. 2011; Rillahan and Paulson 2011; Park et al. 2013). Multiple platforms exist for glycan microarrays covering a broad range of glycan determinants and different presentations of glycans. Since all glycan microarray platforms represent a limited number of glycans relative to the number of naturally occurring structures, the GBP binding observed will be related to the platform used. Strong evidence exists that the presentation of glycans within different formats can have a profound effect on the apparent-binding affinity and specificity of GBPs (Brewer et al. 2002; Unverzagt et al. 2002; Oyelaran et al. 2009; Smith et al. 2010; Rillahan and Paulson 2011; Kilcoyne et al. 2012), resulting in differences in the binding profiles for GBPs examined on different platforms. Recent work by Padler-Karvani et al. compared two sialoglycoside arrays in which the modes of presentation were similar (amine-derivatized glycans coupled to activated glass slides), but structures of glycans differed significantly (Padler-Karavani et al. 2012). In this work, large agreement between datasets was found, but it was concluded that array format may affect outcome and suggested that a broader comparison of platforms is necessary to vet this conclusion.
Herein, we present the results of a broad comparison between microarray platforms from the six microarray laboratories participating in our cross-comparison study. The experiments were designed along the lines of glycoprofiling studies in which the same sample was sent to multiple mass spectrometry laboratories for analysis (Wada et al. 2007) and were intended to examine whether differences in analytical platforms across laboratories had a significant effect on reported GBP profiles. The microarrays in this study contained a wide diversity of glycans and varied in size, presentation and composition (Figure 1, Table I). Aliquots from the same protein lots for five well-known lectins (Table II), concanavalin A (Con A), Helix pomatia agglutinin (HPA), Maackia amurensis lectin I (MAL-I), Sambucus nigra agglutinin (SNA) and wheat germ agglutinin (WGA) were sent to each group. Comparison of the results from all groups concur with earlier work (Padler-Karavani et al. 2012), arguing that for strong binders there is good agreement between platforms, but for medium to weak binding interactions, which may be physiologically relevant, platforms and practices have a profound effect on the observed glycan-protein interactions. This has implications for interpreting glycan microarray data to determine the specificity of GBP-glycan-binding interactions.
Fig. 1.

Graphic representation of glycan array formats. Array 1-CFG; Array 2-Huflejt; Array 3-Gildersleeve; Array 4-Joshi; Array 5-Reichardt; Array 6-Pieters. Gray surface: Nexterion H® (NHS) slide, pink surface: epoxide slide, green surface: PamChip® (maleimide). Representative structures are shown.
Table I.
Summary of glycan microarrays from six research groups participating in this study
| Array | Research groups | Number of array components | Type of slides | Glycan or neoglycoprotein concentration (μM) | References |
|---|---|---|---|---|---|
| 1 | CFG | 611 | Nexterion H® | 100 | |
| 2 | Huflejt | 378 | Nexterion H® | 50 | Vuskovic et al. (2011) |
| 3 | Gildersleeve | 317 | Epoxide | 5–55 | Zhang and Gildersleeve (2012) |
| 4 | Joshi | 52 | Nexterion H® | 16–298 | Kilcoyne et al. (2012) |
| 5 | Reichardt | 39 | Nexterion H® | 50 | Serna et al. (2010) |
| 6 | Pieters | 20 | PamChip® | 500–5000 | Branderhorst et al. (2008) |
Table II.
List of five biotinylated lectins tested in this study
| Name | Abbreviation | Vendor | Catalog number | Lot number |
|---|---|---|---|---|
| Concanavalin A | Con A | EY Laboratories | BA-1104-5 | 290210-5 |
| Helix pomatia agglutinin | HPA | Sigma-Aldrich | L6512 | 028K3810V |
| Maackia amurensis lectin I | MAL-I | Vector Laboratories | B-13l5 | W0224 |
| Sambucus nigra agglutinin | SNA | Vector Laboratories | B-1305 | W0425 |
| Wheat germ agglutinin | WGA | EY Laboratories | BA-2101-5 | 290227 |
Results and discussion
Experimental design for cross-array comparison
Six glycan microarray research groups participated in this study which was coordinated by the laboratory of Dr. Lara Mahal (New York University): the Consortium for Functional Glycomics (http://www.functionalglycomics.org/static/consortium/resources/resourcecoreh.shtml, last accessed March 31, 2014) (CFG, Emory University School of Medicine, Array 1) and the laboratories of Dr. Margaret Huflejt (New York University School of Medicine, Array 2), Dr. Jeffrey Gildersleeve (National Cancer Institute, Array 3), Dr. Lokesh Joshi (National University of Ireland Galway, Array 4), Dr. Niels-Christian Reichardt (CICbiomaGUNE, Array 5) and Dr. Roland Pieters (Utrecht University, Array 6). Each group was sent five identical aliquots of biotinylated lectins (Con A, HPA, MAL-I, SNA and WGA; Table II) and highly purified bovine serum albumin (BSA, Boval) to minimize differences in binding due to lot-dependent lectin variation or glycan contaminants of BSA. The lectins used in this study are widely utilized throughout the biomedical community to examine glycosylation in mammalian systems (Van Damme et al. 1998). It should be noted, however, that the physiological ligands of these lectins may not be mammalian glycans and the platforms examined contained predominantly mammalian sugars. This study was designed to compare glycan-binding profiles obtained using different array platforms (i.e. different printing procedures, slide chemistries, glycans, glycan presentation and practices such as binding time, wash buffers, scanning protocols and analysis) to obtain information on the reliability of glycan profiles across laboratories and to identify issues that might play a role in glycan microarray interpretation. Each group was asked to run three select concentrations of each lectin on their glycan microarrays (50, 10 and 1 μg/mL), with an additional two concentrations of their choosing in the linear range of their system. Fluorophore-labeled streptavidin was used for detection of the binding across all platforms tested. Data were then sent to the laboratory of Dr. Lara Mahal, which has expertise in microarray datasets (Pilobello et al. 2005, 2007), for analysis.
Comparison of array platforms used in this study
To understand the similarities and differences between the arrays, we determined the level of overlap in glycan determinants between the six arrays. For simplicity, we ignored differences in linker type, coupling chemistry and glycan density in defining determinants, resulting in fewer determinants than glycan structures printed (Table III). No determinants were shared by all six arrays, showcasing the diversity inherent in these platforms. A Venn diagram representing the determinant overlap of the three largest arrays (Arrays 1–3) is shown in Figure 2. Of the 789 unique determinants represented by the three arrays, only 61 are shared between all three arrays, corresponding to 7.7% of the total. Examination of the two largest arrays (Array 1 and Array 2) showed the most total determinants in common (192 total, 64% of determinants on Array 2). However, the strongest overlap in determinants was observed between Arrays 3 and 4 (70% of Array 4) with 35 of the 50 determinants on Array 4 represented on the larger Array 3. Of these 35 common glycan structures, 23 were neoglycoproteins purchased from the same company, providing a direct comparison of the effects of slide chemistry and practices on binding.
Table III.
Binary comparison of overlapping determinants between the six arrays
| Array | 1 | 2 | 3 | 4 | 5 | 6 |
|---|---|---|---|---|---|---|
| 1 | 545 | 192 | 80 | 31 | 14 | 4 |
| 2 | 192 | 302 | 68 | 29 | 0 | 4 |
| 3 | 80 | 68 | 221 | 35 | 11 | 5 |
| 4 | 31 | 29 | 35 | 50 | 0 | 3 |
| 5 | 14 | 0 | 11 | 0 | 39 | 0 |
| 6 | 4 | 4 | 5 | 3 | 0 | 5 |
Determinant count ignores differences in linker type, coupling chemistry and glycan density.
Fig. 2.
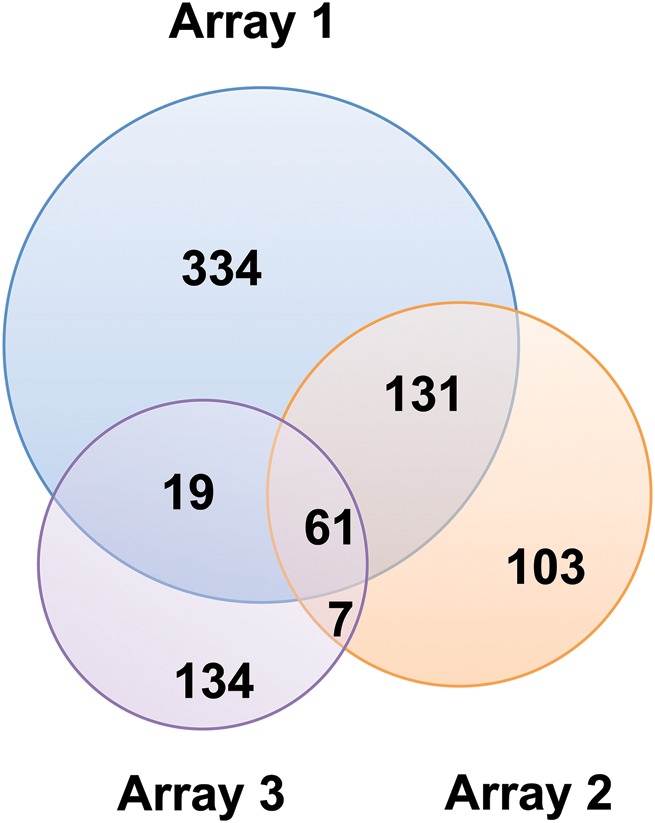
Venn diagram of determinants for Arrays 1–3. Number of determinants (overlapping and unique) are indicated.
With the exception of Array 6, which had only five determinants, each array contained determinants exclusive to that array. Each array platform had unique features and analytical protocols (Figure 1; Supplementary Methods). Array 1 is version 5.0 of the CFG array and is the largest of the group, with 611 glycan structures linked via a primary amine to an NHS-derivatized glass slide (Blixt et al. 2004; Heimburg-Molinaro et al. 2012). This array had the most diversity of determinants displayed and many of these were only found on this array. Array 2 used identical coupling and slide chemistries but differed from Array 1 in the size (378 glycan structures) and in the concentration of glycan deposited (Vuskovic et al. 2011). Array 5 also used similar coupling chemistry but was unique in that it was generated through a mixture of chemical synthesis and enzymatic elaboration, with 17 synthesized glycans elaborated with galactosyl- and sialyltransferases to create an array of 39 determinants. This array, while less diverse, had strong representation of larger N-linked glycan structures and contained a unique set of hybrid N-linked glycans (Serna et al. 2010). In contrast to these arrays, Arrays 3 and 4 both utilized neoglycoproteins, rather than glycan-amine monomers, to present the carbohydrate moieties. Array 3, printed on epoxide slides, is the larger of the two (317 glycan structures), and used the neoglycoprotein platform to vary the displayed density of some determinants (Zhang and Gildersleeve 2012). For example, Array 3 contained a unique series of Tn-antigen containing peptides. Array 4 was printed on an NHS-derivatized surface and contained 52 glycoproteins (Kilcoyne et al. 2012). Array 6 was highly focused and contained only five carbohydrate structures, but these structures were presented at varying valencies using a glycodendrimer approach (Parera Pera et al. 2010). These six arrays represent a wide variation in glycan microarray technology summarized in Table I; however, they are not all inclusive and several array types including neoglycolipid arrays (Fukui et al. 2002) and glycans on gold surfaces (Zhi et al. 2008) are not represented in this study. Overall, the divergence of represented determinants on the six arrays represented in this study complicates comparative analysis.
Quality control and data analysis of glycan array datasets
Representative images of the microarrays upon binding of WGA are shown in Figure 3 (see Supplementary data, Figure S1 for images from all lectins). As a quality control measure for the data provided, we examined the Pearson correlation coefficients between all concentrations of a single lectin for each dataset, with the exception of Array 6. We reasoned that if the appropriate binding determinants were present, all concentrations of a particular lectin on a single array platform should give a conserved pattern of relative binding, reflected in fluorescence intensities, that is statistically significant (P < 0.001). Data that failed to meet this threshold indicated problems in the quality of one or more arrays and were therefore excluded from our analysis (Supplementary data, Table S1).
Fig. 3.

Representative images of six glycan arrays for WGA binding. Microarrays are not to scale and, in some cases, are false-colored dependent on the platform. Due to differences in platforms, concentrations of biotinylated WGA used vary: Arrays 1 and 3 (10 μg/mL WGA), Array 2 (100 μg/mL), Array 4 (0.8 μg/mL), Array 5 (1 μg/mL) and Array 6 (5 μg/mL).
Comparison of glycan-binding profiles
In defining the binding of a GBP to its cognate glycans, identifying both the structures bound and their relative affinities is crucial. One major challenge for a cross-platform comparison is selecting an appropriate method for comparing signals on various arrays. One simple approach involves comparing signals from each array at a particular lectin concentration (e.g. 1 µg/mL). Unfortunately, different arrays have different sensitivities such that no single concentration would be suitable for all the various array platforms used in this study. In addition, this approach does not account for the fact that the maximal signal attainable for a given spot can vary depending on the specific glycan (i.e. one glycan may reach saturation at an RFU of 10,000 while another saturates at 60,000). A second strategy would involve assaying lectins at a range of concentrations and calculating apparent Kd values for each glycan that generates suitable signals (Liang et al. 2007). The advantage of this approach is that it provides quantitative or semi-quantitative measures of avidity for comparison across arrays that are independent of absolute signal levels and array sensitivity. The disadvantage is that this approach requires at least three lectin concentrations for a rough estimate of apparent Kd values and 5–10 concentrations for a more accurate calculation. Moreover, one must ensure that the set of lectin concentrations used in the study spans a range that will allow determination of both saturating signal levels and half saturating signals. The optimal set of concentrations is difficult to predict a priori and varies greatly from one array platform to another. Although this was our original intent, we found that this approach was difficult to implement with the data from our cross-platform comparison as many of the datasets did not have sufficient data within an appropriate range. A third strategy would be to use the z-score method of Cholleti et al. (2012). In this method, binding glycans are defined by a z-score (with P-value <0.15), which is calculated with the sum of the fluorescence values for all the concentrations of the glycan structure. We found that this metric, used by the CFG for the larger more diverse Array 1, breaks down when smaller arrays with less diversity are examined. In arrays where a significant number of glycans are bound by a lectin, the statistical difference from the mean of a positive binder may not be significant. Due to the size and diversity differences between the six platforms, z-score-based methods were not suitable for this study. A fourth method would be to have each array group apply their own approach for defining bound glycans (self-reported threshold). This method allows each group to apply the statistical method that is deemed most appropriate for their particular array platform. Although the self-reported threshold method is probably the best to determine binders on each array, we wanted a metric that could be used to examine the data across all arrays to ensure the least biased comparison of the array results.
For a more systematic comparison of results, we developed a universal threshold method. We then compared this with the self-reported thresholding methods used by each group. We excluded Array 6 from this analysis as it contained too few determinants (5 determinants, 20 structures) to apply this method. For the universal threshold, we defined positive binders for each lectin on an array platform as glycans for which the average fluorescence was >10% of the maximum signal observed for that lectin for arrays in the linear range (Figure 4). Arrays in which the maximum fluorescence intensity observed was between 20 and 80% of the highest fluorescence observed for that lectin across all arrays were taken to be in the linear range. This assumes that on the array with the highest maximum (usually the highest concentration tested) the array has reached saturation. In many cases, only one concentration was found to be in the linear range using this criteria. If no array was determined by this method to be in the linear range, the lowest concentration data were used. A detailed example of these calculations for MAL-I from Array 4 is given in Supplementary data.
Fig. 4.

The process of identifying positive binders using the universal threshold.
The universal threshold allowed only the strongest binding determinants to be detected and was insensitive to weak or moderate binders. For example, using the universal threshold only 18 positive binders were identified for Con A on Array 1. However, none of the more complex biantennary glycans, which are known to be ligands of Con A, were observed. In contrast, using the self-reported threshold of Array 1 (z-score method), which includes all concentrations of lectin, 72 glycan structures bound to Con A including several of the expected biantennary glycans (Supplementary data, Table S2). However, the universal threshold provided a comparative metric for identifying the strongest binding events on each platform allowing us an additional unbiased analysis of the datasets.
In general, the binding motifs observed for the lectins across the datasets included in the analysis were those expected based on previous work and the literature (Van Damme et al. 1998; Manimala et al. 2006). The disparities in array size and divergence of determinants on the different platforms make it difficult to quantify the similarities and differences in binding between the arrays. We present a discussion of the glycan binding observed in the five largest arrays, and corresponding data from Array 6, using our universal threshold method. Self-reported threshold data for these lectins is discussed when it sheds light on discrepancies.
Concanavalin A
We excluded the data from Array 2 for Con A based on our quality control (QC) criteria using Pearson correlation (Supplementary data, Table S1). Based on our universal threshold method, agreement between the remaining four large datasets on the nature of the strongest binding determinant was high. All four arrays identified Man3 as one of the top five binders (Table IV; Supplementary data, Table S2). Other high mannose determinants (Man5–Man9) were also identified as strong binders on arrays that contained them. Man3 was the only terminal mannose determinant on Array 4. Beyond high mannose, a simple biantennary N-glycan was observed on Array 1, more complex biantennary glycans were seen on Array 5 and hybrid structures were strong hits on both Arrays 3 and 5. Self-reported structures from Array 1 included more biantennary glycan structures in agreement with the self-reported data from Arrays 3 and 5 (Supplementary data, Table S2).
Table IV.
Top five binders of Con A obtained with the universal threshold for Arrays 1–5 ranked by average (F/MAX × 100%)
| GID | Determinants |
|---|---|
| (a) Array 1 | |
| 214 | Manα1-6(Manα1-3)Manα-Sp9 |
| 212 | Manα1-2Manα1-6(Manα1-3)Manα1-6(Manα1-2Manα1-2Manα1-3)Manβ1-4GlcNAcβ1-4GlcNAcβ-Sp12 |
| 51 | Manα1-6(Manα1-3)Manβ1-4GlcNAcβ1-4GlcNAcβ-Sp13 |
| 216 | Manα1-6(Manα1-3)Manα1-6(Manα1-2Manα1-3)Manβ1-4GlcNAcβ1-4GlcNAcβ-Sp12 |
| 215 | Manα1-2Manα1-2Manα1-6(Manα1-3)Manα-Sp9 |
| (b) Array 3 | |
| 277 | Manα1-6(Manα1-3)Manβ-BSA |
| 270 | Manα1-2Manα1-6(Manα1-3)Manα1-6(Manα1-2Manα1-2Manα1-3)Manβ1-4GlcNAc-β1-4GlcNAc-BSA |
| 269 | Manα1-2Manα1-6(Manα1-3)Manα1-6(Manα1-2Manα1-3)Manβ1-4GlcNAc-β1-4GlcNAc-BSA |
| 268 | Manα1-6(Manα1-3)Manα1-6(Manα1-2Manα1-2Manα1-3)Manβ1-4GlcNAc-β1-4GlcNAc-BSA |
| 265 | Manα1-6(Manα1-3)Manα1-6(Manα1-3)Manβ1-4GlcNAc-β1-4GlcNAc-BSA |
| (c) Array 4 | |
| 24 | Manα1-3(Manα1-6)Man-BSA |
| 3 | Ovalbumin |
| 7 | Glcβ-4AP-BSA |
| 11 | Fucα1-2Galβ1-3GlcNAcβ1-3Galβ1-4Glc-BSA |
| (d) Array 5 | |
| 14 | Manα1-3(Manα1-6)Manα1-6(GlcNAcβ1-2Manα1-3)Manβ1-4GlcNAcβ1-4GlcNAc |
| 6 | Manα1-3(Manα1-6)Manα1-3(Manα1-3(Manα1-6)Man1-6)Manβ1-4GlcNAcβ1-4GlcNAc |
| 3 | Manα1-3(Manα1-6)Manβ1-4GlcNAcβ1-4GlcNAc |
| 4 | Manα1-6(Manα1-3)Manα1-6(Manα1-3)Manβ1-4GlcNAcβ1-4GlcNAc |
| 15 | GlcNAcβ1-2Manα1-3(Manα1-6)Manβ1-4GlcNAcβ1-4GlcNAc |
The terminal mannose trisaccharide is highlighted in grey. Note: Array 5 does not have the trisaccharide alone. GID, glycan ID number.
More divergent data were observed for simpler structures with overall weaker binding, most often observed in the self-reported data. For example, the α-linked mannose monosaccharide was a self-reported binder with Con A on Array 3 but only at high densities of α-mannose (20 glycans/BSA). Mannose was also seen as a binder on Array 6. Binding to the mannose determinant increased with increasing display density, plateauing at tetrameric display of the ligand (Supplementary data, Figure S2). In contrast, no signal was observed on Array 1 for α-mannose with the same lot of Con A. This determinant was not present on Arrays 4 and 5. A second example of divergence in the self-reported data was seen with glucose. Several terminal α-glucose containing determinants were observed as ligands on Array 3, a neoglycoprotein array. Although similar determinants were printed on Array 1, no positive binding was observed. Array 4 did not contain α-glucosides but Con A did bind to a β-glucosyl determinant. Although this binding interaction was not observed in the other neoglycoprotein array (Array 3), which also contained β-glucosyl determinants, it has been seen in other studies and may be due to linker effects (Kilcoyne et al. 2012). Concordant with Array 3, binding to β-glucose was not observed in Array 6, which did not contain the α-glucose determinant. No glucosyl determinants were present on Array 5. Although in both of these cases Array 1 did not observe binding for the same batch of Con A, it is interesting to note that both determinants have been annotated as positive signals on previous versions of Array 1 using other preparations of Con A (Supplementary data).
Helix pomatia agglutinin
We excluded the data from Arrays 2 and 5 based on our QC criteria as before (Supplementary data, Table S1). All three of the remaining datasets identified GalNAcα1-3Gal as the strongest binding motif (Supplementary data, Table S3). In general, determinants bearing terminal α-GalNAc residues, including the monosaccharide (Tn antigen), were observed on all arrays that contained them. Arrays 1 and 3 also found α-GlcNAc residues as a binding determinant for HPA, arguing that the orientation of the 4-position of the terminal sugar is not crucial to glycan binding, in line with work by Sanchez et al. (2006). This determinant was not on the smaller Array 4. Some differences were seen between the platforms. Array 3, observed significant binding to Galβ1-3GalNAcα-structures (TF antigen) that were presented in the context of a peptide (i.e. attached to serine). When it was presented via a non-peptide linker on Array 3 or 1 (which also has the TF antigen), no significant binding was observed. This determinant was not present on Array 4. GalNAcβ- was another determinant observed only in the context of Array 3. Binding to the TF antigen and GalNAcβ- have been observed previously for HPA (Piller et al. 1990; Sanchez et al. 2006). Array 4 found Galβ- as a binding determinant, which was uncorroborated by the other datasets.
Maackia amurensis lectin I
We excluded MAL-I's data from Arrays 2 and 5 based on our QC criteria as before (Supplementary data, Table S1). MAL-I is widely regarded as a binder of terminal Neu5Acα2-3 residues linked to type-2 lactosamine sequences, but MAL-I can also bind 3-O-sulfated lactosamines (Bai et al. 2001; Porter et al. 2010; Geisler and Jarvis 2011). On all of the arrays, the sialylated determinant was observed in the cohort of strongest binders as determined by the universal threshold (Supplementary data, Table S4). Modifications of N-acetylneuraminic acid, including N-glycolyl, the amino variant KDN and the 9-O-acetyl modification, were all tolerated as observed by the arrays containing these determinants. In addition, MAL-I also bound Neu5Acα2-8Neu5Acα2-3Gal containing species. On Array 1, both the 2,3-sialylated and 3-O-sulfated lactosamine sequences were bound by MAL-I. On average, the top five binding sulfated determinants had signals ∼2-fold greater than the signals of the top five binding sialylated determinants on Array 1. The 3-O-sulfated determinant identified in Array 1 was not present on Array 3 or 4. These arrays did contain (3S)Galβ1-4(Fucα1-3/4)GlcNAcβ-, a determinant presents on Array 1 which was not recognized on any of the array formats, indicating that the fucose substitution disrupts lectin binding. This highlights the obvious cautionary point that one can only observe binding to determinants that are present on an array. Binding to some LacNAc determinants was observed on Arrays 3 and 4, but not on Array 1. LacNAc was clearly a weak binder for MAL-I and observation of it on Array 3, where only 3 of 12 LacNAc determinants were positive using the universal threshold and one for the self-reported, and Array 4, where binding was only observed in the self-reported set, is most likely due to either the multivalent presentation of this ligand by the neoglycoproteins or the fact that neither Array 3 nor 4 had the best ligand, lowering the highest level of binding observable, which in turn lowers the threshold.
Sambucus nigra agglutinin
No data were excluded from this analysis, see Supplementary data, Table S1. In all arrays, except for Array 4, structures containing terminal Neu5Acα2-6Galβ- were the top binders for SNA, consistent with the known literature for this lectin (Supplementary data, Table S5). All of the binding glycans from Array 1 contained this motif and KDN, 9-O-acetyl and N-glycolyl variants were also observed. The universal threshold examination of Array 4 found a Neu5Acα2-3Galβ1-4GlcNAc determinant as the top binder, although the α2-6 species were observed in their self-reported data. Although there are three α2-3 determinants on Array 4, only one structure showed binding, arguing that this may be an artifact. However, Array 2 also observed this determinant as a strong binder. Neither Array 1 nor 3 observed any α2-3 sialoside binding.
A variety of other determinants were observed for this lot of SNA by different arrays. Array 3 found terminal GalNAcα/β, Galβ-1-3GalNAc, Galα1-4Gal and Man6 determinants as binders using the universal threshold method. These glycans were listed as weak binders in the self-reported data. Array 4 also reported Galα1-3Galβ1-4GlcNAc as a binder for SNA. A hybrid structure with terminal galactose was observed on Array 5; Array 2 detected binding to a disulfated GalNAc structure. Binding to these determinants might be caused by minor isolectins of SNA contained in this lot of lectin. While SNA-I, which binds terminal Neu5Acα2-6Galβ-, is the major isolectin of SNA; SNA-II, which binds to terminal Gal and GalNAc (La Belle et al. 2007), may also be present and has been observed in SNA preparations (data not shown).
Wheat germ agglutinin
We excluded the data from Array 4 based on our QC criteria as before (Supplementary data, Table S1). WGA is known to strongly bind chitin-type glycans (GlcNAcβ1-4GlcNAc) and has weaker interactions with terminal sialosides (Monsigny et al. 1980; Wright 1992). In all datasets, glycans with terminal β-GlcNAc were observed among the cohort of top binders (Supplementary data, Table S6). Binding to GalNAcβ1-4 determinants was also observed on Arrays 1, 2 and 3; this determinant was not present on Array 5. The binding of WGA to sialylated determinants showed array dependent divergence. Array 1 found predominant binding to Neu5Acα2-6 sialosides. Array 5 also saw binding to these determinants; however, the α2-3 sialosides were not on this array. Array 2, which contained both α2-3 and α2-6 sialic acid determinants, demonstrated binding only to the Neu5Acα2-3 motif. In contrast, Array 3 observed positive binding to a small subset of glycans containing either motif but only with the self-reported threshold.
Effect of presentation on apparent binding
One reason for differences in observed binders is the difference in presentation modes across the arrays. To better quantify variations in binding due to presentation, we studied the agreement between the largest neoglycoprotein array (Array 3) and the largest directly coupled glycan array (Array 1). The two arrays have 80 binding determinants in common (Figure 2), although each can have multiple presentations of that same determinant which may vary in linker structure and glycan density (Supplementary data, Table S7). The Gildersleeve laboratory (Array 3) received 42 compounds from the CFG (Array 1) and coupled these to BSA, for these compounds, the glycan determinant and a portion of the linker are identical. We quantified the overlap between the two arrays as follows: For each lectin, we determined the number of compounds on each array that met either the universal or self-reported threshold and were between the 80 common determinants. If one or more structures containing the common determinants were positive on both arrays, we considered it a positive match (positive). If they were negative on both arrays, we considered it a negative match (negative) and if the data were divergent (i.e. one or more positive on one array, all negative on the other) we considered it a mismatch (Table V). For example, when the universal threshold was applied for HPA, 7 of the 80 shared determinants were bound on both arrays, 71 shared determinants showed no binding to HPA on either array, and two determinants were only positive on Array 3.
Table V.
Number of positive (Pos.), negative (Neg.) or mismatched (Mis.) determinants seen between Arrays 1 and 3
| Lectin | Universal threshold |
Self-reported |
||||
|---|---|---|---|---|---|---|
| Pos. | Neg. | Mis.a | Pos. | Neg. | Mis. | |
| Con A | 0 | 80 | 0 | 0 | 77 | 3 |
| HPA | 7 | 71 | 2 | 7 | 67 | 6 |
| MAL-I | 7 | 67 | 6 | 8 | 68 | 4 |
| SNA | 4 | 71 | 5 | 4 | 71 | 5 |
| WGA | 2 | 77 | 1 | 2 | 61 | 17 |
All numbers are out of 80 total shared determinants.
aIn each case, the mismatch was positive on Array 3 using the universal threshold. The two HPA mismatches were self-reported as “strong binders” by Gildersleeve. Of the six MAL-I mismatches, four were listed as “medium” binders and two were listed as “non-binders” by Gildersleeve. All five SNA mismatches were listed as “weak binders” by Gildersleeve. The one WGA mismatch was self-reported as a “medium binder” by Gildersleeve.
In general, we found good concordance between the datasets using the universal threshold method (i.e. the vast majority of glycans were either positive on both arrays or negative on both arrays). Nevertheless, some mismatches were observed, mainly with shorter glycan or monosaccharide determinants. The majority of these were positive binders found on Array 3, but not on Array 1. Upon further analysis, several factors may contribute to the mismatches. First, Array 3 tended to produce more positive signals with monosaccharides. For example, GlcNAc-β monosaccharide was bound by WGA on Array 3 but not Array 1. Second, there were a number of mismatch cases where Array 1 showed some positive binding, but the signal was not strong enough to satisfy the criteria for the universal threshold. For example, 3′SLacNAc (Neu5Acα2-3Galβ1-4GlcNAcβ-) was bound by MAL-I on Array 3 but did not meet the threshold on Array 1 using the universal threshold method. However, it was observed as a binding glycan using the self-reported method. Differences in glycan density could account for the apparently stronger binding to determinants on Array 3. For example, GD2 (Neu5Acα2-8Neu5Acα2-3(GalNAcβ1-4)Galβ1-4Glcβ-) was positive with HPA on Array 3 when displayed at a conjugation ratio of 10 per BSA; however, it was negative at a ratio of 4 per BSA. Therefore, the higher density variant was a mismatch, whereas the lower density variant was in agreement. Since the CFG provided GD2 for printing on Array 3, the difference in HPA binding is more consistent with a density dependent effect than a linker effect. It should be noted that the methodology used to assign glycans as positive or negative had a substantial impact on the results. In particular, there were more mismatches between arrays when using the self-reported methods, as different criteria were used by different groups to threshold positives and these methods yielded more positive binders overall than the more stringent metric applied in this work.
Glycan density was a factor for all the arrays, as exemplified by the interaction between the monosaccharide β-GlcNAc and the dimeric lectin WGA (Nagata and Burger 1974). This specific molecule was present on 4 of 5 arrays that passed QC for this lectin. However, binding to β-GlcNAc by this specific lot of WGA was seen on only 2 of these arrays. Binding of WGA to the simple monosaccharide was not observed on either Array 1 or 2, which present the determinant conjugated directly to the SCHOTT Nexterion H® surface. In contrast, β-GlcNAc densely presented on a neoglycoprotein array (Array 3, n = 21 GlcNAc residues/protein) was easily observable. Array 6, in which the monosaccharide GlcNAc was attached to a maleimide slide surface (PamChip®) as a monomer or as a series of localized dendrimeric structures showed differential binding based on the presentation mode. The monomeric GlcNAc, which most closely mimics Array 1 and 2 presentations, showed little binding. In contrast, dimeric presentation of the GlcNAc determinant shows a binding pattern that is identical to tetrameric and octameric variants (Figure 5). This suggests that presenting different densities of glycans may be important in examining glycan binding. Such presentations may enable multiple binding pockets to be engaged or may contribute to altered off-rates, as has been seen in mucin binding where surface constrained glycan presentation occurs (Dam and Brewer 2008; Parera Pera et al. 2010).
Fig. 5.
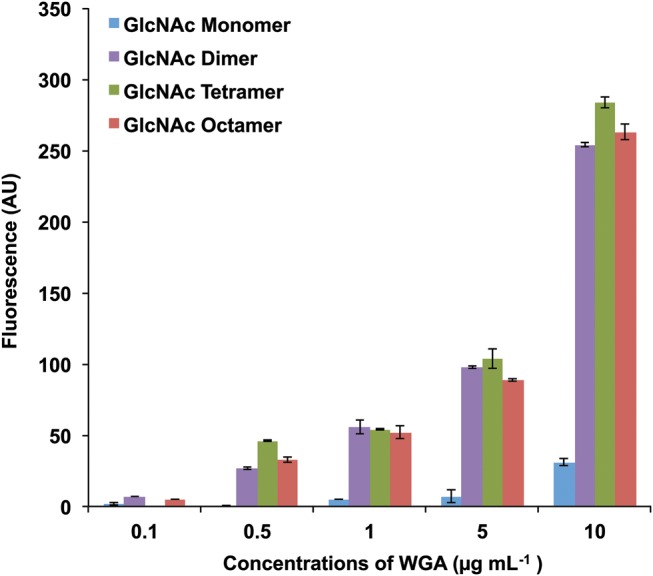
Binding profile of WGA on Array 6.
Conclusions
Glycan microarrays are a powerful tool to rapidly explore the binding specificities of GBPs. They provide a critical initial evaluation of binding specificity without the bias inherent in other technologies such as surface plasmon resonance (SPR), frontal affinity chromatography (FAC) or isothermal calorimetry (ITC), which require preliminary knowledge of GBP specificity. This technology is important for the discovery of physiological ligands of GBPs, allowing the rapid development of hypothesis about glycan-binding partners, which can be further validated using these other, more specialized techniques. In this study, we sought to examine whether differences in analytical platforms across laboratories had a significant effect on reported GBP profiles from glycan microarrays. Datasets from six glycan array research groups for five well-characterized lectins were obtained and analyzed. We anticipate that this rich collection of data will be valuable to other groups as they seek to create universal annotation methods and standards across platforms in the community. In our comparison, we draw several conclusions from this work. First, in general the strongest binding determinants were observed for these five lectins as long as the epitope was present. This finding validates the utility of these arrays in identifying the main epitopes recognized by GBPs, showcasing the power of this technology to rapidly identify binders for unknown GBPs. Second, the method by which positive signals are assigned on an array (i.e. thresholding) can have significant effects on interpretation of results for moderate and weaker binders. Case in point, our universal threshold method did not annotate potentially important weaker binding interactions on the arrays. For example, this metric overlooked the majority of biantennary glycan structures as binders for Con A. In contrast, self-reported thresholds were generally more sensitive but these were tied to the system analyzed (see Supplementary data). Annotation of the datasets using array-specific metrics, such as the z-score analysis-based methodology used by Array 1 (Cholleti et al. 2012) generally captured more binders, pushing the threshold to lower affinity ligands. Variability between microarray platforms was highest using the self-reported threshold presumably due to the detection of these weaker binding events, which may be more dependent on glycan presentation.
A third conclusion is that presentation of determinants on the array matters most for weaker binding interactions, which may still be physiologically relevant. The effect of presentation on glycan binding is a well-studied phenomenon (Brewer et al. 2002). GBPs, such as plant and mammalian lectins or antibodies, exhibit multivalent binding towards multivalent molecules (avidity), which can lead to observed binding affinities that are relatively high. In nature, avidity occurs both at the level of the GBP (i.e. multimeric lectins) and at the level of glycan presentation on the cell surface. Thus, it is not surprising that on the surface of a microarray how a glycan is presented to the GBP, the relative density, the local glycan packing and even the linker (which can affect packing) can alter what is observed (Stallforth et al. 2008; Godula and Bertozzi 2012; Kilcoyne et al. 2012). The effect of local ligand spacing is most clearly seen in this work in the comparison of the response of WGA to varying presentations of a monosaccharide, β-GlcNAc. No binding was observed for either monomeric β-GlcNAc (Array 6) or on the directly coupled arrays of Arrays 1 and 2, where spacing was dictated by the density of NHS-esters on the slide. In contrast, dendrimerized β-GlcNAc (Array 6, n = 2 or more) or β-GlcNAc presented on a densely conjugated neoglycoprotein showed clear binding to this glycan, arguing that for weaker determinants, presentation or local concentration plays a key role.
Our analysis reveals several important considerations in the use of glycan microarrays as a tool for determining GBP specificities. First, diversity is a critical factor in determining binding specificity. A clear example of this is seen in the identification of sulfation, rather than sialylation, as the strongest binding determinant for MAL-I. To get the most accurate preliminary identification of GBP specificity requires an array that covers a significant portion of the glycome. Expanding glycan microarrays to cover the mammalian glycome is an enormous undertaking. At present, it is estimated that there are a minimum of 3000 glycan determinants in the mammalian glycome alone (glycosaminoglycans excluded) (Cummings 2009). By comparison, the largest array to date (Array 1) has only 611 structures, some of which are replicates with different linkers. Overcoming the synthetic challenge of covering the glycome will require a concerted effort by the glyco-community.
A second consideration is that identifying strong binders using arrays does not guarantee that it is the best or the physiological ligand, and these two may not be synonymous. Conclusions regarding physiological relevance will always require independent biological validation. A third consideration is the presentation of ligands. This can have a profound effect on binding and diversification of glycan presentation in array platforms is another challenge for the community. Inter-ligand spacing in three dimensions is a critical factor in glycan recognition where varying the presentation of even a simple determinant can have profound consequences (Oyelaran et al. 2009; Godula and Bertozzi 2012; Grant et al. 2014). On the cell surface, there is a three-dimensional architecture to glycan presentation on proteins or lipids, which is then clustered in two dimensions by its confinement on the lipid bilayer. How this maps onto recognition of glycans by human immune lectins, bacterial adhesins, viral lectins and other important GBPs is still not well understood. This is complicated by the fact that even weak interactions, such as those between glycolipids on opposing cell membranes, can have profound biological effects due to avidity (Hakomori 2010). Teasing apart physiological interactions is thus a complicated endeavor in which microarrays can provide a crucial starting point. Arrays that use lipid architectures (Fukui et al. 2002), vary presentation densities (Houseman and Mrksich 2002; Ngundi et al. 2006; Chevolot et al. 2007; Liang et al. 2007; Mercey et al. 2008; Song et al. 2008; Oyelaran et al. 2009; Tian et al. 2012) and alter inter-ligand spacing (Zhang, Campbell, et al. 2010; Zhang, Li, et al. 2010; Godula and Bertozzi 2012; Narla and Sun 2012) are beginning to untangle these higher order questions about glycan binding. More work is needed to create specific two and three-dimensional presentations that mimic cell surfaces including fluidity to gain greater insights into glycan-binding mechanisms. The utility of specific glycan microarrays will be dependent on the nature of the GBP to be examined and the question to be asked. In some cases, multiple microarray platforms may be required to obtain the best understanding of glycan binding in a system and much microarray development remains to get a comprehensive view of GBP specificity.
Supplementary data
Supplementary data for this article are available online at http://glycob.oxfordjournals.org/.
Funding
R.D.C. and D.F.S.: The Protein-Glycan Interaction Resource (Core H) of the Consortium for Functional Glycomics is supported by NIH Grants GM62116 GM098791 and the National Center for Functional Glycomics P41-GM103694. J.C.G.: This work was supported in part by the intramural research program of the National Cancer Institute, National Institutes of Health and the Consortium for Functional Glycomics (GM62116; The Scripps Research Institute). C.T.C. received fellowship support through the Pharmacology Research Associate Training (PRAT) program of the NIGMS. L.J.: This work was supported by Science Foundation Ireland (grant 08/SRC/B1393) in support of the Alimentary Glycoscience Research Cluster (AGRC) and the European Union FP7 program (grant 260600) in support of GlycoHIT. N.C.R.: This work was supported by Ministerio de Ciencia e Innovación, projects CTQ2008-04444/BQA and CTQ2011-27874, Government of the Basque Country, Etortek grant and the European Union, ITN-EuroGlycoArrays grant is gratefully acknowledged. R.J.P.: This work was supported by the Dutch Technology Foundation STW, applied science division of NWO and the Technology Program of the Ministry of Economic Affairs. L.K.M.: This work was supported by the National Institutes of Health Grant No. 5 U54 GM062116-09. L.W. was supported by a MacCracken Fellowship (NYU).
Conflict of interest
None declared.
Abbreviations
BSA, bovine serum albumin; Con A, Concanavalin A; FAC, frontal affinity chromatography; GBPs, glycan-binding proteins; HPA, Helix pomatia agglutinin; ITC, isothermal calorimetry; MAL-I, Maackia amurensis lectin I; QC, quality control; SNA, Sambucus nigra agglutinin; SPR, surface plasmon resonance; WGA, wheat germ agglutinin.
Supplementary Material
Acknowledgments
The authors thank Boval Biosolutions, LLC (Cleburne, Texas) for the lyophilized, protease and IgG free bovine serum albumin used in this study (Part no. LY-0081). Professor Tom Tolbert (University of Kansas), Professor Lai-Xi Wang (University of Maryland) and Dr. Joseph Barchi (National Cancer Institute) for contributing glycans for Array 3. Dr. Marian Kane (NUI Galway) for critical reading and feedback.
References
- Bai X, Brown JR, Varki A, Esko JD. Enhanced 3-O-sulfation of galactose in Asn-linked glycans and Maackia amurensis lectin binding in a new Chinese hamster ovary cell line. Glycobiology. 2001;11:621–632. doi: 10.1093/glycob/11.8.621. [DOI] [PubMed] [Google Scholar]
- Blixt O, Head S, Mondala T, Scanlan C, Huflejt ME, Alvarez R, Bryan MC, Fazio F, Calarese D, Stevens J. Printed covalent glycan array for ligand profiling of diverse glycan binding proteins. Proc Natl Acad Sci USA. 2004;101:17033–17038. doi: 10.1073/pnas.0407902101. [DOI] [PMC free article] [PubMed] [Google Scholar]
- Branderhorst HM, Ruijtenbeek R, Liskamp RM, Pieters RJ. Multivalent carbohydrate recognition on a glycodendrimer-functionalized flow-through chip. ChemBioChem. 2008;9:1836–1844. doi: 10.1002/cbic.200800195. [DOI] [PubMed] [Google Scholar]
- Brewer C, Miceli M, Baum L. Clusters, bundles, arrays and lattices: Novel mechanisms for lectin-saccharide-mediated cellular interactions. Curr Opin Struct Biol. 2002;12:616–623. doi: 10.1016/s0959-440x(02)00364-0. [DOI] [PubMed] [Google Scholar]
- Chevolot Y, Bouillon C, Vidal S, Morvan F, Meyer A, Cloarec JP, Jochum A, Praly JP, Vasseur JJ, Souteyrand E. DNA-based carbohydrate biochips: A platform for surface glyco-engineering. Angew Chem. 2007;46:2398–2402. doi: 10.1002/anie.200604955. [DOI] [PubMed] [Google Scholar]
- Cholleti SR, Agravat S, Morris T, Saltz JH, Song X, Cummings RD, Smith DF. Automated motif discovery from glycan array data. OMICS. 2012;16:497–512. doi: 10.1089/omi.2012.0013. [DOI] [PMC free article] [PubMed] [Google Scholar]
- Cummings RD. The repertoire of glycan determinants in the human glycome. Mol BioSyst. 2009;5:1087–1104. doi: 10.1039/b907931a. [DOI] [PubMed] [Google Scholar]
- Dam T, Brewer C. Effects of clustered epitopes in multivalent ligand-receptor interactions. Biochemistry. 2008;47:8470–8476. doi: 10.1021/bi801208b. [DOI] [PubMed] [Google Scholar]
- Fukui S, Feizi T, Galustian C, Lawson AM, Chai W. Oligosaccharide microarrays for high-throughput detection and specificity assignments of carbohydrate-protein interactions. Nat Biotechnol. 2002;20:1011–1017. doi: 10.1038/nbt735. [DOI] [PubMed] [Google Scholar]
- Geisler C, Jarvis DL. Effective glycoanalysis with Maackia amurensis lectins requires a clear understanding of their binding specificities. Glycobiology. 2011;21:988–993. doi: 10.1093/glycob/cwr080. [DOI] [PMC free article] [PubMed] [Google Scholar]
- Godula K, Bertozzi CR. Density variant glycan microarray for evaluating cross-linking of mucin-like glycoconjugates by lectins. J Am Chem Soc. 2012;134:15732–15742. doi: 10.1021/ja302193u. [DOI] [PMC free article] [PubMed] [Google Scholar]
- Grant OC, Smith HM, Firsova D, Fadda E, Woods RJ. Presentation, presentation, presentation! Molecular-level insight into linker effects on glycan array screening data. Glycobiology. 2014;24:17–25. doi: 10.1093/glycob/cwt083. [DOI] [PMC free article] [PubMed] [Google Scholar]
- Hakomori SI. Glycosynaptic microdomains controlling tumor cell phenotype through alteration of cell growth, adhesion, and motility. FEBS Lett. 2010;584:1901–1906. doi: 10.1016/j.febslet.2009.10.065. [DOI] [PMC free article] [PubMed] [Google Scholar]
- Heimburg-Molinaro J, Song X, Smith DF, Cummings RD. Preparation and analysis of glycan microarrays. Curr Protoc Protein Sci. 2011 doi: 10.1002/0471140864.ps1210s64. Chapter 12:Unit12.10. [DOI] [PMC free article] [PubMed] [Google Scholar]
- Heimburg-Molinaro J, Tappert M, Song X, Lasanajak Y, Air G, Smith DF, Cummings RD. Probing virus–glycan interactions using glycan microarrays. In: Chevolot Y, editor. Carbohydrate microarrays. Humana Press; 2012. pp. 251–267. [DOI] [PMC free article] [PubMed] [Google Scholar]
- Houseman BT, Mrksich M. Carbohydrate arrays for the evaluation of protein binding and enzymatic modification. Chem Biol. 2002;9:443–454. doi: 10.1016/s1074-5521(02)00124-2. [DOI] [PubMed] [Google Scholar]
- Kilcoyne M, Gerlach JQ, Kane M, Joshi L. Surface chemistry and linker effects on lectin-carbohydrate recognition for glycan microarrays. Anal Methods. 2012;4:2721–2728. [Google Scholar]
- Kuno A, Uchiyama N, Koseki-Kuno S, Ebe Y, Takashima S, Yamada M, Hirabayashi J. Evanescent-field fluorescence-assisted lectin microarray: A new strategy for glycan profiling. Nat Methods. 2005;2:851–856. doi: 10.1038/nmeth803. [DOI] [PubMed] [Google Scholar]
- La Belle JT, Gerlach JQ, Svarovsky S, Joshi L. Label-free impedimetric detection of glycan-lectin interactions. Anal Chem. 2007;79:6959–6964. doi: 10.1021/ac070651e. [DOI] [PubMed] [Google Scholar]
- Lanctot PM, Gage FH, Varki AP. The glycans of stem cells. Curr Opin Chem Biol. 2007;11:373–380. doi: 10.1016/j.cbpa.2007.05.032. [DOI] [PMC free article] [PubMed] [Google Scholar]
- Liang PH, Wang SK, Wong CH. Quantitative analysis of carbohydrate-protein interactions using glycan microarrays: Determination of surface and solution dissociation constants. J Am Chem Soc. 2007;129:11177–11184. doi: 10.1021/ja072931h. [DOI] [PubMed] [Google Scholar]
- Liu Y, Palma AS, Feizi T. Carbohydrate microarrays: Key developments in glycobiology. Biol Chem. 2009;390:647–656. doi: 10.1515/BC.2009.071. [DOI] [PubMed] [Google Scholar]
- Manimala JC, Roach TA, Li Z, Gildersleeve JC. High-Throughput Carbohydrate Microarray Analysis of 24 Lectins. Angew Chem Int Ed Engl. 2006;45:3607–3610. doi: 10.1002/anie.200600591. [DOI] [PubMed] [Google Scholar]
- Mercey E, Sadir R, Maillart E, Roget A, Baleux F, Lortat-Jacob H, Livache T. Polypyrrole oligosaccharide array and surface plasmon resonance imaging for the measurement of glycosaminoglycan binding interactions. Anal Chem. 2008;80:3476–3482. doi: 10.1021/ac800226k. [DOI] [PubMed] [Google Scholar]
- Monsigny M, Roche AC, Sene C, Maget-Dana R, Delmotte F. Sugar-lectin interactions: How does wheat-germ agglutinin bind sialoglycoconjugates? Eur J Biochem. 1980;104:147–153. doi: 10.1111/j.1432-1033.1980.tb04410.x. [DOI] [PubMed] [Google Scholar]
- Nagata Y, Burger MM. Wheat germ agglutinin. Molecular characteristics and specificity for sugar binding. J Biol Chem. 1974;249:3116–3122. [PubMed] [Google Scholar]
- Narla SN, Sun XL. Glyco-macroligand microarray with controlled orientation and glycan density. Lab Chip. 2012;12:1656–1663. doi: 10.1039/c2lc21224b. [DOI] [PubMed] [Google Scholar]
- Ngundi MM, Taitt CR, McMurry SA, Kahne D, Ligler FS. Detection of bacterial toxins with monosaccharide arrays. Biosens Bioelectron. 2006;21:1195–1201. doi: 10.1016/j.bios.2005.05.001. [DOI] [PMC free article] [PubMed] [Google Scholar]
- Oyelaran O, Li Q, Farnsworth D, Gildersleeve JC. Microarrays with varying carbohydrate density reveal distinct subpopulations of serum antibodies. J Proteome Res. 2009;8:3529–3538. doi: 10.1021/pr9002245. [DOI] [PMC free article] [PubMed] [Google Scholar]
- Padler-Karavani V, Song X, Yu H, Hurtado-Ziola N, Huang S, Muthana S, Chokhawala HA, Cheng J, Verhagen A, Langereis MA, et al. Cross-comparison of protein recognition of sialic acid diversity on two novel sialoglycan microarrays. J Biol Chem. 2012;287:22593–22608. doi: 10.1074/jbc.M112.359323. [DOI] [PMC free article] [PubMed] [Google Scholar]
- Parera Pera N, Branderhorst HM, Kooij R, Maierhofer C, van der Kaaden M, Liskamp RM, Wittmann V, Ruijtenbeek R, Pieters RJ. Rapid screening of lectins for multivalency effects with a glycodendrimer microarray. ChemBioChem. 2010;11:1896–1904. doi: 10.1002/cbic.201000340. [DOI] [PubMed] [Google Scholar]
- Park S, Gildersleeve JC, Blixt O, Shin I. Carbohydrate microarrays. Chem Soc Rev. 2013;42:4310–4326. doi: 10.1039/c2cs35401b. [DOI] [PMC free article] [PubMed] [Google Scholar]
- Piller V, Piller F, Cartron JP. Comparison of the carbohydrate-binding specificities of seven N-acetyl-D-galactosamine-recognizing lectins. Eur J Biochem. 1990;191:461–466. doi: 10.1111/j.1432-1033.1990.tb19144.x. [DOI] [PubMed] [Google Scholar]
- Pilobello KT, Krishnamoorthy L, Slawek D, Mahal LK. Development of a lectin microarray for the rapid analysis of protein glycopatterns. ChemBioChem. 2005;6:985–989. doi: 10.1002/cbic.200400403. [DOI] [PubMed] [Google Scholar]
- Pilobello KT, Slawek DE, Mahal LK. A ratiometric lectin microarray approach to analysis of the dynamic mammalian glycome. Proc Natl Acad Sci USA. 2007;104:11534–11539. doi: 10.1073/pnas.0704954104. [DOI] [PMC free article] [PubMed] [Google Scholar]
- Porter A, Yue T, Heeringa L, Day S, Suh E, Haab B. A motif-based analysis of glycan array data to determine the specificities of glycan-binding proteins. Glycobiology. 2010;20:369–380. doi: 10.1093/glycob/cwp187. [DOI] [PMC free article] [PubMed] [Google Scholar]
- Rillahan CD, Paulson JC. Glycan microarrays for decoding the glycome. Annu Rev Biochem. 2011;80:797–823. doi: 10.1146/annurev-biochem-061809-152236. [DOI] [PMC free article] [PubMed] [Google Scholar]
- Sanchez JF, Lescar J, Chazalet V, Audfray A, Gagnon J, Alvarez R, Breton C, Imberty A, Mitchell EP. Biochemical and structural analysis of Helix pomatia agglutinin. A hexameric lectin with a novel fold. J Biol Chem. 2006;281:20171–20180. doi: 10.1074/jbc.M603452200. [DOI] [PubMed] [Google Scholar]
- Serna S, Etxebarria J, Ruiz N, Martin-Lomas M, Reichardt NC. Construction of N-glycan microarrays by using modular synthesis and on-chip nanoscale enzymatic glycosylation. Chem. Eur. J. 2010;16:13163–13175. doi: 10.1002/chem.201001295. [DOI] [PubMed] [Google Scholar]
- Smith DF, Song X, Cummings RD. Use of glycan microarrays to explore specificity of glycan-binding proteins. Methods Enzymol. 2010;480:417–444. doi: 10.1016/S0076-6879(10)80033-3. [DOI] [PubMed] [Google Scholar]
- Song X, Xia B, Lasanajak Y, Smith DF, Cummings RD. Quantifiable fluorescent glycan microarrays. Glycoconj J. 2008;25:15–25. doi: 10.1007/s10719-007-9066-8. [DOI] [PubMed] [Google Scholar]
- Stallforth P, Adibekian A, Seeberger PH. De novo synthesis of a D-galacturonic acid thioglycoside as key to the total synthesis of a glycosphingolipid from Sphingomonas yanoikuyae. Org Lett. 2008;10:1573–1576. doi: 10.1021/ol800227b. [DOI] [PubMed] [Google Scholar]
- Stowell SR, Arthur CM, Dias-Baruffi M, Rodrigues LC, Gourdine JP, Heimburg-Molinaro J, Ju T, Molinaro RJ, Rivera-Marrero C, Xia B, et al. Innate immune lectins kill bacteria expressing blood group antigen. Nat Med. 2010;16:295–301. doi: 10.1038/nm.2103. [DOI] [PMC free article] [PubMed] [Google Scholar]
- Stowell SR, Arthur CM, Mehta P, Slanina KA, Blixt O, Leffler H, Smith DF, Cummings RD. Galectin-1, -2, and -3 exhibit differential recognition of sialylated glycans and blood group antigens. J Biol Chem. 2008;283:10109–10123. doi: 10.1074/jbc.M709545200. [DOI] [PMC free article] [PubMed] [Google Scholar]
- Tian X, Pai J, Shin I. Analysis of density-dependent binding of glycans by lectins using carbohydrate microarrays. Chem Asian J. 2012;7:2052–2060. doi: 10.1002/asia.201200202. [DOI] [PubMed] [Google Scholar]
- Unverzagt C, Andre S, Seifert J, Kojima S, Fink C, Srikrishna G, Freeze H, Kayser K, Gabius HJ. Structure-activity profiles of complex biantennary glycans with core fucosylation and with/without additional α2,3/α2,6 sialylation: Synthesis of neoglycoproteins and their properties in lectin assays, cell binding, and organ uptake. J Med Chem. 2002;45:478–491. doi: 10.1021/jm0110237. [DOI] [PubMed] [Google Scholar]
- Van Damme EJM, Peumans W, Pusztai A, Bardocz S. Handbook of plant lectins: properties and biomedical applications. New York: John Wiley and Sons; 1998. [Google Scholar]
- Varki A, Cummings RD, Esko JD, Freeze HH, Stanley P, Bertozzi CR, Hart GW, Etzler ME. Essentials of glycobiology. 2nd ed. Cold Spring Harbor: Cold Spring Harbor Laboratory Press; 2009. Chapter 26. Available from http://www.ncbi.nlm.nih.gov/books/NBK1923/ [PubMed] [Google Scholar]
- Vuskovic MI, Xu H, Bovin NV, Pass HI, Huflejt ME. Processing and analysis of serum antibody binding signals from printed glycan arrays for diagnostic and prognostic applications. Int J Bioinform Res Appl. 2011;7:402–426. doi: 10.1504/IJBRA.2011.043771. [DOI] [PubMed] [Google Scholar]
- Wada Y, Azadi P, Costello C, Dell A, Dwek R, Geyer H, Geyer R, Kakehi K, Karlsson N, Kato K. Comparison of the methods for profiling glycoprotein glycans--HUPO Human Disease Glycomics/Proteome Initiative multi-institutional study. Glycobiology. 2007;17:411–422. doi: 10.1093/glycob/cwl086. [DOI] [PubMed] [Google Scholar]
- Wright CS. Crystal structure of a wheat germ agglutinin/glycophorin-sialoglycopeptide receptor complex. Structural basis for cooperative lectin-cell binding. J Biol Chem. 1992;267:14345–14352. [PubMed] [Google Scholar]
- Zhang Y, Campbell C, Li Q, Gildersleeve JC. Multidimensional glycan arrays for enhanced antibody profiling. Mol BioSyst. 2010;6:1583–1591. doi: 10.1039/c002259d. [DOI] [PMC free article] [PubMed] [Google Scholar]
- Zhang Y, Gildersleeve JC. General procedure for the synthesis of neoglycoproteins and immobilization on epoxide-modified glass slides. Methods Mol. Biol. 2012;808:155–165. doi: 10.1007/978-1-61779-373-8_11. [DOI] [PMC free article] [PubMed] [Google Scholar]
- Zhang Y, Li Q, Rodriguez LG, Gildersleeve JC. An array-based method to identify multivalent inhibitors. J Am Chem Soc. 2010;132:9653–9662. doi: 10.1021/ja100608w. [DOI] [PMC free article] [PubMed] [Google Scholar]
- Zhi ZL, Laurent N, Powell AK, Karamanska R, Fais M, Voglmeir J, Wright A, Blackburn JM, Crocker PR, Russell DA, et al. A versatile gold surface approach for fabrication and interrogation of glycoarrays. ChemBioChem. 2008;9:1568–1575. doi: 10.1002/cbic.200700788. [DOI] [PubMed] [Google Scholar]
Associated Data
This section collects any data citations, data availability statements, or supplementary materials included in this article.