Abstract
Hypertrophy is central to several heart diseases; however, not much is known about the role of glycosphingolipids (GSLs) in this phenotype. Since GSLs have been accorded several physiological functions, we sought to determine whether these compounds affect cardiac hypertrophy. By using a rat cardiomyoblast cell line, H9c2 cells and cultured primary neonatal rat cardiomyocytes, we have determined the effects of GSLs on hypertrophy. Our study comprises (a) measurement of [3H]-leucine incorporation into protein, (b) measurement of cell size and morphology by immunofluorescence microscopy and (c) real-time quantitative mRNA expression assay for atrial natriuretic peptide and brain natriuretic peptide. Phenylephrine (PE), a well-established agonist of cardiac hypertrophy, served as a positive control in these studies. Subsequently, mechanistic studies were performed to explore the involvement of various signaling transduction pathways that may contribute to hypertrophy in these cardiomyocytes. We observed that lactosylceramide specifically exerted a concentration- (50–100 µM) and time (48 h)-dependent increase in hypertrophy in cardiomyocytes but not a library of other structurally related GSLs. Further, in cardiomyocytes, LacCer generated reactive oxygen species, stimulated the phosphorylation of p44 mitogen activated protein kinase and protein kinase-C, and enhanced c-jun and c-fos expression, ultimately leading to hypertrophy. In summary, we report here that LacCer specifically induces hypertrophy in cardiomyocytes via an “oxygen-sensitive signal transduction pathway.”
Keywords: cardiac hypertrophy, glycosphingolipids, lactosylceramide
Introduction
Hypertrophic cardiomyopathy is a pathologic hypertrophy of the heart due to an increase in the size of myocytes in various heart diseases including long-term hypertension, myocardial infarction, chronic pressure overload, valvular defects and endocrine disorders (Sandler and Dodge 1963; Hood et al. 1968; Grossman et al. 1975; Frey et al. 2004). Myocardial hypertrophy is an adaptive response of the heart to increased workload. However, increased myocyte size, increased left ventricular (LV) mass and decreased fractional shortening (FS) are risk factors of cardiac morbidity and mortality in the general population (Lorell and Carabello 2000; Baumgartner et al. 2007; Movahed and Saito 2009). Previous studies have demonstrated that dyslipidemia, hypercholesterolemia and cardiac lipotoxicity are associated with cardiac hypertrophy (Unger and Orci 2001; Semeniuk et al. 2002; Berger et al. 2005; Borradaile and Schaffer 2005; Poornima et al. 2006; Lopaschuk et al. 2007; Yang and Barouch 2007; Balakumar et al. 2011; Smith and Yellon 2011).
Recently, we have observed that feeding a high fat and cholesterol diet to apoE−/− mice results in marked increase in the level of GSL, e.g. glucosylceramide (GlcCer) and LacCer in heart tissue accompanied by an increase in the activity of glycosphingolipid (GSL) glycosyltransferases (GTs) (Chatterjee et al. 2013) (submitted for publication). The association of marked atherosclerosis and cardiac hypertrophy with these biochemical changes has been confirmed by physiologic studies (LV mass, FS) and up-regulation of genes for brain natriuretic peptide (BNP), atrial natriuretic peptide (ANP) and alpha skeletal actin—all are well-known markers of cardiac hypertrophy (McConnell et al. 1999; Shimoyama et al. 1999; Frey et al. 2004; LaPointe 2005; Takimoto et al. 2005; Zhong et al. 2010). Treatment of mice with d-threo-1-phenyl-2-decanoylamino-3-morpholino-1-propanol (d-PDMP), an inhibitor of GSL synthesis, not only reversed atherosclerosis but also markedly reduced cardiac hypertrophy (Chatterjee et al. 2013) (submitted for publication). Regression in LV mass is known to be accompanied by reduced cardiovascular complications during hypertrophy (Mathew et al. 2001; Dahlof et al. 2002; Devereux et al. 2004). Hence, decreasing GSL load in the myocardium seemed to reverse LV mass which is widely accepted as a desirable treatment goal in cardiovascular diseases. However, these studies conducted in experimental animal models could not establish clearly whether one or more GSLs take part in cardiac hypertrophy. Herein, using cultured cardiomyocytes, we demonstrate that LacCer specifically induces cardiac hypertrophy by way of generating reactive oxygen species (ROS) to transduce a signal transduction pathway leading to this phenotype.
Results
LacCer, but not other GSLs, increase [3H]-leucine incorporation in H9c2 cells
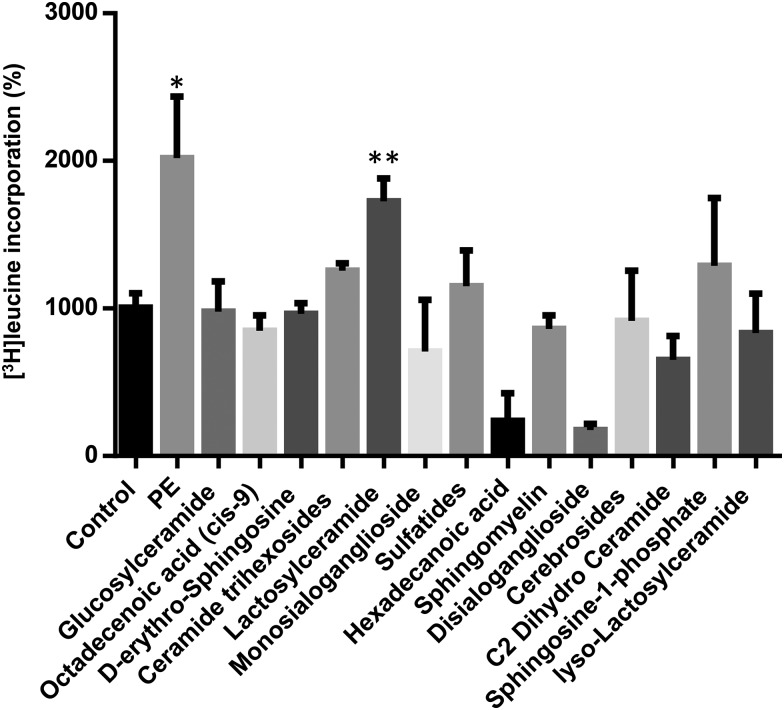
The incorporation of [3H]-leucine into cell protein has been one method used widely to determine the rate of protein synthesis. Among all different glycolipids, LacCer specifically stimulated protein synthesis (2-fold) to a similar extent as phenylephrine (PE) in these cells (Figure 1). In contrast, the other classes of GSL. e.g. sulfatides, complex gangliosides and other neutral GSLs, failed to increase protein synthesis in these cardiomyocytes, respectively.
Fig. 1.
LacCer significantly upregulated [3H]-leucine incorporation in H9c2 cells: H9c2 cells were plated (105 per well) in 24-well plates and allowed to proliferate in growth medium composed of DMEM supplemented with 10% fetal bovine serum. When cells had reached near confluence, growth medium was replaced with differentiation medium (DMEM containing 2% horse serum) for 48 h to induce differentiation of H9c2 myoblasts into myotubes. Cells were then stimulated for 48 h with a single dose of 100 µM PE and different glycolipids (as shown above, 100 µM each). [3H]-Leucine (5 Ci or 142 Ci/mmol) was included per well. At the end of the incubation period, cells were washed twice in PBS and proteins were subsequently precipitated with ice-cold 10% trichloroacetic acid. After dissolving the precipitates in 0.5 mol/L NaOH, 5 mL scintillation cocktail was added, and radioactivity was measured by liquid scintillation spectroscopy. [3H]-Leucine incorporation experiments were repeated five times with triplicate measurements for each experiment. LacCer upregulated protein synthesis in H9c2 cells significantly. *P < 0.003, **P < 0.004 vs control.
LacCer dose and time dependently increases protein synthesis and DNA synthesis/proliferation in cardiomyocytes
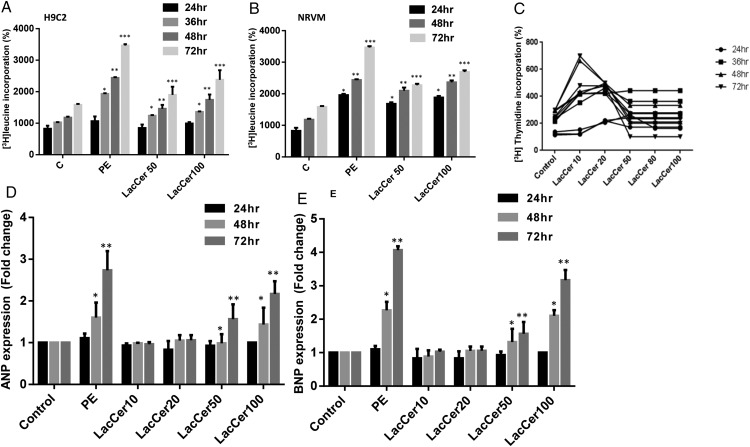
A time and LacCer concentration (50–100 μM)-dependent increase in protein synthesis in H9c2 myotubes and neonatal rat ventricular myocytes (NRVM) is shown in Figure 2A and B. H9c2 cells were induced to undergo differentiation (2% horse serum) to form myotubes. LacCer-induced protein synthesis was significantly increased (2- to 3-fold) at and above the concentration of 50 μM. The maximum increase in protein synthesis was also observed following 48 h of incubation with 100 μM of LacCer in H9c2 myotubes and in NRVM, respectively. Thus, LacCer alone increases protein synthesis in cardiomyocytes at a concentration similar to PE.
Fig. 2.
LacCer dose and time-dependently increases protein synthesis and proliferation in cardiomyocytes: H9c2 myotubes and NRVM were treated with 100 µM PE and different doses of LacCer (10, 20, 50 and 100 µM) for each time duration (24, 36, 48 and 72 h). [3H]-Leucine incorporation study was done (A and B). [3H]-Thymidine incorporation was measured to assess the proliferative effect of LacCer in H9c2 cells. H9c2 cells were plated (105 per well) in 24-well plates and were allowed to grow for 24 h in DMEM without serum. Cells were then stimulated for 48 h with a single dose of 100 μM PE. Cells were also stimulated with different doses of LacCer (10, 20, 50, 80 and 100 μM) for 24, 36, 48 and 72 h and co-incubated with [3H]-thymidine (5 mCi/mL media) at indicated time points (C). LacCer increases the expression of ANP and BNP genes in H9c2 cells and NRVM: RNA was isolated from NRVM's and real-time quantitative PCR analysis was performed using the gene specific primers for ANP and BNP (D and E). LacCer induces cardiomyocyte protein synthesis and hypertrophic gene expression (ANP, BNP) dose and time dependently. Experiments were done independently for n = 5, *P < 0.05, **P < 0.002, ***P < 0.001 vs control.
[3H]-Thymidine incorporation was measured to assess the proliferative effect of LacCer in these cells (Figure 2C). The cells were maintained in complete medium (10% fetal bovine serum (FBS)). At a lower concentration of LacCer (10 μM) and after 48 h of incubation, a ∼5-fold increase in [3H]-thymidine incorporation into DNA was observed. Further increasing the concentration of LacCer did not significantly alter this observation.
LacCer increases the expression of ANP and BNP genes in H9c2 cells and NRVM
ANP and BNP genes have been reported to serve as bonafide biomarkers in the development of cardiac hypertrophy (Cambronero et al. 2009; Sergeeva and Christoffels 2013). So, we examined the temporal profile of ANP and BNP mRNA expression in cardiomyocytes incubated with and without LacCer (Figure 2D and E). LacCer dose dependently and significantly (2- to 3-fold) up-regulated the levels of ANP and BNP mRNAs starting at a concentration of 50 μM (Figure 2D and E) and reaching a maximum increase at 100 μM.
Hypertrophic response on cardiomyocyte size induced by LacCer
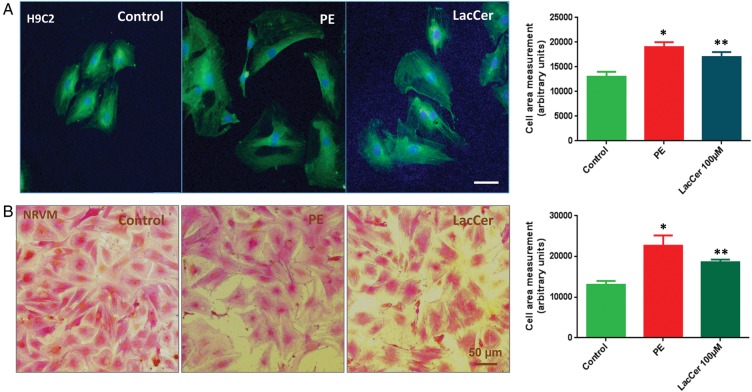
One of the hallmarks of cardiac hypertrophy is an increase in myocyte size. Therefore, we examined whether LacCer can induce an increase in cell size associated with cardiac hypertrophy (Figure 3). NRVMs and H9c2 cells were treated with LacCer at different concentrations (10, 20, 50 and 100 μM) for 24 and 48 h. PE served as a positive control. The cells were fixed and stained with anti-α-actinin antibody to distinguish myocytes from other cell types in the cultures. Immunofluorescent and bright field images were taken. Treatment with 100 μM of LacCer for 48 h increased the cell size ∼40 ± 1%.
Fig. 3.
LacCer induced hypertrophic response on cardiomyocyte size: Serum starved H9c2 cells (A) and NRVMs (B) were stimulated for 48 h with 100 µM PE and 100 µM LacCer. Forty-eight hours after incubation, the cells were fixed and stained with alpha actinin antibody. Fluorescence (A) and bright field images (B) were taken to visualize the effect of stimulators on cardiomyocyte cell size. LacCer induces the increase in cardiomyocyte size.
LacCer alters ROS levels and cell viability in H9c2 cells
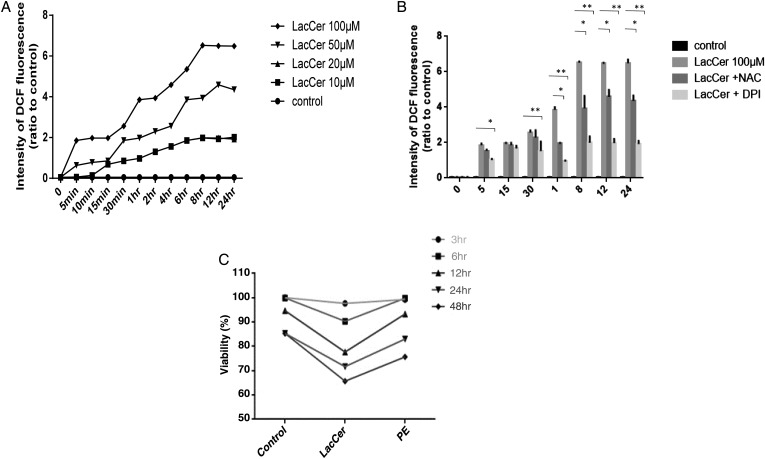
The levels of intracellular ROS in H9c2 cells were measured using a fluorescent probe, 2′,7′-dichlorofluorescin diacetate (DCFH2-DA) (Oyama et al. 2009) (Figure 4A). The intensity of DCF fluorescence was observed to increase slightly in normal cells exposed to DMSO. In comparison, a significant increase was observed in the intensity of DCF fluorescence in LacCer treated H9c2 cells. LacCer-induced increase in DCF fluorescence was time and concentration dependent. LacCer (10 μM) was sufficient to increase ROS levels within 10 min of treatment in H9c2 cells.
Fig. 4.
LacCer induces ROS generation in cardiomyocyte: Cells were treated with CM-H2DCFH2-DA (10 μM) for 15 min prior to the addition of LacCer. After incubation with LacCer for different time points, the intensity of DCF fluorescence was analyzed using a micro plate reader (A). Data represents the mean SD relative to the DCF fluorescence intensity of the control of four independent experiments. LacCer-induced ROS generation is inhibited by NAC and NAD(P)H oxidase inhibitor: The culture medium of H9c2 cells was replaced by medium containing DPI (200 μM) and NAC (15 mM). Cells were then treated with CM-H2DCFH2-DA (10 μM) for 15 min prior to the addition of LacCer. Fluorescence intensity was measured at a wavelength of 535 nm (B). *P < 0.01 and **P < 0.001 vs LacCer treatment. The effect of LacCer on cell viability was also measured (C).
We also studied the effect of antioxidant N-acetylcysteine (NAC), a scavenger of ROS and diphenylene iodonium (DPI), an inhibitor of NAD(P)H oxidase on LacCer-induced ROS generation. The culture medium of H9c2 cells was replaced by a medium containing DPI (200 μM) and NAC (15 mM). Cells were then treated with DCFH2-DA (10 μM) for 15 min prior to the addition of LacCer. NAC and DPI prevented LacCer-induced increase in the intensity of DCF fluorescence (Figure 4B). As shown in Figure 4C, a 20 ± 5% decrease in cell viability is found to be associated with a concentration of 100 μM LacCer. Similarly, cells treated with 100 μM PE also showed ∼11 ± 3% decrease in cell viability. Thus, hypertrophy and cell viability both are affected by these diverse compounds.
Relationship between hypertrophy and ROS levels
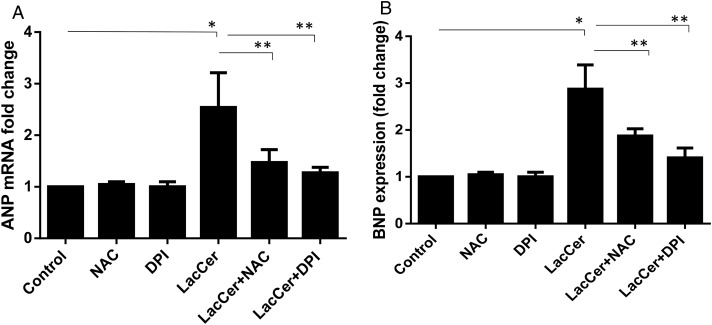
To determine whether ROS generated upon treatment with LacCer is critical in cardiac hypertrophy, we examined the effects of NAC and DPI on hypertrophy in H9c2 cells. Both NAC and DPI mitigated the increase in ANP and BNP gene expression induced by LacCer (Figure 5). Thus, LacCer-mediated increase in ROS is critical for cardiac hypertrophy.
Fig. 5.
Antioxidant treatments have significantly downregulated the ANP and BNP expression induced by LacCer: The culture medium of H9c2 cells was replaced by medium containing DPI (200 μM) and NAC (15 mM). Eight hours after the addition of DPI and NAC, cells were treated with or without LacCer for 48 h. ANP and BNP expression were analyzed (A and B). Data represent the mean SD of three independent experiments. *P < 0.05, **P < 0.001 and ***P < 0.0001. Antioxidant treatment has significantly downregulated the ANP and BNP expression induced by LacCer.
LacCer induces c-jun and c-fos gene expression
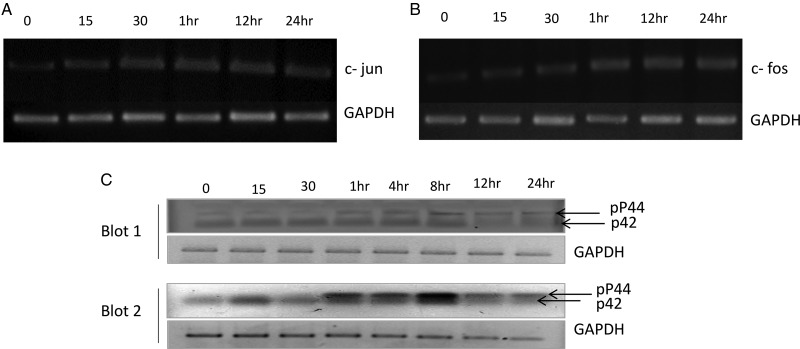
The treatment of cardiomyocytes with LacCer significantly increased the c-jun mRNA level as detected by semi-quantitative real-time-polymerase chain reaction (RT-PCR) (Figure 6A) and real-time quantitative PCR (data not shown). To determine whether an increase in the expression of the transcription factors c-jun was of specific nature, we also examined the expression of several other transcription factors using real-time quantitative PCR. No changes in NFAT3, NFkB, c-myc, MEF2C and MEF2D mRNA levels were observed except for the upregulation for c-fos mRNA level (Figure 6B).
Fig. 6.
LacCer induces c-fos and c-jun gene expression: H9C2 cells were incubated with LacCer (100 µM) for various time intervals as indicated above. RNA was isolated; RT-PCR and real-time quantitative PCR analysis was performed using the gene-specific primers for c-jun and c-fos. LacCer induces the expression of c-jun and c-fos mRNAs with time (A and B). GAPDH is used as an internal control. LacCer induces phosphorylation of p44 MAP kinase: H9C2 cells were incubated with LacCer (100 µM) for various time intervals as indicated above. Whole cell lysates (60 µg protein/well) were subjected to western immunoblot assay with phospho p44/42 MAP kinase antibody. Data show blots from two independent experiments (Blots 1 and 2). LacCer induces the phosphorylation of p44 MAP kinase (upper band shown by arrow in Blots 1 and 2) (C). GAPDH was used as a loading control. LacCer induces phosphorylation of p44 MAP kinase and induction of c-jun and c-fos genes in cardiomyocytes.
Involvement of PKC and ERK1/2 in the LacCer-mediated increases in c-fos and c-jun gene expression and hypertrophy
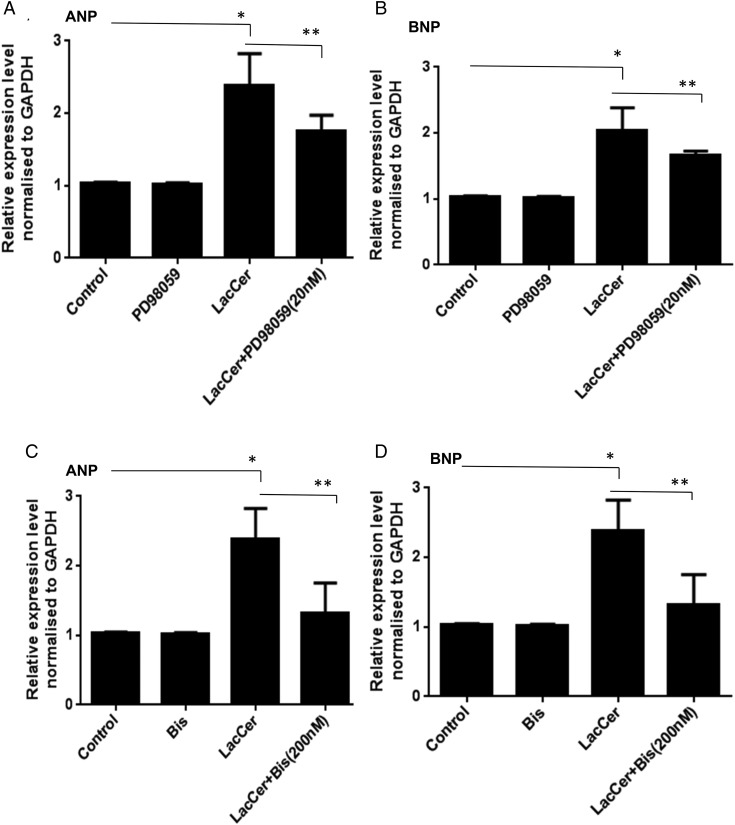
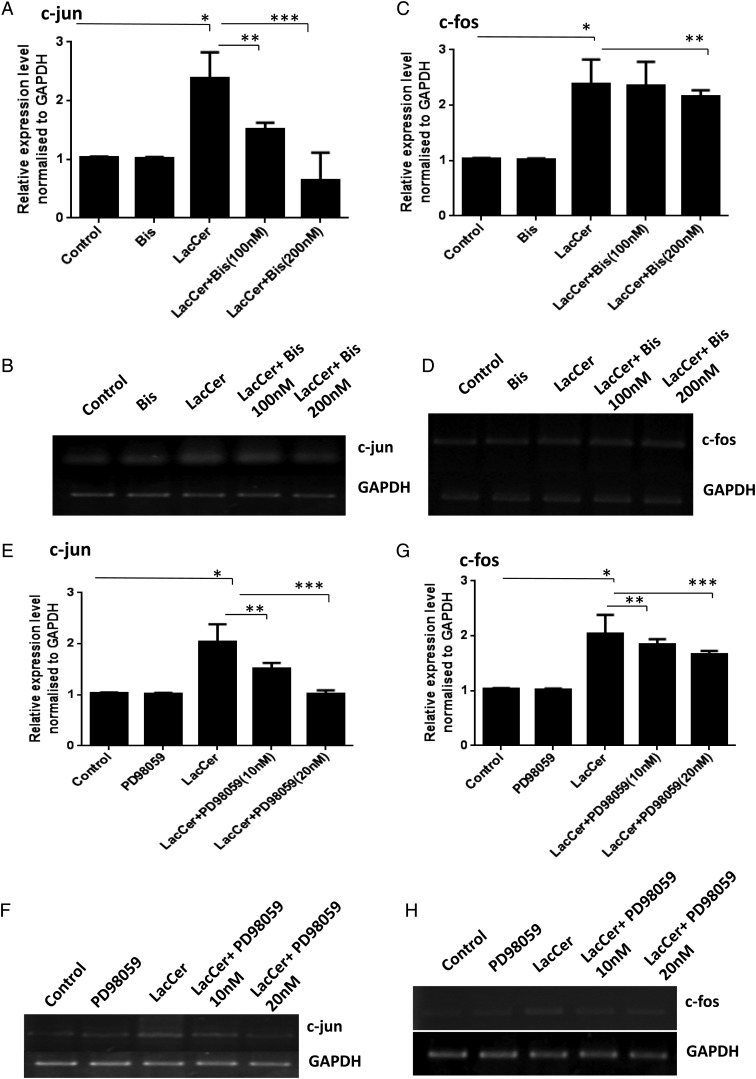
PKC and ERK1/2 have been reported to be involved in the regulation of c-fos and c-jun gene expression in neonatal cardiomyocytes (Sugden and Clerk 1998; Bueno and Molkentin 2002; Irukayama-Tomobe et al. 2004; Li et al. 2005). We have previously shown that in human arterial smooth muscle cells, PKC and ERK1/2 are involved in the LacCer-mediated increases in cell proliferation (Chatterjee et al. 1997; Gong et al. 2004). The possible role of PKC in LacCer-mediated hypertrophy was examined by pretreating cardiomyocytes for 8 h with bisindolylmaleimide (Bis) (100 and 200 nM), an inhibitor of PKC activity, prior to the addition of LacCer (100 μM). It can be seen from Figure 7C and D that inhibition of PKC attenuated the LacCer induced increases in ANP/BNP mRNA levels. Figure 8A–D shows that inhibition of PKC also attenuated the LacCer-induced increase in c-jun and c-fos mRNA levels. Pretreatment of cardiomyocytes with PD98059 (20 nM), an ERK1/2 signaling inhibitor, for 8 h prior to the addition of LacCer prevented the increases in ANP, BNP mRNA levels (Figure 7A and B) and c-jun, c-fos mRNA levels (Figure 8E–H) induced by LacCer. Bis or PD98059 alone did not affect c-fos and c-jun gene expression.
Fig. 7.
Involvement of PKC and ERK1/2 in LacCer-mediated increases in ANP and BNP gene expression: H9c2 cells were treated with PD98059 (20 nM), an inhibitor of ERK1/2 activation, 8 h prior to the addition of LacCer (100 µM). Inhibiting ERK1/2 attenuated the LacCer-induced increase in ANP and BNP mRNA levels (A and B). Pretreatment of cardiomyocytes with bisindolylmaleimide (Bis) (200 nM), an inhibitor of PKC activities for 8 h prior to the addition of LacCer, also prevented the increases in ANP and BNP mRNA levels induced by LacCer (C and D). Bis or PD98059 alone did not affect ANP and BNP gene expressions.
Fig. 8.
Involvement of PKC and ERK1/2 in LacCer-mediated increases in c-fos and c-jun gene expression: H9c2 cells were treated with bisindolylmaleimide (Bis) (100 and 200 nM), prior to the addition of LacCer (100 µM). RT-PCR (B, D, F and H) and real-time quantitative PCR (A, C, E and G) analysis were performed using the gene-specific primers for c-fos and c-jun. Pretreatment of cardiomyocytes with bisindolylmaleimide significantly prevented LacCer-induced expression of c-jun (A and B) and c-fos (C and D). Similarly, it can be seen in E and F that pretreatment of cardiomyocytes with PD98059 (10 and 20 nM) prior to the addition of LacCer attenuated the LacCer-induced increase in c-jun mRNA level and c-fos mRNA level (G and H). Bis or PD98059 alone did not affect c-fos and c-jun gene expressions. *P < 0.05 vs control, **P < 0.001 and ***P < 0.0003 vs LacCer treatment.
Antioxidant treatments have significantly downregulated the c-fos and c-jun gene expression induced by LacCer
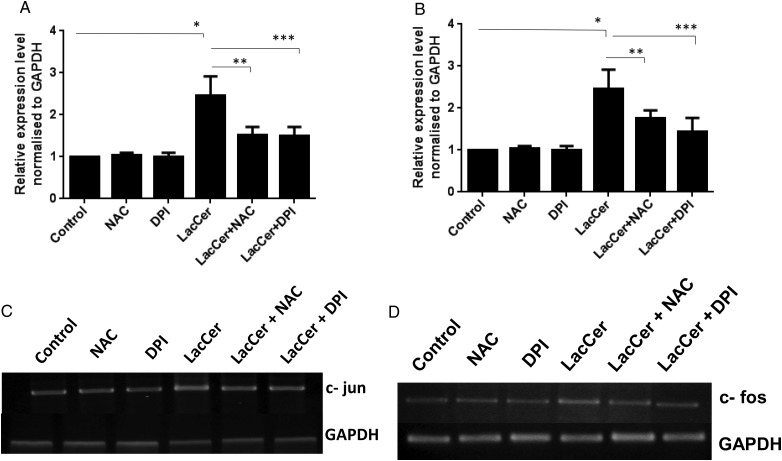
The culture medium of H9c2 cells was replaced by a medium containing DPI (200 μM) and NAC (15 mM). Eight hours after the addition of DPI and NAC, cells were treated with and without LacCer for 48 h. c-fos and c-jun mRNA expressions were analyzed by real-time quantitative PCR (Figure 9A and B) and RT-PCR analysis (Figure 9C and D). NAC and DPI treatments have significantly downregulated the c-fos and c-jun expression induced by LacCer.
Fig. 9.
Antioxidant treatments have significantly downregulated the c-fos and c-jun gene expression induced by LacCer: The culture medium of H9c2 cells was replaced by medium containing DPI (200 μM) and NAC (15 mM). Eight hours after the addition of DPI and NAC, cells were treated with or without LacCer for 48 h. c-jun and c-fos mRNA expressions were analyzed by real-time quantitative PCR (A and B) and RT-PCR analysis (C and D). Data represents the mean SD of four independent experiments. *P < 0.05 vs control, **P < 0.001 and ***P < 0.0001 vs LacCer treatment. NAC and DPI treatment has significantly downregulated the c-fos and c-jun expression induced by LacCer.
Discussion
The following major findings emerged from the present study. (i) Only LacCer, among a host of other GSLs and sphingolipids decorating the mammalian cell membrane, exerted a time- and concentration-dependent increase in hypertrophy in cardiomyocytes from neonatal rat heart and rat H9c2 cells. (ii) Mechanistic studies revealed that LacCer induces cardiac hypertrophy by an “oxygen-sensitive” signaling pathway by way of activating NAD(P)H oxidase to generate superoxides, protein kinase-C activation, p44 mitogen activated protein kinase (MAPK) phosphorylation and nuclear factor c-fos and c-jun expression (Figure 10).
Fig. 10.
LacCer induces hypertrophy in cardiomyocytes via ROS generation and activation of P44 MAP kinase.
Cardiac hypertrophy in vivo involves the enlargement of the myocardial cells due to an overload of blood volume and increased blood pressure. In contrast, cardiac hypertrophy in vitro is induced by the use of agonists such as PE which binds to its cognate receptors and transduces downstream components to eventually induce hypertrophy. In this study, we used PE as a positive control and demonstrated that at a similar concentration (100 μM), LacCer independently could serve as a bonafide agent to induce cardiac hypertrophy in H9c2 cells and freshly cultured primary rat cardiomyocytes. At the cellular level, hypertrophy is characterized by an increase in the size of cells. This increase in cell size is mainly accompanied by an increase in protein synthesis. During hypertrophy, cells grow in size without further cell division. Proliferation on the other hand is the division of cells accompanied by DNA synthesis and nuclear division. Treatment with 10 μM LacCer was found to be most effective in inducing cell proliferation, which is similar to the results reported in arterial smooth muscle cells (Bhunia et al. 1996). However, when the cells were stimulated with 50–100 μM of LacCer, there was a significant increase in cell volume and cell size, which is a hallmark of hypertrophy. Increase in DNA synthesis was much smaller relative to increase in RNA and protein synthesis at a LacCer concentration of 50–100 μM. LacCer concentration-dependent phenotypic effect on hypertrophy was also reproduced in NRVMs, which are terminally differentiated cells. Our studies employed multiple criteria to assess hypertrophy in these cardiomyocytes, e.g. increased cell volume, increased protein synthesis using [3H]-leucine as a precursor and the measurement of mRNA levels of ANP- and BNP-established biomarkers of cardiac hypertrophy. Next, we investigated the effects of a pool of GSLs and sphingolipids on cardiac hypertrophy and observed that they did not significantly affect this phenotype. Therefore, we conclude that an intact molecule of LacCer is required to induce cardiac hypertrophy. Importantly, the catabolic or anabolic products of LacCer failed to induce this phenotype. These studies suggest that LacCer specifically induced cardiac hypertrophy.
The potential role for free oxygen radicals in cardiac hypertrophy has been elucidated in many earlier studies (Afanas'ev 2011; Hayashi et al. 2011; Maulik and Kumar 2012). Therefore, we examined the effects of LacCer on superoxide production and its mitigation on cardiac hypertrophy. As shown in Figure 4, LacCer induced the generation of superoxides in a time- and concentration-dependent manner (Figure 4A) and this was mitigated by the use of N-acetylcysteine (a scavenger of free oxygen radicals) and diphenylamine iodonium (DPI), an inhibitor of NAD(P)H oxidase (Figure 4B) (Hsieh et al. 2013; Yang, Chen et al. 2013; Yang, Qu et al. 2013). Use of these inhibitors also mitigated LacCer-induced cardiac hypertrophy biomarkers mRNA levels, e.g. ANP and BNP (Figure 5). This observation suggests that, by activating NAD(P)H oxidase, LacCer generates superoxide radicals which in turn activate a downstream signaling cascade leading to cardiac hypertrophy. At lower concentrations (10–20 μM), LacCer stimulated DNA synthesis to facilitate proliferation by producing small quantities of superoxide. 10 μM LacCer concentration was found to be most effective in inducing proliferation, which is similar to the results reported in arterial smooth muscle cells (Bhunia et al. 1996). At higher concentrations (50–100 μM), LacCer is generating a large amount of superoxides that could affect cell viability and stimulate a pathways leading to hypertrophy.
We have previously shown in cultured normal human fibroblasts (Chatterjee et al. 1988) that [3H]-LacCer associated with LDL bound to the cell membrane at 4°C. However, when the cells were warmed to 37°C, [3H]-LacCer rapidly internalized, degraded to GlcCer and converted to GbOse3Cer and Gbose4Cer within 30 min. In contrast, in human fibroblasts lacking functional LDL receptors, LacCer did not metabolize rapidly, rather it entered the cells via an LDL receptor-independent pathway. Thus exogenously added LacCer should first incorporate to the plasma membrane, activate NAD(P)H oxidase to generate superoxides and then affect cardiac hypertrophy.
The immediate early genes activated during hypertrophic stimulus include c-jun, c-fos and c-myc. Previous studies have shown that PE induces immediate early genes such as c-fos and c-jun leading to cardiac hypertrophy (Iwaki et al. 1990; Omura et al. 2002). In our study, we found that LacCer-induced hypertrophy also involved the upregulation of both c-fos and c-jun genes (Figure 6A and B). Our study also demonstrates that the activation of these immediate early genes involves oxidative stress (Figure 9).
Furthermore, we investigated the effects of LacCer on PKC activation and cardiac hypertrophy. The involvement of PKC in cardiac hypertrophy has been reported previously (Bowman et al. 1997; Braz et al. 2002; Vijayan et al. 2004). For example, PE is also known to induce hypertrophy via PKC activation (Clerk et al. 1994). Using bisindolylmaleimide, an inhibitor of PKC, we observed a marked inhibition of LacCer-induced ANP and BNP mRNA levels in cardiomyocytes (Figure 7C and D), suggesting that PKC plays a central role in LacCer-induced hypertrophy (Figure 10).
Previous studies have also placed p44 MAPK activation as a central component in agonist-induced cardiac hypertrophy (Araujo et al. 2010; Dai et al. 2011; Sbroggio et al. 2011; Fahmi et al. 2013; Ferguson et al. 2013; Lopez-Contreras et al. 2013; Ruppert et al. 2013). For example, PE and angiotensin II is known to induce p44 MAPK activation (Post et al. 1996; Gusterson et al. 2002; Hammad et al. 2010; Caldiz et al. 2011; Perez et al. 2011; Muthusamy et al. 2012; Yao et al. 2012). Also transforming growth factor--β1 induces hypertrophy and fibrosis via activation of p44 MAPK (Bujak and Frangogiannis 2007). We therefore examined the effects of LacCer on p44 MAPK and cardiac hypertrophy. We observed not only that LacCer induced the rapid phosphorylation of p44 MAPK but also that this activation process was required to induce cardiac hypertrophy, as the use of p44 MAPK inhibitor mitigated LacCer-induced upregulation of ANP and BNP mRNA expression (Figure 7A and B). Also, LacCer-induced upregulation of c-jun and c-fos mRNA involves PKC and p44 MAP kinases activation (Figure 8). Recently, LacCer has been implicated to directly bind to phospholipase A-2 to induce arachidonic acid production (Gong et al. 2004; Nakamura et al. 2013). Therefore, we examined the effects of a c-PLA2 inhibitor p-bromophenacyl bromide (20 μM) on LacCer-mediated cardiac hypertrophy. Since the results were negative (data not shown), it implies that LacCer does not recruit c-PLA2 to induce cardiac hypertrophy. Our findings are in agreement with previous work, showing that c-PLA2 has no significant/direct role in cardiac hypertrophy (Haq et al. 2003).
Hypertrophy induced by fat diet intake is fast becoming one of the primary cause of myocardial infarction, morbidity, stroke and contributes to ∼50% mortality in western countries. It is a major clinical concern in cardiovascular medicine. Increased levels of fatty acids from fat diets can impact the heart harmfully due to the formation of noxious derivatives of glucose and lipid metabolism. A close association between GSL level and cardiac hypertrophy in vivo in apoE−/− mice fed a western diet was suggested by us recently (Chatterjee et al. 2013) (submitted for publication). We found that the activity of several GSL glycosyl transferases and the level of GSLs, particularly LacCer, were markedly increased in mice fed a western diet alone when compared with apoE−/− mice fed regular mice chow alone. Cardiac hypertrophy (LV mass measurement) in this transgenic mouse model of hyperlipidemia was prevented and interfered by the use of d-threo-1-phenyl-2-decanoylamino-3-morpholino-1-propanol (d-PDMP), an inhibitor of GlcCer synthase and LacCer synthase (Chatterjee et al. 2013) (submitted for publication).
However, these in vivo studies did not elaborate whether one or more GSLs were implicated in cardiac hypertrophy. The present study using cultured cardiomyocytes suggests that LacCer alone can induce hypertrophy and therefore exposes both LacCer and LacCer synthase as novel drug targets to mitigate this phenotype.
Materials and methods
Chemicals
Dulbecco's modified Eagle's medium (DMEM), trypsin-ethylenediaminetetraacetic acid, phosphate-buffered saline (PBS), l-glutamine, penicillin/streptomycin, fluorescent probe DCFH2-DA, TRIzol reagent, cDNA synthesis kit, SYBR Green PCR Master Mix, fluorescein isothiocyanate (FITC)-conjugated antibody and DAPI nuclear stain were purchased from Life Technologies, Grand Island, NY. FBS, normal horse serum (HRS), DPI, NAC, PE, trichloroacetic acid, NaOH and monoclonal anti-α-actinin (Sarcomeric) (A7732) were purchased from SIGMA Chemical Co., St. Louis, MO. Neonatal rat NeoMyts Kit was obtained from Cellutron Life Technology, Baltimore, MD. 3-(4,5-Dimethylthiazol-2-yl)-2,5- diphenyltetrazolium bromide (MTT) assay kit was obtained from Promega, Madison, WI. [3H]-Leucine and [3H]-thymidine were obtained from American Radiolabeled Chemicals. Scintillation cocktail was obtained from RPI, Mount Prospect, IL. Anti-phospho p44/42 MAP kinase antibody (9101) was obtained from Cell Signaling, Danvers, MA. Lactosylceramide (LacCer) (palmitoyl) and other GSL stocks were purchased from Matreya LLC, Pleasant Gap, PA. All other chemicals used in this study were of the highest grade available from commercial suppliers.
Stock solution of GSLs, DPI and NAC were prepared in dimethyl sulfoxide (DMSO) and stored at −20°C until use.
Cell culture
H9c2 rat cardiomyoblasts were obtained from the American Type Culture Collection (Rockville, MD) and were grown in high-glucose DMEM medium supplemented with 10% FBS, 100 units/mL penicillin and 100 μg/mL streptomycin and maintained at 37°C in a humidified-atmosphere incubator (Thermo Fisher Scientific, Pittsburgh, PA) with 5% CO2. The cells were seeded onto six-well plates at a density of 3 × 10⁵ cells/well containing 3 mL culture medium or 105 per well in 24-well plates containing 1 mL medium. To induce differentiation of H9c2 myoblasts into myotubes, growth medium was replaced with differentiation medium (DMEM containing 2% horse serum) and allowed to grow for 48 h before any treatment.
NRVM isolation
Ventricles were dissected from 1-day-old Sprague-Dawley rats. NRVMs were isolated using the Cellutron Neomyocytes isolation system (Cellutron Life Technology, Baltimore, MD) following the manufacturer's instructions (Zheng et al. 2011; Ranek et al. 2013). Cells were pre-plated for 2 h to separate adherent fibroblasts from nonadherent cardiomyocytes. Myocytes were resuspended in DMEM containing 10% FBS, 2 mM l-glutamine and penicillin/streptomycin (P/S) and plated onto either gelatin-coated cover glasses or culture dishes. Myocytes were plated at 700 cells/mm2 for cell size assays and at 1100 cells/mm2 for other experiments.
[3h]-Leucine incorporation
[3H]-Leucine was measured essentially by the method of Thaik et al. (1995). The embryonic rat-heart derived H9c2 cells American type culture collection were maintained in a growth medium comprising DMEM supplemented with 10% FBS. H9c2 cells were plated at a density of 5000 cells/cm2 and allowed to proliferate in the growth medium. When cells had reached near confluence, the growth medium was replaced with a differentiation medium (DMEM containing 2% horse serum) for 48 h to induce differentiation of H9c2 myoblasts into myotubes (Planavila et al. 2005, 2006). Cells were then stimulated with a single dose of 100 μM PE. Cells were also stimulated with different glycolipids (100 µM) or different doses of LacCer (10, 20, 50, 80 and 100 μM) for 24, 36, 48 and 72 h and co-incubated with [3H]-leucine (5 Ci or 142 Ci/mmol) at indicated time points. At the end of the incubation period, cells were washed twice in PBS and proteins were subsequently precipitated with ice-cold 10% trichloroacetic acid. After dissolving the precipitates in 0.5 M NaOH, 5 mL scintillation cocktail was added and radioactivity was measured by liquid scintillation spectroscopy (Brostrom et al. 2000; Fujita et al. 2006). [3H]-Leucine incorporation experiments were repeated five times with triplicate measurements for each experiment.
[3h]-Thymidine incorporation assay
H9c2 cells were plated (105 per well) in 24-well plates, and were made quiescent for 24 h in DMEM without serum. Quiescent cells were then stimulated for 48 h with a single dose of 100 μM PE. Cells were also stimulated with different glycolipids (100 µM) or different doses of LacCer (10, 20, 50, 80 and 100 μM) for 24, 36, 48 and 72 h and co-incubated with [3H]-thymidine (5 mCi/mL media) at indicated time points. Cells were washed with phosphate-buffered saline and dissolved in 0.5 M NaOH. The incorporation of [3H]-thymidine was measured as described above. [3H]-Thymidine incorporation experiments were repeated five times with triplicate measurements for each experiment.
Cell viability
Cell viability was determined using an MTT assay kit (Oyama et al. 2009; Liu et al. 2012). Briefly H9c2 cells were plated (104 per well) in 96-well plates, and were made quiescent for 24 h in DMEM without serum. Quiescent cells were incubated with LacCer and MTT assay reagent. The reaction was stopped at different time points and absorbance was recorded at 540 and 690 nm with a microplate reader (Thermo Scientific Multiskan Spectrum). Viability was determined when compared with control cells (normal H9c2 cells incubated with DMSO).
Immunofluorescence microscopy
Briefly the cells were fixed with 1% paraformaldehyde and permeabilized with 0.1% Triton X-100. For staining of α-actinin, cells were incubated with a mouse monoclonal antibody to α-actinin (1:200 in 1% BSA) for 2 h. Cells were washed with 1% BSA in PBS and were treated with FITC-conjugated goat anti-mouse IgG (green fluorescence) secondary antibody. Images were captured using an Olympus Invert scope microscope; Olympus, Tokyo, Japan. Photographic images were taken from five random fields (Zhou et al. 2011).
Measurement of cardiomyocyte hypertrophy
NRVMs and H9c2 cells were treated with PE (100 μM) and LacCer (100 μM) for 24 or 48 h. Cell area was quantified from manually outlined cells in digitized microscopic images (recorded by an Olympus Invert scope microscope; Olympus, Tokyo, Japan) of randomly chosen cell fields using the Image-Pro Plus 6.0 software (Media Cybernetics, Silver Spring, MD). A minimum of 50 cells were measured for each independent experiment, repeated ≥3 times (Koren et al. 2013).
Real-time-polymerase chain reaction
Total RNA was isolated from H9c2 cells and NRVMs using TRIzol reagent (Life Technologies, Grand Island, NY). Two micrograms of RNA was reverse-transcribed with SuperScript II (Life Technologies, NY) using random primers. Gene-specific primers were designed (Table I.) and used for amplifying ANP, BNP, c-fos and c-jun mRNAs.
Table I.
Primers used in the present study
| Gene | Forward primer (5′–3′) | Reverse primer (5′–3′) |
|---|---|---|
| ANP | GAGAGACGGCAGTGCTTCTAGGC | CGTGACACACCACAAGGGCTTAGG |
| BNP | TGGGGAGGCGAGACAAG | AGCCCAAACGACTGACG |
| c-fos | AGA GGA GAA GGC CAA GAA GG | GCA GCC GCA TTA AGT TCT TC |
| c-jun | CAG CTC TTG AAG GAC CAA GG | AAG AGA CCC AGG CAG AGT CA |
Analysis of gene expression by quantitative real-time PCR
Total RNA was isolated from H9c2 cells and NRVMs, using TRIzol reagent. Two micrograms of RNA was reverse-transcribed with SuperScript II using random primers. Real-time PCR was performed using SYBR Green PCR Master Mix (Life Technologies) in an Applied Bio system's Step one RT-PCR system with the following thermal cycling conditions: 10 min at 95°C, followed by 40 cycles at 95°C for 15 s and at 60°C for 1 min for denaturation, annealing and elongation. Relative mRNA levels were calculated by the method of 2−DDCt (Livak and Schmittgen 2001). Data were normalized to GAPDH mRNA levels. To determine the specificity of amplification, melting curve analysis was applied to all final PCR products. All samples were performed in triplicate. The expression suite software (Applied Bio-systems) was used to analyze the data.
Measurement of ROS levels
Intracellular ROS levels were assessed using DCFH2-DA (Oyama et al. 2009). Cells were treated with DCFH2-DA (10 μM) for 15 min prior to the addition of LacCer. After incubation with LacCer for different time points (5, 10, 15 and 30 min, 1, 2, 4, 6, 8, 12 and 24 h) the cells were washed with PBS and analyzed using a fluorescent microplate reader (Beckman Coulter, Fullerton, CA). The relative intensity of DCF fluorescence was determined at a wavelength of 535 nm when compared with control cells (normal H9c2 cells incubated with DMSO). Data represent the mean intensities of DCF fluorescence, SD relative to the DCF fluorescence intensity of the control of four independent experiments.
Treatment of cells with NAC and DPI
The culture medium of H9c2 cells was replaced by one containing DPI (200 μM) and NAC (15 mM). Cells were then treated with DCFH2-DA (10 μM) for 15 min prior to the addition of LacCer for different time points (5, 15 and 30 min, 1, 8, 12 and 24 h). Cells were washed with PBS and analyzed using a fluorescent microplate reader at a wavelength of 535 nm (Sano et al. 2001; Tanaka et al. 2001).
ANP and BNP expression levels
Eight hours after the addition of DPI and NAC, cells were treated with and without LacCer for 24 h. ANP and BNP mRNA expression levels were measured by real-time quantitative PCR method. Data represent the mean ± SD of three independent experiments.
Western blotting
Proteins were separated on gradient sodium dodecyl sulfate–polyacrylamide gel electrophoresis (7.5–15% acrylamide) and electrophoretically transferred to polyvinylidene difluoride membrane. Membranes were blocked using 5% skim milk in PBS plus 0.05% v/v Tween-20 before incubation with anti-phospho p44/42 MAP kinase antibody (9101; Cell Signaling) and anti-GAPDH antibody (sc-47724; Santa Cruz Biotech, Dallas, TX). HRP-conjugated secondary antibodies and ECL plus kit (Amersham Life Sciences, Piscataway, NJ) were used to detect proteins of interest.
Statistical analysis
All values are expressed as mean ± SEM. Comparison between groups was performed by one-way analysis of variance with Bonferroni's multiple comparison tests. Comparisons between the two groups were performed using nonpaired two-tailed Student's t-test. A value of P < 0.05 was considered significant. GraphPad Prism and MS-Excel statistical software were used for aforementioned statistical analysis.
Funding
This work was supported by National Institutes of Health grant PO-1 HL-107153-01. Funding to pay the Open Access publication charges for this article was provided by National Institutes of Health grant PO-1 HL-107153-01.
Conflict if interest
None declared.
Abbreviations
ANP, atrial natriuretic peptide; apoE, apolipoprotein E; ATCC, American type culture collection; Bis, bisindolylmaleimide; BNP, brain natriuretic peptide; DCFH2-DA, 2′,7′-dichlorofluorescin diacetate; DMEM, Dulbecco's modified Eagle's medium; DMSO, dimethyl sulfoxide; d-PDMP, d-threo-1-phenyl-2-decanoylamino-3-morpholino-1-propanol; DPI, diphenylene iodonium; FBS, fetal bovine serum; FITC, fluorescein isothiocyanate; FS, fractional shortening; GlcCer, glucosylceramide; GSL, glycosphingolipid; GT, glycosphingolipid glycosyltransferase; LacCer, lactosylceramide; LV, left ventricular; MAPK, mitogen activated protein kinase; NAC, N-acetylcysteine; NRVM, neonatal rat ventricular myocytes; PE, phenylephrine; PKC,; protein kinase C; PVDF, polyvinylidene difluoride; ROS, reactive oxygen species; RT-PCR, real-time-polymerase chain reaction.
Supplementary Material
Acknowledgments
We thank Dr. David Kass, Department of Cardiology, JHMI, for providing the NRVM cells used in this study.
References
- Afanas'ev I. ROS and RNS signaling in heart disorders: Could antioxidant treatment be successful? Oxidat Med Cell Longevity. 2011;2011:293769. doi: 10.1155/2011/293769. [DOI] [PMC free article] [PubMed] [Google Scholar]
- Araujo AS, Fernandes T, Ribeiro MF, Khaper N, Bello-Klein A. Redox regulation of myocardial ERK 1/2 phosphorylation in experimental hyperthyroidism: Role of thioredoxin-peroxiredoxin system. J Cardiovasc Pharmacol. 2010;56:513–517. doi: 10.1097/FJC.0b013e3181f50a70. [DOI] [PubMed] [Google Scholar]
- Balakumar P, Rohilla A, Mahadevan N. Pleiotropic actions of fenofibrate on the heart. Pharmacol Res. 2011;63:8–12. doi: 10.1016/j.phrs.2010.11.002. [DOI] [PubMed] [Google Scholar]
- Baumgartner D, Scholl-Burgi S, Sass JO, Sperl W, Schweigmann U, Stein JI, Karall D. Prolonged QTc intervals and decreased left ventricular contractility in patients with propionic acidemia. J Pediatr. 2007;150:192–197. doi: 10.1016/j.jpeds.2006.11.043. 197 e191. [DOI] [PubMed] [Google Scholar]
- Berger JP, Akiyama TE, Meinke PT. PPARs: Therapeutic targets for metabolic disease. Trends Pharmacol Sci. 2005;26:244–251. doi: 10.1016/j.tips.2005.03.003. [DOI] [PubMed] [Google Scholar]
- Bhunia AK, Han H, Snowden A, Chatterjee S. Lactosylceramide stimulates Ras-GTP loading, kinases (MEK, Raf), p44 mitogen-activated protein kinase, and c-fos expression in human aortic smooth muscle cells. J Biol Chem. 1996;271:10660–10666. doi: 10.1074/jbc.271.18.10660. [DOI] [PubMed] [Google Scholar]
- Borradaile NM, Schaffer JE. Lipotoxicity in the heart. Curr Hypertens Rep. 2005;7:412–417. doi: 10.1007/s11906-005-0035-y. [DOI] [PubMed] [Google Scholar]
- Bowman JC, Steinberg SF, Jiang T, Geenen DL, Fishman GI, Buttrick PM. Expression of protein kinase C beta in the heart causes hypertrophy in adult mice and sudden death in neonates. J Clin Invest. 1997;100:2189–2195. doi: 10.1172/JCI119755. [DOI] [PMC free article] [PubMed] [Google Scholar]
- Braz JC, Bueno OF, De Windt LJ, Molkentin JD. PKC alpha regulates the hypertrophic growth of cardiomyocytes through extracellular signal-regulated kinase1/2 (ERK1/2) J Cell Biol. 2002;156:905–919. doi: 10.1083/jcb.200108062. [DOI] [PMC free article] [PubMed] [Google Scholar]
- Brostrom MA, Reilly BA, Wilson FJ, Brostrom CO. Vasopressin-induced hypertrophy in H9c2 heart-derived myocytes. Int J Biochem Cell Biol. 2000;32:993–1006. doi: 10.1016/s1357-2725(00)00037-6. [DOI] [PubMed] [Google Scholar]
- Bueno OF, Molkentin JD. Involvement of extracellular signal-regulated kinases 1/2 in cardiac hypertrophy and cell death. Circ Res. 2002;91:776–781. doi: 10.1161/01.res.0000038488.38975.1a. [DOI] [PubMed] [Google Scholar]
- Bujak M, Frangogiannis NG. The role of TGF-beta signaling in myocardial infarction and cardiac remodeling. Cardiovasc Res. 2007;74:184–195. doi: 10.1016/j.cardiores.2006.10.002. [DOI] [PMC free article] [PubMed] [Google Scholar]
- Caldiz CI, Diaz RG, Nolly MB, Chiappe de Cingolani GE, Ennis IL, Cingolani HE, Perez NG. Mineralocorticoid receptor activation is crucial in the signalling pathway leading to the Anrep effect. J Physiol. 2011;589:6051–6061. doi: 10.1113/jphysiol.2011.218750. [DOI] [PMC free article] [PubMed] [Google Scholar]
- Cambronero F, Marin F, Roldan V, Hernandez-Romero D, Valdes M, Lip GY. Biomarkers of pathophysiology in hypertrophic cardiomyopathy: Implications for clinical management and prognosis. Eur Heart J. 2009;30:139–151. doi: 10.1093/eurheartj/ehn538. [DOI] [PubMed] [Google Scholar]
- Chatterjee S, Bedja D, Mishra S, Kass D. Inhibiting Glycosphingolipid glycosyltransferase activity Prevents Cardiac hypertrophy in apoE−/− mice fed western diet and C57 Bl-6 mice subject to trans-aortic constriction. Glycobiology. 2013;23:1412–1412. [Google Scholar]
- Chatterjee SB, Dey S, Shi WY, Thomas K, Hutchins GM. Accumulation of glycosphingolipids in human atherosclerotic plaque and unaffected aorta tissues. Glycobiology. 1997;7:57–65. doi: 10.1093/glycob/7.1.57. [DOI] [PubMed] [Google Scholar]
- Chatterjee S, Ghosh N, Castiglione E, Kwiterovich PO., Jr Regulation of glycosphingolipid glycosyltransferase by low density lipoprotein receptors in cultured human proximal tubular cells. J Biol Chem. 1988;263:13017–13022. [PubMed] [Google Scholar]
- Clerk A, Bogoyevitch MA, Anderson MB, Sugden PH. Differential activation of protein kinase C isoforms by endothelin-1 and phenylephrine and subsequent stimulation of p42 and p44 mitogen-activated protein kinases in ventricular myocytes cultured from neonatal rat hearts. J Biol Chem. 1994;269:32848–32857. [PubMed] [Google Scholar]
- Dahlof B, Devereux RB, Kjeldsen SE, Julius S, Beevers G, de Faire U, Fyhrquist F, Ibsen H, Kristiansson K, Lederballe-Pedersen O, et al. Cardiovascular morbidity and mortality in the Losartan Intervention For Endpoint reduction in hypertension study (LIFE): A randomised trial against atenolol. Lancet. 2002;359:995–1003. doi: 10.1016/S0140-6736(02)08089-3. [DOI] [PubMed] [Google Scholar]
- Dai HY, He T, Li XL, Xu WL, Ge ZM. Urotensin-2 promotes collagen synthesis via ERK1/2-dependent and ERK1/2-independent TGF-beta1 in neonatal cardiac fibroblasts. Cell Biol Int. 2011;35:93–98. doi: 10.1042/CBI20090104. [DOI] [PubMed] [Google Scholar]
- Devereux RB, Dahlof B, Gerdts E, Boman K, Nieminen MS, Papademetriou V, Rokkedal J, Harris KE, Edelman JM, Wachtell K. Regression of hypertensive left ventricular hypertrophy by losartan compared with atenolol: The Losartan Intervention for Endpoint Reduction in Hypertension (LIFE) trial. Circulation. 2004;110:1456–1462. doi: 10.1161/01.CIR.0000141573.44737.5A. [DOI] [PubMed] [Google Scholar]
- Fahmi A, Smart N, Punn A, Jabr R, Marber M, Heads R. p42/p44-MAPK and PI3K are sufficient for IL-6 family cytokines/gp130 to signal to hypertrophy and survival in cardiomyocytes in the absence of JAK/STAT activation. Cell Signal. 2013;25:898–909. doi: 10.1016/j.cellsig.2012.12.008. [DOI] [PMC free article] [PubMed] [Google Scholar]
- Ferguson BS, Harrison BC, Jeong MY, Reid BG, Wempe MF, Wagner FF, Holson EB, McKinsey TA. Signal-dependent repression of DUSP5 by class I HDACs controls nuclear ERK activity and cardiomyocyte hypertrophy. Proc Natl Acad Sci USA. 2013;110:9806–9811. doi: 10.1073/pnas.1301509110. [DOI] [PMC free article] [PubMed] [Google Scholar]
- Frey N, Katus HA, Olson EN, Hill JA. Hypertrophy of the heart: A new therapeutic target? Circulation. 2004;109:1580–1589. doi: 10.1161/01.CIR.0000120390.68287.BB. [DOI] [PubMed] [Google Scholar]
- Fujita T, Otsu K, Oshikawa J, Hori H, Kitamura H, Ito T, Umemura S, Minamisawa S, Ishikawa Y. Caveolin-3 inhibits growth signal in cardiac myoblasts in a Ca2+-dependent manner. J Cell Mol Med. 2006;10:216–224. doi: 10.1111/j.1582-4934.2006.tb00302.x. [DOI] [PMC free article] [PubMed] [Google Scholar]
- Gong N, Wei H, Chowdhury SH, Chatterjee S. Lactosylceramide recruits PKCalpha/epsilon and phospholipase A2 to stimulate PECAM-1 expression in human monocytes and adhesion to endothelial cells. Proc Natl Acad Sci USA. 2004;101:6490–6495. doi: 10.1073/pnas.0308684101. [DOI] [PMC free article] [PubMed] [Google Scholar]
- Grossman W, Jones D, McLaurin LP. Wall stress and patterns of hypertrophy in the human left ventricle. J Clin Invest. 1975;56:56–64. doi: 10.1172/JCI108079. [DOI] [PMC free article] [PubMed] [Google Scholar]
- Gusterson R, Brar B, Faulkes D, Giordano A, Chrivia J, Latchman D. The transcriptional co-activators CBP and p300 are activated via phenylephrine through the p42/p44 MAPK cascade. J Biol Chem. 2002;277:2517–2524. doi: 10.1074/jbc.M104626200. [DOI] [PubMed] [Google Scholar]
- Hammad MM, Kuang YQ, Yan R, Allen H, Dupre DJ. Na+/H+ exchanger regulatory factor-1 is involved in chemokine receptor homodimer CCR5 internalization and signal transduction but does not affect CXCR4 homodimer or CXCR4-CCR5 heterodimer. J Biol Chem. 2010;285:34653–34664. doi: 10.1074/jbc.M110.106591. [DOI] [PMC free article] [PubMed] [Google Scholar]
- Haq S, Kilter H, Michael A, Tao J, O'Leary E, Sun XM, Walters B, Bhattacharya K, Chen X, Cui L, et al. Deletion of cytosolic phospholipase A2 promotes striated muscle growth. Nat Med. 2003;9:944–951. doi: 10.1038/nm891. [DOI] [PubMed] [Google Scholar]
- Hayashi T, Yoshioka T, Hasegawa K, Miyamura M, Mori T, Ukimura A, Matsumura Y, Ishizaka N. Inhalation of hydrogen gas attenuates left ventricular remodeling induced by intermittent hypoxia in mice. Am J Physiol Heart Circ Physiol. 2011;301:H1062–H1069. doi: 10.1152/ajpheart.00150.2011. [DOI] [PubMed] [Google Scholar]
- Hood WP, Jr, Rackley CE, Rolett EL. Wall stress in the normal and hypertrophied human left ventricle. Am J Cardiol. 1968;22:550–558. doi: 10.1016/0002-9149(68)90161-6. [DOI] [PubMed] [Google Scholar]
- Hsieh YC, Hsu SL, Gu SH. Involvement of reactive oxygen species in PTTH-stimulated ecdysteroidogenesis in prothoracic glands of the silkworm, Bombyx mori. Insect Biochem Mol Biol. 2013;43:859–866. doi: 10.1016/j.ibmb.2013.06.008. [DOI] [PubMed] [Google Scholar]
- Irukayama-Tomobe Y, Miyauchi T, Sakai S, Kasuya Y, Ogata T, Takanashi M, Iemitsu M, Sudo T, Goto K, Yamaguchi I. Endothelin-1-induced cardiac hypertrophy is inhibited by activation of peroxisome proliferator-activated receptor-alpha partly via blockade of c-Jun NH2-terminal kinase pathway. Circulation. 2004;109:904–910. doi: 10.1161/01.CIR.0000112596.06954.00. [DOI] [PubMed] [Google Scholar]
- Iwaki K, Sukhatme VP, Shubeita HE, Chien KR. Alpha- and beta-adrenergic stimulation induces distinct patterns of immediate early gene expression in neonatal rat myocardial cells. fos/jun expression is associated with sarcomere assembly; Egr-1 induction is primarily an alpha 1-mediated response. J Biol Chem. 1990;265:13809–13817. [PubMed] [Google Scholar]
- Koren L, Elhanani O, Kehat I, Hai T, Aronheim A. Adult cardiac expression of the activating transcription factor 3, ATF3, promotes ventricular hypertrophy. PloS One. 2013;8:e68396. doi: 10.1371/journal.pone.0068396. [DOI] [PMC free article] [PubMed] [Google Scholar]
- LaPointe MC. Molecular regulation of the brain natriuretic peptide gene. Peptides. 2005;26:944–956. doi: 10.1016/j.peptides.2004.08.028. [DOI] [PubMed] [Google Scholar]
- Li HL, Wang AB, Huang Y, Liu DP, Wei C, Williams GM, Zhang CN, Liu G, Liu YQ, Hao DL, et al. Isorhapontigenin, a new resveratrol analog, attenuates cardiac hypertrophy via blocking signaling transduction pathways. Free Rad Biol Med. 2005;38:243–257. doi: 10.1016/j.freeradbiomed.2004.10.020. [DOI] [PubMed] [Google Scholar]
- Liu CL, Li X, Hu GL, Li RJ, He YY, Zhong W, Li S, He KL, Wang LL. Salubrinal protects against tunicamycin and hypoxia induced cardiomyocyte apoptosis via the PERK-eIF2alpha signaling pathway. J Geriatr Cardiol. 2012;9:258–268. doi: 10.3724/SP.J.1263.2012.02292. [DOI] [PMC free article] [PubMed] [Google Scholar]
- Livak KJ, Schmittgen TD. Analysis of relative gene expression data using real-time quantitative PCR and the 2(-Delta Delta C(T)) Method. Methods. 2001;25:402–408. doi: 10.1006/meth.2001.1262. [DOI] [PubMed] [Google Scholar]
- Lopaschuk GD, Folmes CD, Stanley WC. Cardiac energy metabolism in obesity. Circ Res. 2007;101:335–347. doi: 10.1161/CIRCRESAHA.107.150417. [DOI] [PubMed] [Google Scholar]
- Lopez-Contreras AJ, de la Morena ME, Ramos-Molina B, Lambertos A, Cremades A, Penafiel R. The induction of cardiac ornithine decarboxylase by beta2 -adrenergic agents is associated with calcium channels and phosphorylation of ERK1/2. J Cell Biochem. 2013;114:1978–1986. doi: 10.1002/jcb.24540. [DOI] [PubMed] [Google Scholar]
- Lorell BH, Carabello BA. Left ventricular hypertrophy: Pathogenesis, detection, and prognosis. Circulation. 2000;102:470–479. doi: 10.1161/01.cir.102.4.470. [DOI] [PubMed] [Google Scholar]
- Mathew J, Sleight P, Lonn E, Johnstone D, Pogue J, Yi Q, Bosch J, Sussex B, Probstfield J, Yusuf S. Reduction of cardiovascular risk by regression of electrocardiographic markers of left ventricular hypertrophy by the angiotensin-converting enzyme inhibitor ramipril. Circulation. 2001;104:1615–1621. doi: 10.1161/hc3901.096700. [DOI] [PubMed] [Google Scholar]
- Maulik SK, Kumar S. Oxidative stress and cardiac hypertrophy: A review. Toxicol Mech Methods. 2012;22:359–366. doi: 10.3109/15376516.2012.666650. [DOI] [PubMed] [Google Scholar]
- McConnell BK, Jones KA, Fatkin D, Arroyo LH, Lee RT, Aristizabal O, Turnbull DH, Georgakopoulos D, Kass D, Bond M, et al. Dilated cardiomyopathy in homozygous myosin-binding protein-C mutant mice. J Clin Invest. 1999;104:1771. doi: 10.1172/JCI7377C1. [DOI] [PMC free article] [PubMed] [Google Scholar]
- Movahed MR, Saito Y. Lack of association between obesity and left ventricular systolic dysfunction. Echocardiography. 2009;26:128–132. doi: 10.1111/j.1540-8175.2008.00764.x. [DOI] [PubMed] [Google Scholar]
- Muthusamy S, Shukla S, Amin MR, Cheng M, Orenuga T, Dudeja PK, Malakooti J. PKCdelta-dependent activation of ERK1/2 leads to upregulation of the human NHE2 transcriptional activity in intestinal epithelial cell line C2BBe1. Am J Physiol Gastrointest Liver Physiol. 2012;302:G317–G325. doi: 10.1152/ajpgi.00363.2011. [DOI] [PMC free article] [PubMed] [Google Scholar]
- Nakamura H, Moriyama Y, Makiyama T, Emori S, Yamashita H, Yamazaki R, Murayama T. Lactosylceramide interacts with and activates cytosolic phospholipase A2alpha. J Biol Chem. 2013;288:23264–23272. doi: 10.1074/jbc.M113.491431. [DOI] [PMC free article] [PubMed] [Google Scholar]
- Omura T, Yoshiyama M, Yoshida K, Nakamura Y, Kim S, Iwao H, Takeuchi K, Yoshikawa J. Dominant negative mutant of c-Jun inhibits cardiomyocyte hypertrophy induced by endothelin 1 and phenylephrine. Hypertension. 2002;39:81–86. doi: 10.1161/hy0102.100783. [DOI] [PubMed] [Google Scholar]
- Oyama K, Takahashi K, Sakurai K. Cardiomyocyte H9c2 cells exhibit differential sensitivity to intracellular reactive oxygen species generation with regard to their hypertrophic vs death responses to exogenously added hydrogen peroxide. J Clin Biochem Nutr. 2009;45:361–369. doi: 10.3164/jcbn.09-47. [DOI] [PMC free article] [PubMed] [Google Scholar]
- Perez NG, Nolly MB, Roldan MC, Villa-Abrille MC, Cingolani E, Portiansky EL, Alvarez BV, Ennis IL, Cingolani HE. Silencing of NHE-1 blunts the slow force response to myocardial stretch. J Appl Physiol (1985) 2011;111:874–880. doi: 10.1152/japplphysiol.01344.2010. [DOI] [PubMed] [Google Scholar]
- Planavila A, Rodriguez-Calvo R, de Arriba AF, Sanchez RM, Laguna JC, Merlos M, Vazquez-Carrera M. Inhibition of cardiac hypertrophy by triflusal (4-trifluoromethyl derivative of salicylate) and its active metabolite. Mol Pharmacol. 2006;69:1174–1181. doi: 10.1124/mol.105.016345. [DOI] [PubMed] [Google Scholar]
- Planavila A, Rodriguez-Calvo R, Jove M, Michalik L, Wahli W, Laguna JC, Vazquez-Carrera M. Peroxisome proliferator-activated receptor beta/delta activation inhibits hypertrophy in neonatal rat cardiomyocytes. Cardiovasc Res. 2005;65:832–841. doi: 10.1016/j.cardiores.2004.11.011. [DOI] [PubMed] [Google Scholar]
- Poornima IG, Parikh P, Shannon RP. Diabetic cardiomyopathy: The search for a unifying hypothesis. Circ Res. 2006;98:596–605. doi: 10.1161/01.RES.0000207406.94146.c2. [DOI] [PubMed] [Google Scholar]
- Post GR, Goldstein D, Thuerauf DJ, Glembotski CC, Brown JH. Dissociation of p44 and p42 mitogen-activated protein kinase activation from receptor-induced hypertrophy in neonatal rat ventricular myocytes. J Biol Chem. 1996;271:8452–8457. doi: 10.1074/jbc.271.14.8452. [DOI] [PubMed] [Google Scholar]
- Ranek MJ, Terpstra EJ, Li J, Kass DA, Wang X. Protein kinase g positively regulates proteasome-mediated degradation of misfolded proteins. Circulation. 2013;128:365–376. doi: 10.1161/CIRCULATIONAHA.113.001971. [DOI] [PMC free article] [PubMed] [Google Scholar]
- Ruppert C, Deiss K, Herrmann S, Vidal M, Oezkur M, Gorski A, Weidemann F, Lohse MJ, Lorenz K. Interference with ERK(Thr188) phosphorylation impairs pathological but not physiological cardiac hypertrophy. ProcNatl Acad Sci USA. 2013;110:7440–7445. doi: 10.1073/pnas.1221999110. [DOI] [PMC free article] [PubMed] [Google Scholar]
- Sandler H, Dodge HT. Left ventricular tension and stress in man. Circ Res. 1963;13:91–104. doi: 10.1161/01.res.13.2.91. [DOI] [PubMed] [Google Scholar]
- Sano M, Fukuda K, Sato T, Kawaguchi H, Suematsu M, Matsuda S, Koyasu S, Matsui H, Yamauchi-Takihara K, Harada M, et al. ERK and p38 MAPK, but not NF-kappaB, are critically involved in reactive oxygen species-mediated induction of IL-6 by angiotensin II in cardiac fibroblasts. Circ Res. 2001;89:661–669. doi: 10.1161/hh2001.098873. [DOI] [PubMed] [Google Scholar]
- Sbroggio M, Carnevale D, Bertero A, Cifelli G, De Blasio E, Mascio G, Hirsch E, Bahou WF, Turco E, Silengo L, et al. IQGAP1 regulates ERK1/2 and AKT signalling in the heart and sustains functional remodelling upon pressure overload. Cardiovasc Res. 2011;91:456–464. doi: 10.1093/cvr/cvr103. [DOI] [PMC free article] [PubMed] [Google Scholar]
- Semeniuk LM, Kryski AJ, Severson DL. Echocardiographic assessment of cardiac function in diabetic db/db and transgenic db/db-hGLUT4 mice. Am J Physiol Heart Circ Physiol. 2002;283:H976–H982. doi: 10.1152/ajpheart.00088.2002. [DOI] [PubMed] [Google Scholar]
- Sergeeva IA, Christoffels VM. Regulation of expression of atrial and brain natriuretic peptide, biomarkers for heart development and disease. Biochim Biophys Acta. 2013;1832:2403–2413. doi: 10.1016/j.bbadis.2013.07.003. [DOI] [PubMed] [Google Scholar]
- Shimoyama M, Hayashi D, Takimoto E, Zou Y, Oka T, Uozumi H, Kudoh S, Shibasaki F, Yazaki Y, Nagai R, et al. Calcineurin plays a critical role in pressure overload-induced cardiac hypertrophy. Circulation. 1999;100:2449–2454. doi: 10.1161/01.cir.100.24.2449. [DOI] [PubMed] [Google Scholar]
- Smith CC, Yellon DM. Adipocytokines, cardiovascular pathophysiology and myocardial protection. Pharmacol Therapeut. 2011;129:206–219. doi: 10.1016/j.pharmthera.2010.09.003. [DOI] [PubMed] [Google Scholar]
- Sugden PH, Clerk A. “Stress-responsive” mitogen-activated protein kinases (c-Jun N-terminal kinases and p38 mitogen-activated protein kinases) in the myocardium. Circ Res. 1998;83:345–352. doi: 10.1161/01.res.83.4.345. [DOI] [PubMed] [Google Scholar]
- Takimoto E, Champion HC, Li M, Belardi D, Ren S, Rodriguez ER, Bedja D, Gabrielson KL, Wang Y, Kass DA. Chronic inhibition of cyclic GMP phosphodiesterase 5A prevents and reverses cardiac hypertrophy. Nat Med. 2005;11:214–222. doi: 10.1038/nm1175. [DOI] [PubMed] [Google Scholar]
- Tanaka K, Honda M, Takabatake T. Redox regulation of MAPK pathways and cardiac hypertrophy in adult rat cardiac myocyte. J Am Coll Cardiol. 2001;37:676–685. doi: 10.1016/s0735-1097(00)01123-2. [DOI] [PubMed] [Google Scholar]
- Thaik CM, Calderone A, Takahashi N, Colucci WS. Interleukin-1 beta modulates the growth and phenotype of neonatal rat cardiac myocytes. J Clin Invest. 1995;96:1093–1099. doi: 10.1172/JCI118095. [DOI] [PMC free article] [PubMed] [Google Scholar]
- Unger RH, Orci L. Diseases of liporegulation: New perspective on obesity and related disorders. FASEB J. 2001;15:312–321. doi: 10.1096/fj.00-0590. [DOI] [PubMed] [Google Scholar]
- Vijayan K, Szotek EL, Martin JL, Samarel AM. Protein kinase C-alpha-induced hypertrophy of neonatal rat ventricular myocytes. Am J Physiol Heart Circ Physiol. 2004;287:H2777–H2789. doi: 10.1152/ajpheart.00171.2004. [DOI] [PubMed] [Google Scholar]
- Yang R, Barouch LA. Leptin signaling and obesity: Cardiovascular consequences. Circ Res. 2007;101:545–559. doi: 10.1161/CIRCRESAHA.107.156596. [DOI] [PubMed] [Google Scholar]
- Yang SJ, Chen CY, Chang GD, Wen HC, Chang SC, Liao JF, Chang CH. Activation of Akt by advanced glycation end products (AGEs): Involvement of IGF-1 receptor and caveolin-1. PLoS One. 2013;8:e58100. doi: 10.1371/journal.pone.0058100. [DOI] [PMC free article] [PubMed] [Google Scholar]
- Yang L, Qu M, Wang Y, Duan H, Chen P, Shi W, Danielson P, Zhou Q. Trichostatin A inhibits transforming growth factor-beta-induced reactive oxygen species accumulation and myofibroblast differentiation via enhanced NF-E2-related factor 2-antioxidant response element signaling. Mol Pharmacol. 2013;83:671–680. doi: 10.1124/mol.112.081059. [DOI] [PubMed] [Google Scholar]
- Yao W, Feng D, Bian W, Yang L, Li Y, Yang Z, Xiong Y, Zheng J, Zhai R, He J. EBP50 inhibits EGF-induced breast cancer cell proliferation by blocking EGFR phosphorylation. Amino Acids. 2012;43:2027–2035. doi: 10.1007/s00726-012-1277-z. [DOI] [PMC free article] [PubMed] [Google Scholar]
- Zheng Q, Su H, Ranek MJ, Wang X. Autophagy and p62 in cardiac proteinopathy. Circ Res. 2011;109:296–308. doi: 10.1161/CIRCRESAHA.111.244707. [DOI] [PMC free article] [PubMed] [Google Scholar]
- Zhong J, Basu R, Guo D, Chow FL, Byrns S, Schuster M, Loibner H, Wang XH, Penninger JM, Kassiri Z, et al. Angiotensin-converting enzyme 2 suppresses pathological hypertrophy, myocardial fibrosis, and cardiac dysfunction. Circulation. 2010;122:717–728. doi: 10.1161/CIRCULATIONAHA.110.955369. 718 p following 728. [DOI] [PubMed] [Google Scholar]
- Zhou H, Shen DF, Bian ZY, Zong J, Deng W, Zhang Y, Guo YY, Li H, Tang QZ. Activating transcription factor 3 deficiency promotes cardiac hypertrophy, dysfunction, and fibrosis induced by pressure overload. PloS One. 2011;6:e26744. doi: 10.1371/journal.pone.0026744. [DOI] [PMC free article] [PubMed] [Google Scholar]
Associated Data
This section collects any data citations, data availability statements, or supplementary materials included in this article.


