

Abstract
Though aspirin is a well-established antiplatelet agent, the mechanisms of aspirin resistance remain poorly understood. Metabolomics allows for measurement of hundreds of small molecules in biological samples enabling detailed mapping of pathways involved in drug response. We defined the metabolic signature of aspirin exposure in subjects from the Heredity and Phenotype Intervention (HAPI) Heart Study. Many metabolites, including known aspirin catabolites, changed upon exposure to aspirin and pathway enrichment analysis identified purine metabolism as significantly affected by drug exposure. Further, purines were associated with aspirin response and poor responders had higher post-aspirin adenosine and inosine than good responders (N=76;p<4×10⁻³ both). Using our established “pharmacometabolomics-informs-pharmacogenomics” approach we identified genetic variants in adenosine kinase (ADK) associated with aspirin response. Combining metabolomics and genomics allowed for more comprehensive interrogation of mechanisms of variation in aspirin response - an important step toward personalized treatment approaches for cardiovascular disease.
Introduction
Aspirin is one of the most commonly used medications worldwide and, as an antiplatelet agent, is employed for both primary prevention of cardiovascular disease (CVD) and secondary prevention of recurrent cardiovascular events following a myocardial infarction.(1) Aspirin’s antiplatelet actions can significantly reduce the risk of cardiovascular death, but atherothrombotic events (i.e. clinical aspirin resistance) are relatively common and ~25% of high risk patients show persistent platelet reactivity (i.e. laboratory aspirin resistance) while on aspirin therapy.(2, 3)
Though well documented, the mechanisms underlying aspirin resistance are not completely understood. Heritability estimates suggest a genetic component to aspirin resistance(4), but few genetic variants have been identified.(5) Aspirin acts by irreversibly inhibiting cyclooxygenase-1(COX1) and blocking conversion of arachidonic acid to the potent platelet agonist thromboxane A2.(6) Incomplete inhibition of COX1 by aspirin has been observed in several settings, however poor response despite complete inhibition of COX1 has also been reported.(3, 7) Identification of novel pathways involved in aspirin resistance could help clarify this mechanism.
Genomic and, more recently, metabolomic approaches have both been employed separately in the study of CVD predictors and treatment outcomes. Early successes in the CVD arena include discovery of the CYP2C19*2 variant in clopidogrel response, identification of citric acid cycle metabolites that may be useful in diagnosis of myocardial ischemia, and the association between branched-chain amino acids and dietary lipid phosphatidylcholine with coronary artery disease.(8-10) Further, we have used a variety of metabolomics tools to map global effects of drugs on metabolism and to map pathways linked to variation in response.(11-14) While these pharmacometabolomic studies have been successful in their own right, there has been additional success when this technology is harnessed to robust genomic methodologies using an approach coined pharmacometabolomic-informed-pharmacogenomics.(15-17)
With this in mind, we have employed both of these complimentary technologies to investigate novel mechanisms of aspirin resistance. We first conducted metabolomic profiling of serum samples from healthy subjects before and after low-dose aspirin therapy to characterize the metabolomic signature of aspirin exposure and identify important pathways affected. We extended these findings by investigating the differences in metabolomic profiles between good and poor responders on aspirin. Finally, we used information from metabolomic profiling to conduct focused genetic association analyses using this pharmacometabolomic-informed-pharmacogenomics approach.
Results
Participant Characteristics
In the current analysis, samples from 76 healthy volunteers who underwent a two-week aspirin intervention as part of the Heredity and Phenotype Intervention (HAPI) Heart Study were selected for metabolomic profiling.(18) Participant characteristics are provided in Table 1. Specifically, pre- and post-aspirin serum samples were profiled for 40 good responders and 36 poor responders (as measured by change in collagen-stimulated ex vivo platelet aggregation), using an untargeted gas-chromatography (GC)-MS-based metabolomics platform. As designed, aspirin intervention lowered collagen stimulated platelet aggregation in good but not poor responders (p<1×10⁻³). Collagen stimulated aggregation was slightly higher in poor vs. good responders pre-aspirin (p=0.02) and significantly higher in poor responders post-aspirin (p<1×10⁻³). Arachidonic acid stimulated aggregation was slightly higher in poor responders both pre- and post-aspirin intervention (p<0.02 both) but there was no difference in change in aggregation between the groups (p=0.97). Samples were selected to be approximately half men and half women in each group. No difference between good and poor responders was observed for age or body mass index.
Table 1.
Participant Characteristics
| Good responders (N=40) | Poor responders (N=36) | p-value | |
|---|---|---|---|
| Demographics | |||
| Gender* (%Men [N]) | 50% [20] | 47% [17] | 0.81 |
| Age (year) | 44.0±14.4 | 42.8±12.2 | 0.69 |
| BMI (kg/m2) | 26.5±4.4 | 26.2±4.3 | 0.78 |
| Platelet aggregation, collagen 2 μg/mL | |||
| Before aspirin (Ω) | 13.3±1.9 | 14.2±1.9 | 0.05 |
| After aspirin (Ω) | 5.7±1.9 | 14.2±1.9 | <0.0001 |
| Change* (Ω) | -7.6 ±2.1 | 0.03±2.3 | <0.0001 |
| Platelet aggregation, arachidonic acid | |||
| Before aspirin (Ω) | 9.4±2.8 | 11.0±3.0 | 0.02 |
| After aspirin (Ω) | 0.4±1.3 | 2.0±3.5 | 0.01 |
| Change (Ω) | -9.0 ±3.2 | -9.1±4.4 | 0.97 |
Samples were categorized as good and poor responders based on change in collagen stimulated ex vivo platelet aggregation and selected to have approximately equal numbers of men and women in each category.
Changes in Metabolite Levels Post-Aspirin Intervention
Multi-level principal component analysis (ML-PCA) was used to investigate the largest sources of variation in serum metabolic profiles of all participants, using the 180 known metabolites measured by GC-MS. While the first two principal components did not distinguish between samples groups, pre- and post-aspirin samples were separated by the third principal component (see Supplemental Information). Using linear mixed models to analyze individual metabolites we found eighteen metabolites significantly altered by aspirin intervention in all 76 participants (Table 2). The two metabolites with the largest magnitude of change were known aspirin catabolites - salicylic acid and salicyluric acid. To identify novel pathways implicated in aspirin exposure, pathway enrichment analysis was performed using the other sixteen metabolites. Interestingly, we observed that the “Purine Metabolism” pathway was significantly affected by aspirin exposure (p=0.003), with significant changes for six metabolites involved in this pathway. Specifically, adenosine 5’-phosphate (AMP), inosine, guanosine and adenosine levels were increased (p≤0.004 for all) in post-aspirin compared to pre-aspirin samples. In contrast, hypoxanthine and xanthine levels were decreased (p<1×10⁻³ for both) post-aspirin. Uric acid, the end product of this pathway, was not significantly associated with aspirin exposure.
Table 2.
Changes in Individual Metabolite Levels Post-Aspirin
| Metabolite | HMDB ID | Before Aspirin | After Aspirin | Change | P-value |
|---|---|---|---|---|---|
| Salicylic acid | HMDB01895 | 0.1±0.4 | 1.8±0.8 | ↑ | <1×10⁻³ |
| Salicyluric acid | HMDB00840 | 0.5±0.2 | 1.4±0.9 | ↑ | <1×10⁻³ |
| Azelaic acid | HMDB00784 | 1.3±0.9 | 0.6±0.4 | ↓ | <1×10⁻³ |
| D-Ribose | HMDB00283 | 1.3±1.1 | 0.6±0.7 | ↓ | <1×10⁻³ |
| L-Aspartic acid | HMDB00191 | 1.2±0.3 | 0.7±0.2 | ↓ | <1×10⁻³ |
| Inosine* | HMDB00195 | 0.7±0.7 | 1.2±0.8 | ↑ | <1×10⁻³ |
| Guanosine* | HMDB00133 | 0.7±0.5 | 1.2±0.7 | ↑ | <1×10⁻³ |
| Adenosine-5-monophosphate* | HMDB00045 | 0.8±0.2 | 1.1±0.6 | ↑ | <1×10⁻³ |
| Oleic acid | HMDB00207 | 1.1±0.5 | 0.8±0.6 | ↓ | <1×10⁻³ |
| Palmitoleic acid | HMDB03229 | 1.1±0.7 | 0.8±0.8 | ↓ | <1×10⁻³ |
| Linoleic acid | HMDB00673 | 1.1±0.4 | 0.8±0.6 | ↓ | <1×10⁻³ |
| Hypoxanthine* | HMDB00157 | 1.1±0.6 | 0.8±0.5 | ↓ | <1×10⁻³ |
| Shikimic acid | HMDB03070 | 1.1±0.4 | 0.8±0.3 | ↓ | <1×10⁻³ |
| Xanthine* | HMDB00292 | 1.1±0.4 | 0.8±0.4 | ↓ | <1×10⁻³ |
| Arachidonic acid | HMDB01043 | 1±0.3 | 0.9±0.4 | ↓ | 0.002 |
| 3-Phosphoglyceric acid | HMDB00807 | 1.1±0.4 | 0.8±0.2 | ↓ | 0.003 |
| Adenosine* | HMDB00050 | 0.8±0.7 | 1.1±0.9 | ↑ | 0.004 |
| 2,5-Furandicarboxylic acid | HMDB04812 | 0.9±0.4 | 1±0.5 | ↑ | 0.008 |
Data represent standardized mean ± SD of metabolite levels for all individuals (N=76), divided by mean metabolite level detected in this study. P-values calculated using LMM. Only metabolites with p<0.05 and q<0.1 are displayed.
Indicates member of Purine Metabolism pathway.
Post hoc power calculations were completed and showed that we had 89% power to identify differences between pre- and post-aspirin samples assuming a standard deviation of 0.75 and difference of 0.28 (which we observed for AMP).
Purine Metabolite Differences Between Good and Poor Responders
Based on our pathway enrichment analysis, we next evaluated whether purine metabolites were differentially affected by aspirin intervention in good vs. poor responders. We employed the same linear mixed models approach separately in the 2 response groups for 7 purine metabolites successfully measured by GC-MS: AMP, adenosine, inosine, guanosine, xanthine, hypoxanthine and uric acid. We also evaluated differences in purine metabolite levels of good vs. poor responders both pre- and post-aspirin intervention. Results of these analyses are depicted in Figure 1. Although inosine levels were significantly higher post-aspirin in both good and poor responders (p=<2×10⁻³ both), the post-aspirin level of inosine was significantly higher in the poor compared to good responders (p=0.003). Adenosine was increased in poor responders upon aspirin exposure (p=4×10⁻³), and post-aspirin levels were also significantly higher in poor responders compared to good responders (p=0.02). Metabolites located in other branches (guanosine) or downstream from the pathway (hypoxanthine and xanthine) were significantly affected by aspirin exposure, but changes were similar in both response groups. Since sex differences in aspirin response are well established(19) we included sex as a covariate in all analyses and also tested for association with pre- and post-aspirin purine metabolite levels. While sex was associated with both pre- and post-intervention inosine and uric acid levels, we did not detect a significant interaction between sex and aspirin response for any purine metabolites.
Figure 1.
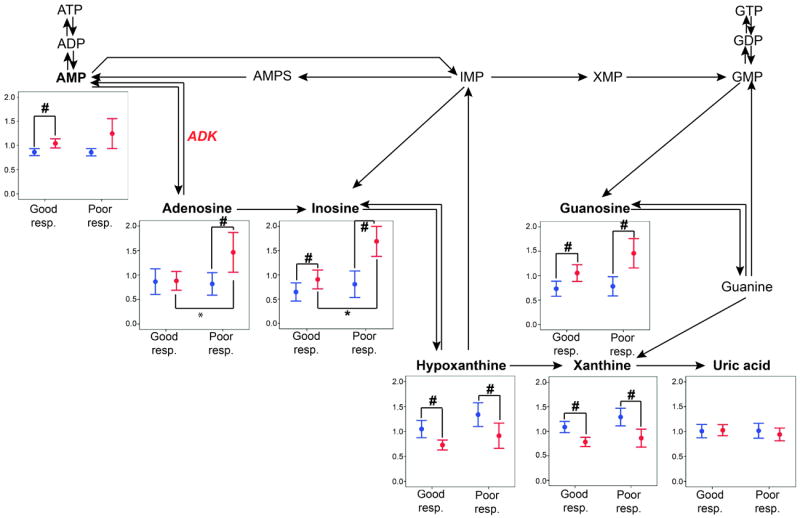
Data represents standardized mean and standard error of metabolite levels before (blue) and after (red) aspirin therapy in good vs. poor responders. Metabolites in bold were measured in this study. #:p<0.05 for testing the difference in metabolite levels after vs. before aspirin. *:p<0.05 for testing the difference in metabolite levels in good vs. poor responders. Key: ATP, ADP and AMP: adenosine tri-, di- and mono-phosphate, AMPS: adenylosuccinate, IMP: inosine monophosphate, XMP: xanthosine monophosphate, GTP, GDP, GMP: guanosine tri-, di- and monophosphate, ADK: adenosine kinase.
Replication of Purine Metabolite Findings
Inosine, guanosine, hypoxanthine, xanthine and uric acid were successfully measured in a replication group of N=37 additional subjects from the HAPI study who were either good (N=19) or poor responders (N=18). As in the original sample, we observed higher levels of inosine (p<10-3) and lower levels of hypoxanthine (p=0.005) in post-aspirin vs. pre-aspirin samples. Further we observed significant differences in inosine levels between good and poor responders to aspirin therapy (see Supplemental Information). Specifically, inosine levels were higher in poor responders both pre and post-aspirin intervention (p=0.005 and p=0.05 respectively). Adenosine and AMP were unable to be measured in this replication sample.
Genetic Association of Purine Related Genes and Platelet Aggregation
Since the pharmacometabolomic findings implicated the purine metabolism pathway in aspirin response, we used our “Pharmacometabolomics-Informs-Pharmacogenomics” approach to identify candidate genes. Specifically, we selected nine genes directly involved in biosynthesis, degradation or transport of purine metabolites (Table 3), and conducted association analyses between single nucleotide polymorphisms (SNPs) in these gene regions and ex vivo platelet aggregation. We used data from 718 HAPI study participants who underwent aspirin intervention. 1,035 SNPs in the nine gene regions had high-quality imputation scores (r2>0.3), were observed at an appreciable frequency (>5% minor allele frequency), and were used for subsequent analyses.
Table 3.
Purine Pathway Candidate Genes
|
|
Gene
|
||
|---|---|---|---|
| Role | Name | Symbol | Function |
| Synthesis & salvage | AMP 5’ nucleotidase | NT5C1A | Converts AMP to adenosine |
| Adenosine deaminase | ADA | Converts adenosine to inosine | |
| Adenosine kinase | ADK | Converts adenosine to AMP | |
| AMP deaminase 1 | AMPD1 | Converts AMP to IMP | |
| AMP deaminase 2 | AMPD2 | Converts AMP to IMP | |
| AMP deaminase 3 | AMPD3 | Converts AMP to IMP | |
| Transport | ATP-binding cassette C4 | ABCC4 | Transports adenine nucleotides inside platelets and into dense granules |
| Degradation | Purine nucleoside phosphorylase | PNP | Converts inosine to hypoxanthine |
| Xanthine oxidase | XDH | Converts hypoxanthine to xanthine | |
Using a false discovery rate (FDR) cut-off of α=0.01, we identified 51 SNPs in the adenosine kinase (ADK) gene region that were associated with change in platelet aggregation during aspirin therapy (p<5×10⁻⁴). The most strongly associated SNP in this region is the intronic variant rs16931294. The less common G allele was associated with higher platelet aggregation post-aspirin than the more common A allele (β=0.8; p.=3.4×10⁻⁴), so on average, individuals with the GG genotype had ~1.6Ω higher post-aspirin platelet aggregation than individuals with the AA genotype after accounting for age, sex and pre-aspirin aggregation value.
We next utilized data from 341 subjects from the Pharmacogenomics of Antiplatelet Intervention (PAPI) study to replicate this finding. The PAPI study measured platelet aggregation at three time points, before any antiplatelet intervention, after a one-week intervention with clopidogrel, another widely used antiplatelet agent targeting a platelet ADP receptor, and after addition of one, 81mg dose of aspirin to the clopidogrel regimen. We tested rs16931294 for association with post-aspirin+clopidogrel ex vivo platelet aggregation while adjusting for age, sex and clopidogrel only aggregation and again observed that the G allele was associated with higher platelet aggregation (β=1.9; p=0.002).
Association of rs16931294 with Metabolite Levels
We conducted exploratory analyses to determine whether rs16931294 in ADK was associated with pre- and post-aspirin purine pathway metabolites. These exploratory analyses were carried out in 74 participants who had available metabolomic and genomic data. Despite the small sample size, the G allele of rs16931294 was significantly associated with higher pre-aspirin levels of AMP (p=0.04), xanthine (p=0.01) and hypoxanthine (p=0.02) compared to the A allele. Post-aspirin levels of inosine (p=0.007) and guanosine (p=0.02) are also higher for the G compared to the A allele (Figure 2).
Figure 2.

Levels of purine metabolites are presented by genotype for pre-aspirin (blue) and post-aspirin (red) samples. * indicates significant additive association analysis (p<0.05). Genotype specific samples sizes are AA=43, AG=29, GG=2. Uric Acid was not significant by genotype group for either pre- or post-aspirin measures (see Supplemental Information).
Ratios of Metabolites to AMP
Since ADK is involved in the conversion of adenosine to AMP, we assessed the ratios of other purine metabolites to AMP in good and poor responders. We observed significantly higher levels of the adenosine-to-AMP (p=0.008) and the inosine-to-AMP (p=0.005) ratios in the poor responders as compared to good responders after aspirin exposure (see Supplemental Information). We also observed significant associations between rs16931294 genotype and the inosine-to-AMP ratio (p=0.002) and guanosine-to-AMP ratio (p=0.02) after aspirin intervention as well as uric acid-to-AMP ratio before aspirin (p=0.05; see Supplemental Information).
Discussion
In this study, we investigated the metabolic signature of aspirin exposure in healthy volunteers using untargeted GC-MS metabolomic profiling. We first observed that aspirin significantly affected metabolites involved in purine catabolism in the overall population. Further analysis showed differential changes in purine metabolites in good compared to poor responders which was replicated in an independent sample and informed our pharmacogenomic investigation. Our data provide compelling evidence of the importance of purine metabolism in aspirin’s mechanism of action and variation in response.
As part of the general metabolic signature of aspirin exposure, we observed significantly higher concentrations of inosine and adenosine after aspirin in accordance with previous studies that demonstrated both of these as inhibitors of platelet aggregation. Adenosine activates the adenosine A2 receptor on the surface of platelets, which in turn stimulates adenylate cyclase, increases cAMP levels, and lowers intracellular calcium concentration thereby reducing platelet aggregation.(20) Adenosine reduces recurrent thrombosis, alters blood flow after coronary hypoperfusion, and improves arterial patency.(21) Inosine has been shown to inhibit platelet aggregation, lower intracellular calcium concentration, and reduce collagen-induced thromboxane A2 formation.(22) Further, Hsiao et al. reported that inosine substantially attenuates middle cerebral artery occlusion-induced focal cerebral ischemia with a 34% reduction in infarct size in inosine-treated rats compared to controls, suggesting that inosine may help improve outcomes following ischemia-reperfusion brain injury or other thromboembolic diseases.(22)
The observation of higher post-aspirin levels of adenosine and inosine in poor-responders compared to good-responders is not completely understood. Thrombosis is a tightly regulated process, and we do not know if the increased concentration of adenosine and inosine is a cause or consequence of the poor response to aspirin. While further functional work is needed, we posit three mechanisms that may be responsible for these observations. First, extracellular adenosine levels mainly stem from phospho-hydrolysis of precursor nucleotides such as ATP, ADP and AMP(23), and we speculate that our results reflect higher levels of one or more of these metabolites. ADP is a well-described pro-aggregant molecule and previous publications have already described aspirin resistance related to increased sensitivity of platelets to ADP.(24) Second rapid adenosine transport is the major regular for adenosine in plasma(23), and we could also speculate that higher serum levels may be indicative of poor uptake by platelets or other cells. Finally, differences in intracellular purine metabolism by enzymes such as ADK could contribute to the observed difference between good and poor responders.
We also observed a significant increase in guanosine levels in both good- and poor-responders after aspirin. The effect of guanosine on platelet function is unclear, but the role of downstream derivatives of guanosine on platelet function is well-established. One derivative, cGMP, plays a critical role in platelet aggregation and regulating vascular function. Abnormal cGMP signalling or production can result in coronary artery disease, atherosclerosis, and hypertension.(25) Guanosine is also believed to regulate extracellular adenosine by inhibiting adenosine disposition into several types of human cells(26) which could further influence aggregation.
Hypoxanthine and xanthine decreased in both good- and poor-responders after aspirin intervention. Hypoxanthine is converted directly into xanthine via xanthine oxidase, and prior investigations have shown that the interaction between xanthine and xanthine oxidase produces reactive oxygen species (e.g. superoxide), which results in activation, aggregation, and release reaction of platelets.(27, 28) Given these data, we speculate whether aspirin leads to decreased hypoxanthine and xanthine levels thereby minimizing reactive oxygen species generation and inhibiting the pro-thrombotic effect they have on platelets. Xanthine oxidase also metabolizes xanthine into uric acid, a potent risk factor for CVD, but we did not observe differences in uric acid levels after aspirin unlike previous reports.(29, 30)
Our study illustrates the power of untargeted metabolic profiling to identify new metabolic pathways implicated in a drug’s mechanism of action; in this case, the purine metabolic pathway in aspirin exposure. While individual purines have been previously implicated in platelet biology, this untargeted approach allowed us to quickly hone in on the purine pathway, inform our genomic inquiries and generate repeatable results. A limitation of such untargeted approaches is that several metabolites from the pathway (e.g. ADP) were not measured, furthermore, we were unable to measure AMP and adenosine in our replication sample. Based on these findings, we believe a more comprehensive assessment of purine metabolites in a larger sample is warranted and could shed further light on the mechanism of purine metabolism in aspirin response. The current analysis was performed in healthy volunteers, which is advantageous in that it minimizes confounding, but additional studies in coronary artery disease patients are needed to assess clinical outcomes.
These pharmacometabolomic findings informed our pharmacogenomic investigation where we identified variants in ADK associated with both aspirin response and purine metabolite levels. The ADK enzyme catalyses the formation of adenosine to AMP by transferring the gamma-phosphate of ATP to adenosine and is an important regulator of extracellular adenosine.(31) We identified several associated SNPs in this attractive candidate gene including the intronic variant rs16931294. The G allele of this variant was associated with poor response to aspirin and higher post-aspirin inosine levels which is consistent with our observation that higher post-aspirin inosine is associated with poor aspirin response. Despite being on concurrent clopidogrel therapy, we were able to replicate the genetic association between ADK variants and platelet aggregation measures in the PAPI study. No association between genotype and adenosine-to-AMP ratio was detected, but we did observe significant associations with inosine-to-AMP and guanosine-to-AMP ratios. Adenosine is quickly removed from the blood into red blood cells and our results may not reflect intracellular metabolite levels which may explain the lack of association.(32) ADK is a notably large gene with expansive blocks of linkage disequilibrium so our most associated variant rs16931294 is unlikely the causal mutation. Further genetic association studies with diverse populations would be advantageous for identifying likely causal variants so functional studies could be performed.
While pharmacogenomics alone has identified genetic variants of large effect size for other drugs, there has been limited success during the genome-wide association era identifying underlying genetic variation to aspirin response despite its common use in medicine. This may be due to the complex mechanism in which aspirin works and more targeted approaches to gene discovery may be warranted. Our pharmacometabolomics investigation not only identified novel metabolic pathways on its own but also successfully informed our pharmacogenomic investigation. The present investigation illustrates that the combined use of pharmacometabolomics and pharmacogenomics represents a promising approach to understanding mechanisms of resistance in anti-platelet therapy and toward individualizing aspirin therapy.
Methods
Study design and population
The HAPI Heart Study was initiated in 2003 to measure cardiovascular response to short-term interventions and identify the genetic and environmental determinants of these responses.(18) Participants were members of the Old Order Amish population from Lancaster County, PA, at least 20 years of age and relatively healthy. As part of the HAPI study, 745 participants participated in a short-term aspirin intervention(19) of one 81mg aspirin/day for 14 consecutive days. Ex vivo platelet aggregometry was performed prior to aspirin therapy and again the morning after the last dose. Intervention compliance was high and monitored by medication inventory. Details on sample collection and ex vivo platelet testing are provided in the supplement.
In the present metabolomics study, samples originated from 76 HAPI participants. Participants were grouped into sex-specific quartiles of aspirin response measured by post-aspirin collagen-stimulated (2μg/mL) platelet aggregation adjusted for participant age and pre-aspirin, collagen-stimulated platelet aggregation. Non-first-degree relatives from the 1st (good responders) and the 4th (poor responders) sex-specific drug-response quartiles were selected for metabolic profiling. Samples from 39 women (20 good responders, 19 poor responders) and 37 men (20 good responders, 17 poor responders) were used in the current analysis. Metabolomic profiling in a replication set of 49 HAPI participants (19 good and 20 poor responders) was performed to validate findings.
All study procedures were in accordance with the Declaration of Helsinki. The study was approved by the Institutional Review Board of the University of Maryland, Baltimore, and other participating institutions and was monitored by an external Data Safety and Monitoring Board. Participants provided informed consent, including permission to contact relatives, before participation.
Metabolite Measurement by GC-MS
Fifteen μl aliquots were extracted by 1μl of degassed acetonitrile:isopropanol:water (3:3:2) at −20°C, centrifuged and decanted with subsequent evaporation of the solvent to complete dryness. A clean-up step with acetonitrile/water (1:1) removed membrane lipids and triglycerides and the supernatant was dried down again. Internal standards C8-C30 FAMEs were added and the sample was derivatized with methoxyamine hydrochloride in pyridine and subsequently by MSTFA (Sigma-Aldrich) for trimethylsilylation of acidic protons.
A Gerstel MPS2 automatic liner exchange system was used to inject 1 ml of sample at 50°C (ramped to 250°C) in splitless mode with a 25-second splitless time. An Agilent 6890 gas chromatograph (Santa Clara, CA) was used with a 30m long, 0.25mm i.d. Rtx5Sil-MS column with 0.25μm 5% diphenyl film; an additional 10m integrated guard column was used (Restek, Bellefonte PA). Chromatography was performed at a constant flow of 1 ml/minute, ramping the oven temperature from 50°C to 330°C over 22 minutes. MS used a Leco Pegasus IV time of flight (TOF)-MS with 280°C transfer line temperature, electron ionization at -70V and an ion source temperature of 250°C. Mass spectra were acquired from m/z 85-500 at 20 spectra/second and 1750 V detector voltage. Result files were exported to our servers and further processed by our metabolomics BinBase database(33). All database entry in BinBase(34) were matched against the Fiehn mass spectral library of 1,200 authentic metabolite spectra using retention index and mass spectrum information or the NIST05 commercial library.
Statistical Analysis
Additional analysis methods including pathway enrichment analysis, multi-level PCA and replication analyses in PAPI are provided in the supplemental.
Metabolomics data analysis
Missing ion intensity values were assumed to result from areas falling below detection limits and were imputed with the observed minimum for that metabolite divided by 2. To improve normality, metabolite response values were log-transformed before statistical investigation. The metabolite response values obtained with the GC-MS platform do not represent real concentrations and cannot be used for making quantitative comparisons between metabolites. To improve readability, we report standardized metabolite values which are metabolite values divided by the mean metabolite value for this in all study samples in all tables and figures.
Linear mixed models (LMM)
Significance of the effects of aspirin and phenotype on metabolite level was assessed by linear modeling and linear mixed modeling in GenStat 14th edition (VSN International, Hemel Hempstead, UK, www.GenStat.co.uk).
The first global LMM included all data for each metabolite:
| (1) |
in which i=1,2…81, yi,t=vector of metabolite concentrations for the ith individual at time t; t=time (before/after aspirin); gender=men or women; phenotype=good or poor responder; α0…α6=regression coefficients; δi= random effect associated with the ith individual; εi,t=error term.
The second linear model included data before aspirin:
| (2) |
The third linear model included data after aspirin:
| (3) |
Model (1) was fitted for each 180 metabolites and the effect of aspirin on metabolite level was considered significant when p<0.05 for α1. False Discovery Rate (FDR) with a significance threshold q<0.1 was used to address multiple comparisons.
All three models were fitted for each purine metabolite and purine metabolite ratios. Model (1) was fitted again, without the “phenotype” effect, using the population of good (or poor) responders only, and the main effect of aspirin exposure was investigated as previously. Models (2) and (3) were fitted to investigate the effect of phenotype, which was considered significant pre- and post-aspirin when p<0.05 for β2 or γ2 respectively.
Genetic analyses
The HAPI Heart Study has extensive, existing genotyping data, including genome-wide association genotyping and genotype imputation. Detailed genetic analysis methods are provided in the supplementary material but in brief:
We conducted genetic association analyses of ex vivo platelet aggregation in HAPI (n=718) with SNPs falling in candidate gene regions identified by metabolomics analyses. We defined candidate gene regions as the full transcript +/-30kb to include proximal regulatory regions. The association with ex vivo platelet aggregation was replicated in the PAPI study for the most strongly associated SNP, rs16931294. We also conducted association analysis between rs16931294 and relevant purine metabolite levels. All analyses account for age, sex, pre-aspirin platelet aggregation and family structure.
Supplementary Material
Study Highlights.
What is the current knowledge on the topic?
Mechanisms of aspirin resistance are not well established. Additional studies may provide insights about mechanisms of clinical resistance to aspirin and approaches to modify therapy for patients who are resistant and have poor clinical outcomes.
What question did this study address?
The current study sought to use pharmacometabolomic and pharmacogenomic approaches to identify potential mechanisms of aspirin resistance and to map implicated pathways.
What this study adds to our knowledge?
This study identified purine metabolites including inosine and adenosine that are associated with variation in aspirin response. Further, variants in the adenosine kinase (ADK) gene were associated with levels of ex vivo platelet aggregation.
How this might change clinical pharmacology and therapeutics?
In addition to identifying the potential importance of purine metabolism in aspirin response, this study highlights the power of combining metabolomics and genomic approaches to more comprehensively interrogate the biological mechanisms of drug response – a step towards more personalized approaches to therapy.
Acknowledgments
The authors would like to thank Dr. Margriet Hendriks and Dr. Fred van Eeuwijk for their helpful advices on linear mixed modelling and Keith Tanner for his help with sample preparation. We acknowledge the editorial assistance of Jon Kilner, MS, MA (Pittsburgh).
The National Institutes of Health supported this study through (RC2GM092729) as part of the American Recovery and Reinvestment Act (ARRA). Work was implemented by the Pharmacometabolomics Research Network. The effort of Dr. Ellero-Simatos was supported by the research programme of the Netherlands Metabolomics Centre (NMC), part of The Netherlands Genomics Initiative/Netherlands Organization for Scientific Research; HAPI was supported by grants (U01-HL72515), the University of Maryland General Clinical Research Center (GCRC;M01-RR-16500), the Johns Hopkins University GCRC (M01-RR-000052), National Center for Research Resources, and the Clinical Nutrition Research Unit of Maryland (P30-DK072488). The PAPI Study was supported by NIH (U01-GM074518) and (U01-HL105198). The effort of Dr. Beitelshees was supported by NIH grant (K23-HL091120) and Dr. Lewis was supported by NIH grants (T32-HL72751) and (K23-GM102678).
Footnotes
Kaddurah-Daouk, Yerges-Armstrong, Ellero-Simatos, Georgiades, Lewis, Beitelshees, Reijmers, and Hankemeier Wrote Manuscript
Kaddurah-Daouk, Yerges-Armstrong, Ellero-Simatos, Georgiades, Horenstein, Beitelshees, Hankemeier, and Shuldiner Designed Research Horenstein, Dane, Fiehn, and Shuldiner Performed Research
Yerges-Armstrong, Ellero-Simatos, Georgiades, Zhu, Dane, Hankemeier, and Fiehn Analyzed Data
CONFLICT OF INTEREST STATEMENT
Dr. Kaddurah-Daouk is an inventor on patents in the metabolomics field.
References
- 1.Collaboration AT. Collaborative meta-analysis of randomised trials of antiplatelet therapy for prevention of death, myocardial infarction, and stroke in high risk patients. BMJ. 2002;324:71–86. doi: 10.1136/bmj.324.7329.71. [DOI] [PMC free article] [PubMed] [Google Scholar]
- 2.Hovens MM, Snoep JD, Eikenboom JC, van der Bom JG, Mertens BJ, Huisman MV. Prevalence of persistent platelet reactivity despite use of aspirin: a systematic review. American heart journal. 2007;153:175–81. doi: 10.1016/j.ahj.2006.10.040. [DOI] [PubMed] [Google Scholar]
- 3.Wong S, Appleberg M, Ward CM, Lewis DR. Aspirin resistance in cardiovascular disease: a review. Eur J Vasc Endovasc Surg. 2004;27:456–65. doi: 10.1016/j.ejvs.2003.12.025. [DOI] [PubMed] [Google Scholar]
- 4.Faraday N, et al. Heritability of platelet responsiveness to aspirin in activation pathways directly and indirectly related to cyclooxygenase-1. Circulation. 2007;115:2490–6. doi: 10.1161/CIRCULATIONAHA.106.667584. [DOI] [PubMed] [Google Scholar]
- 5.Goodman T, Ferro A, Sharma P. Pharmacogenetics of aspirin resistance: a comprehensive systematic review. British journal of clinical pharmacology. 2008;66:222–32. doi: 10.1111/j.1365-2125.2008.03183.x. [DOI] [PMC free article] [PubMed] [Google Scholar]
- 6.Patrignani P, Filabozzi P, Patrono C. Selective cumulative inhibition of platelet thromboxane production by low-dose aspirin in healthy subjects. The Journal of clinical investigation. 1982;69:1366–72. doi: 10.1172/JCI110576. [DOI] [PMC free article] [PubMed] [Google Scholar]
- 7.Ohmori T, et al. Aspirin resistance detected with aggregometry cannot be explained by cyclooxygenase activity: involvement of other signaling pathway(s) in cardiovascular events of aspirin-treated patients. J Thromb Haemost. 2006;4:1271–8. doi: 10.1111/j.1538-7836.2006.01958.x. [DOI] [PubMed] [Google Scholar]
- 8.Shuldiner AR, et al. Association of cytochrome P450 2C19 genotype with the antiplatelet effect and clinical efficacy of clopidogrel therapy. JAMA. 2009;302:849–57. doi: 10.1001/jama.2009.1232. [DOI] [PMC free article] [PubMed] [Google Scholar]
- 9.Sabatine MS, et al. Metabolomic identification of novel biomarkers of myocardial ischemia. Circulation. 2005;112:3868–75. doi: 10.1161/CIRCULATIONAHA.105.569137. [DOI] [PubMed] [Google Scholar]
- 10.Shah SH, et al. Association of a peripheral blood metabolic profile with coronary artery disease and risk of subsequent cardiovascular events. Circulation Cardiovascular genetics. 2010;3:207–14. doi: 10.1161/CIRCGENETICS.109.852814. [DOI] [PubMed] [Google Scholar]
- 11.Kaddurah-Daouk R, et al. Enteric microbiome metabolites correlate with response to simvastatin treatment. PLoS One. 2011;6:e25482. doi: 10.1371/journal.pone.0025482. [DOI] [PMC free article] [PubMed] [Google Scholar]
- 12.Kaddurah-Daouk R, et al. Lipidomic analysis of variation in response to simvastatin in the Cholesterol and Pharmacogenetics Study. Metabolomics. 2010;6:191–201. doi: 10.1007/s11306-010-0207-x. [DOI] [PMC free article] [PubMed] [Google Scholar]
- 13.Kaddurah-Daouk R, et al. Pretreatment metabotype as a predictor of response to sertraline or placebo in depressed outpatients: a proof of concept. Transl Psychiatry. 2011;1 doi: 10.1038/tp.2011.22. [DOI] [PMC free article] [PubMed] [Google Scholar]
- 14.Trupp M, et al. Metabolomics reveals amino acids contribute to variation in response to simvastatin treatment. PLoS One. 2012;7:e38386. doi: 10.1371/journal.pone.0038386. [DOI] [PMC free article] [PubMed] [Google Scholar]
- 15.Ji Y, et al. Glycine and a glycine dehydrogenase (GLDC) SNP as citalopram/escitalopram response biomarkers in depression: pharmacometabolomics-informed pharmacogenomics. Clinical pharmacology and therapeutics. 2011;89:97–104. doi: 10.1038/clpt.2010.250. [DOI] [PMC free article] [PubMed] [Google Scholar]
- 16.Kaddurah-Daouk R, Krishnan KR. Metabolomics: a global biochemical approach to the study of central nervous system diseases. Neuropsychopharmacology. 2009;34:173–86. doi: 10.1038/npp.2008.174. [DOI] [PubMed] [Google Scholar]
- 17.Abo R, et al. Merging pharmacometabolomics with pharmacogenomics using ‘1000 Genomes’ single-nucleotide polymorphism imputation: selective serotonin reuptake inhibitor response pharmacogenomics. Pharmacogenet Genomics. 2012;22:247–53. doi: 10.1097/FPC.0b013e32835001c9. [DOI] [PMC free article] [PubMed] [Google Scholar]
- 18.Mitchell BD, et al. The genetic response to short-term interventions affecting cardiovascular function: rationale and design of the Heredity and Phenotype Intervention (HAPI) Heart Study. American heart journal. 2008;155:823–8. doi: 10.1016/j.ahj.2008.01.019. [DOI] [PMC free article] [PubMed] [Google Scholar]
- 19.Shen H, et al. Aspirin Resistance in healthy drug-naive men versus women (from the Heredity and Phenotype Intervention Heart Study) The American journal of cardiology. 2009;104:606–12. doi: 10.1016/j.amjcard.2009.04.027. [DOI] [PMC free article] [PubMed] [Google Scholar]
- 20.Paul S, Feoktistov I, Hollister AS, Robertson D, Biaggioni I. Adenosine inhibits the rise in intracellular calcium and platelet aggregation produced by thrombin: evidence that both effects are coupled to adenylate cyclase. Molecular pharmacology. 1990;37:870–5. [PubMed] [Google Scholar]
- 21.Linden MD, Barnard MR, Frelinger AL, Michelson AD, Przyklenk K. Effect of adenosine A2 receptor stimulation on platelet activation-aggregation: differences between canine and human models. Thrombosis research. 2008;121:689–98. doi: 10.1016/j.thromres.2007.07.002. [DOI] [PMC free article] [PubMed] [Google Scholar]
- 22.Hsiao G, et al. Protective mechanisms of inosine in platelet activation and cerebral ischemic damage. Arteriosclerosis, thrombosis, and vascular biology. 2005;25:1998–2004. doi: 10.1161/01.ATV.0000174798.25085.d6. [DOI] [PubMed] [Google Scholar]
- 23.Eltzschig HK. Adenosine: an old drug newly discovered. Anesthesiology. 2009;111:904–15. doi: 10.1097/ALN.0b013e3181b060f2. [DOI] [PMC free article] [PubMed] [Google Scholar]
- 24.Macchi L, et al. Resistance to aspirin in vitro is associated with increased platelet sensitivity to adenosine diphosphate. Thrombosis research. 2002;107:45–9. doi: 10.1016/s0049-3848(02)00210-4. [DOI] [PubMed] [Google Scholar]
- 25.Kemp-Harper B, Schmidt HH. cGMP in the vasculature. Handb Exp Pharmacol. 2009:447–67. doi: 10.1007/978-3-540-68964-5_19. [DOI] [PubMed] [Google Scholar]
- 26.Jackson EK, Cheng D, Jackson TC, Verrier JD, Gillespie DG. Extracellular Guanosine Regulates Extracellular Adenosine Levels. Am J Physiol Cell Physiol. 2012 doi: 10.1152/ajpcell.00212.2012. [DOI] [PMC free article] [PubMed] [Google Scholar]
- 27.Levine PH, Sladdin DG, Krinsky NI. Superoxide, xanthine oxidase and platelet reactions: further studies on mechanisms by which oxidants influence platelets. Thromb Haemost. 1981;45:290–3. [PubMed] [Google Scholar]
- 28.Patscheke H, Paschen W, Worner P. Superoxide-independent platelet response to xanthine oxidase. Hoppe Seylers Z Physiol Chem. 1978;359:933–7. doi: 10.1515/bchm2.1978.359.2.933. [DOI] [PubMed] [Google Scholar]
- 29.Schlesinger N, Schumacher HR., Jr Gout: can management be improved? Curr Opin Rheumatol. 2001;13:240–4. doi: 10.1097/00002281-200105000-00016. [DOI] [PubMed] [Google Scholar]
- 30.Louthrenoo W, Kasitanon N, Wichainun R, Sukitawut W. Effect of minidose aspirin on renal function and renal uric acid handling in healthy young adults. Journal of clinical rheumatology : practical reports on rheumatic & musculoskeletal diseases. 2002;8:299–304. doi: 10.1097/00124743-200212000-00003. [DOI] [PubMed] [Google Scholar]
- 31.Spychala J, et al. Cloning of human adenosine kinase cDNA: sequence similarity to microbial ribokinases and fructokinases. Proc Natl Acad Sci U S A. 1996;93:1232–7. doi: 10.1073/pnas.93.3.1232. [DOI] [PMC free article] [PubMed] [Google Scholar]
- 32.Iyu D, Glenn JR, White AE, Fox SC, Heptinstall S. Adenosine derived from ADP can contribute to inhibition of platelet aggregation in the presence of a P2Y12 antagonist. Arteriosclerosis, thrombosis, and vascular biology. 2011;31:416–22. doi: 10.1161/ATVBAHA.110.219501. [DOI] [PubMed] [Google Scholar]
- 33.Fiehn O, Wohlgemuth G, Scholz M. Setup and Annotation of Metabolomic Experiments by Integrating Biological and Mass Spectrometric Metadata. Proc Lect Notes Bioinformatics. 2005;3615:224–39. [Google Scholar]
- 34.Fiehn O, et al. Quality control for plant metabolomics: reporting MSI-compliant studies. Plant J. 2008;53:691–704. doi: 10.1111/j.1365-313X.2007.03387.x. [DOI] [PubMed] [Google Scholar]
Associated Data
This section collects any data citations, data availability statements, or supplementary materials included in this article.